Smart Money Structure | GainzAlgo📊 OVERVIEW:
================
Smart Money Structure Analysis is a professional-grade market structure and order-flow system designed to identify institutional trading behavior through volatility-adaptive logic, multi-timeframe trend alignment, and volume-based confirmation.
This indicator implements original mathematical models to detect Change of Character (CHoCH), Break of Structure (BOS), cumulative volume dynamics, and trend convergence across seven timeframes — delivering high-probability trade signals with significantly reduced noise.
Unlike basic indicator combinations, this system functions as a unified trading framework, where volatility adaptation, structure analysis, and volume confirmation continuously reinforce each other to provide precise, context-aware signals.
⭐ WHY THIS SYSTEM IS UNIQUE AND WORTHY OF PUBLICATION:
=====================================================
This is not a collection of common indicators placed together.
Smart Money Structure Analysis represents a cohesive institutional methodology, engineered so that:
- Volatility adjusts signal sensitivity in real time
- Multi-timeframe trends define directional bias
- Market structure determines timing
- Volume confirms institutional participation
- Advanced filters eliminate low-quality setups
Each component is mathematically linked to the others, creating a workflow that cannot be replicated by stacking separate indicators.
🔗 SYNERGISTIC INTEGRATION – HOW THE SYSTEM WORKS TOGETHER:
==========================================================
🧠 1. CONTEXT-AWARE VOLATILITY ADAPTATION
ATR-based volatility logic dynamically adjusts all momentum thresholds:
- Higher volatility → stronger confirmation required
- Lower volatility → sensitivity increases to capture valid moves
This prevents over-signaling in choppy markets and under-signaling during expansion phases — a core flaw in static indicators.
📐 2. MULTI-TIMEFRAME TREND CONVERGENCE ENGINE
Seven timeframes are analyzed simultaneously:
1M • 5M • 15M • 30M • 1H • 4H • 1D
Each timeframe is scored using EMA + VWAP alignment, producing a composite Trend Strength Score from -100 to +100.
The stronger the alignment across timeframes, the higher the probability of continuation — instantly visible through the real-time dashboard.
🏗️ 3. INSTITUTIONAL MARKET STRUCTURE (CHoCH & BOS)
The system automatically identifies the two core smart money concepts:
- CHoCH (Change of Character):
Signals potential trend exhaustion or reversal zones
- BOS (Break of Structure):
Confirms trend continuation and institutional commitment
Structure zones are visualized with persistent, color-coded levels and clouds, providing precise contextual timing rather than lagging signals.
📊 4. CUMULATIVE VOLUME DELTA (CVD) CONFIRMATION
CVD tracks the cumulative difference between buying and selling pressure:
- Rising CVD → accumulation
- Falling CVD → distribution
- Divergence vs price → early reversal warning
Volume participation is categorized into Low / Medium / High, adding depth beyond simple volume bars.
🛡️ 5. SIX-LAYER PROFESSIONAL SIGNAL FILTERING
Every signal must pass through up to six independent confirmation layers:
1. Volatility-adjusted momentum
2. Higher timeframe trend alignment
3. Lower timeframe conflict prevention
4. Institutional volume confirmation
5. Structural breakout validation
6. Repeated-signal restriction
This dramatically reduces false positives while preserving only high-quality institutional setups.
🧮 DETAILED CORE SYSTEMS:
========================
📏 ADAPTIVE MOMENTUM FORMULA
- Momentum Threshold = Base × (1 + (ATR ÷ Price) × 2)
- Pre-Momentum Factor = Base × (1 − (ATR ÷ Price) × 0.5)
📊 TREND STRENGTH CALCULATION
- Trend Strength = (Sum of 7 timeframe scores ÷ 7) × 100
📦 CVD LOGIC
- Close > Previous Close → Buy volume added
- Close < Previous Close → Sell volume subtracted
- Cumulative sum reveals institutional intent
🧠 STRUCTURE DETECTION
- Pivot-based swing logic
- Candle confirmation
- Configurable lookback periods
- Non-repainting visualization
🧩 ADVANCED ANALYSIS TOOLS:
==========================
🧲 LIQUIDITY ZONE DETECTION
Identifies probable retail stop-loss clusters where institutions often initiate stop hunts before true directional moves.
📦 MARKET PROFILE & ORDER FLOW IMBALANCE
Detects buy/sell dominance using volume ratios, highlighting accumulation and distribution zones before large price moves.
🔄 RSI DIVERGENCE SCANNER
Identifies bullish and bearish divergences that frequently precede structure shifts and trend reversals.
🎨 VISUAL SYSTEM & DASHBOARD:
============================
📊 SMART MONEY MATRIX
- Composite trend strength
- System confidence %
- CVD value
- Directional grid for all timeframes
📈 TREND PREDICTION MATRIX (Optional)
Forecasts short-term directional bias using trend, momentum, and volatility data.
🏷️ SIGNAL LABELS
- BUY / SELL → Fully confirmed entries
- READY → Momentum building
- BOS / CHoCH → Structure events
- FLOW / LIQ / BULL / BEAR → Advanced confirmations
⚙️ CORE FEATURES:
================
1. Multi-Timeframe Trend Convergence
2. Smart Money Structure Detection (CHoCH & BOS)
3. Adaptive Volatility-Based Momentum
4. Cumulative Volume Delta (CVD)
5. Six-Layer Signal Filtering
6. Liquidity Zone Detection
7. Order Flow & Market Profile Analysis
8. Divergence Scanner
9. Dynamic Trendlines
10. Institutional-Grade Dashboard
📘 WHO THIS INDICATOR IS FOR:
============================
- Scalpers: Noise-filtered precision on lower timeframes
- Day Traders: High-probability continuation setups
- Swing Traders: Multi-timeframe alignment & structure zones
- Reversal Traders: Divergence + CHoCH confirmation
⚠️ IMPORTANT DISCLAIMER:
========================
This indicator is a technical analysis and educational tool only.
It does not provide financial advice or trade recommendations.
Trading involves substantial risk, and losses are a natural part of trading.
Past performance does not guarantee future results.
All trading decisions remain the sole responsibility of the user.
Signalfilter

Gaussian Price Filter [BackQuant]Gaussian Price Filter
Overview and History of the Gaussian Transformation
The Gaussian transformation, often associated with the Gaussian (normal) distribution, is a mathematical function characteristically prominent in statistics and probability theory. The bell-shaped curve of the Gaussian function, expressing the normal distribution, is ubiquitously employed in various scientific and engineering disciplines, including financial market analysis. This transformation's core utility in trading and economic forecasting is derived from its efficacy in smoothing data series and highlighting underlying trends, which are pivotal for making strategic trading decisions.
The Gaussian filter, specifically, is a type of data-smoothing algorithm that mitigates the random "noise" of market price data, thus enhancing the visibility of crucial trend changes and patterns. Historically, this concept was adapted from fields such as signal processing and image editing, where precise extraction of useful information from noisy environments is critical.
1. What is a Gaussian Transformation?
A Gaussian transformation involves the application of a Gaussian function to a set of data points. The function is applied as a filter in the context of trading algorithms to smooth time series data, which helps in identifying the intrinsic trends obscured by market volatility. The transformation is characterized by its parameter, sigma (σ), representing the standard deviation, which determines the width of the Gaussian bell curve. The breadth of this curve impacts the degree of smoothing: a wider curve (higher sigma value) results in more smoothing, beneficial for longer-term trend analysis.
2. Filtering Price with Gaussian Transformation and its Benefits
In the provided Script, the Gaussian transformation is utilized to filter price data. The filtering process involves convolving the price data with Gaussian weights, which are calculated based on the chosen length (the number of data points considered) and sigma. This convolution process smooths out short-term fluctuations and highlights longer-term movements, facilitating a clearer analysis of market trends.
Benefits:
Reduces noise: It filters out minor price movements and random fluctuations, which are often misleading.
Enhances trend recognition: By smoothing the data, it becomes easier to identify significant trends and reversals.
Improves decision-making: Traders can make more informed decisions by focusing on substantive, smoothed data rather than reacting to random noise.
3. Potential Limitations and Issues
While Gaussian filters are highly effective in smoothing data, they are not without limitations:
Lag introduction: Like all moving averages, the Gaussian filter introduces a lag between the actual price movements and the output signal, which can delay decision-making.
Feature blurring: Over-smoothing might obscure significant price movements, especially if a large sigma is used.
Parameter sensitivity: The choice of length and sigma significantly affects the output, requiring optimization and backtesting to determine the best settings for specific market conditions.
4. Extending Gaussian Filters to Other Indicators
The methodology used to filter price data with a Gaussian filter can similarly be applied to other technical indicators, such as RSI (Relative Strength Index) or MACD (Moving Average Convergence Divergence). By smoothing these indicators, traders can reduce false signals and enhance the reliability of the indicators' outputs, leading to potentially more accurate signals and better timing for entering or exiting trades.
5. Application in Trading
In trading, the Gaussian Price Filter can be strategically used to:
Spot trend reversals: Smoothed price data can more clearly indicate when a trend is starting to change, which is crucial for catching reversals early.
Define entry and exit points: The filtered data points can help in setting more precise entry and exit thresholds, minimizing the risk and maximizing the potential return.
Filter other data streams: Apply the Gaussian filter on volume or open interest data to identify significant changes in market dynamics.
6. Functionality of the Script
The script is designed to:
Calculate Gaussian weights (f_gaussianWeights function): Generates the weights used for the Gaussian kernel based on the provided length and sigma.
Apply the Gaussian filter (f_applyGaussianFilter function): Uses the weights to compute the smoothed price data.
Conditional Trend Detection and Coloring: Determines the trend direction based on the filtered price and colors the price bars on the chart to visually represent the trend.
7. Specific Actions of This Code
The Pine Script provided by BackQuant executes several specific actions:
Input Handling: It allows users to specify the source data (src), kernel length, and sigma directly in the chart settings.
Weight Calculation and Normalization: Computes the Gaussian weights and normalizes them to ensure their sum equals one, which maintains the original data scale.
Filter Application: Applies the normalized Gaussian kernel to the price data to produce a smoothed output.
Trend Identification and Visualization: Identifies whether the market is trending upwards or downwards based on the smoothed data and colors the bars green (up) or red (down) to indicate the trend direction.

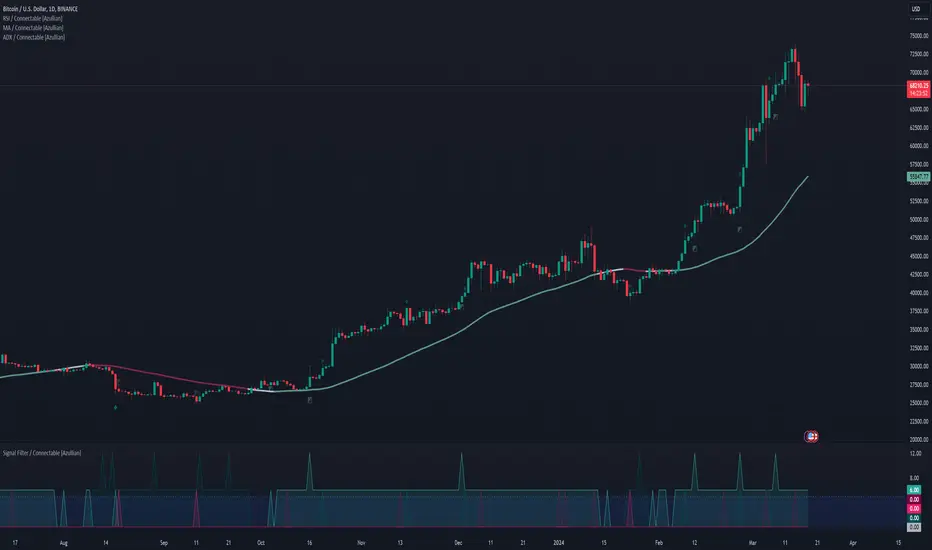
Signal Filter / Connectable [Azullian]The connectable signal filter is an intricate part of an indicator system designed to help test, visualize and build strategy configurations without coding. Like all connectable indicators , it interacts through the TradingView input source, which serves as a signal connector to link indicators to each other. All connectable indicators send signal weight to the next node in the system until it reaches either a connectable signal monitor, signal filter and/or strategy.
The connectable signal filter's function has several roles in the connectable system:
• Input hub: Connect indicators or daisy-chained indicators directly to the filter, manage connections in one place
• Modification: Modify incoming signals by applying smoothing, scaling, or modifiers
• Filtering: Set the trade direction and conditions a signal must adhere to to be passed through
• Visualization: When connected, the signal filter visualizes all incoming signal weights
Let's review the separate parts of this indicator.
█ INPUTS
We've provided 3 inputs for connecting indicators or chains (1→, 2→, 3→) which are all set to 'Close' by default.
An input has several controls:
• Enable disable: Toggle the entire input on or off
• Input: Connect indicators here, choose indicators with a compatible : Signal connector.
• G - Gain: Increase or reduce the strength of the incoming signal by a factor.
█ FILTER SIGNALS
The core of the signal filter , determine a signal direction with the signal mode and determine a threshold (TH).
• ¤ - Trade direction:
○ EL: Send Enter Long signals to the strategy
○ XL: Send Exit Long signals to the strategy
○ ES: Send Enter Short signals to the strategy
○ XS: Send Exit Short signals to the strategy
• TH - Threshold: Define how much weight is needed for a signal to be accepted and passed through to the connectable strategy .
■ VISUALS
• ☼: Brightness % : Set the opacity for the signal curves
• 🡓: ES Color : Set the color for the ES: Entry Short signal
• ⭳: XS Color : Set the color for the XS: Exit Short signal
• ⌥: Plot mode : Set the plotting mode
○ Signals IN: Show all signals
○ Signals OUT: Show only scoring signals
• 🡑: EL Color : Set the color for the EL: Enter Long signal
• ⭱: XL Color : Set the color for the XL: Exit Long signal
█ USAGE OF CONNECTABLE INDICATORS
■ Connectable chaining mechanism
Connectable indicators can be connected directly to the signal monitor, signal filter or strategy , or they can be daisy chained to each other while the last indicator in the chain connects to the signal monitor, signal filter or strategy. When using a signal filter you can chain the filter to the strategy input to make your chain complete.
• Direct chaining: Connect an indicator directly to the signal monitor, signal filter or strategy through the provided inputs (→).
• Daisy chaining: Connect indicators using the indicator input (→). The first in a daisy chain should have a flow (⌥) set to 'Indicator only'. Subsequent indicators use 'Both' to pass the previous weight. The final indicator connects to the signal monitor, signal filter, or strategy.
■ Set up the signal filter with a connectable indicator and strategy
Let's connect the MACD to a connectable signal filter and a strategy :
1. Load all relevant indicators
• Load MACD / Connectable
• Load Signal filter / Connectable
• Load Strategy / Connectable
2. Signal Filter: Connect the MACD to the Signal Filter
• Open the signal filter settings
• Choose one of the three input dropdowns (1→, 2→, 3→) and choose : MACD / Connectable: Signal Connector
• Toggle the enable box before the connected input to enable the incoming signal
3. Signal Filter: Update the filter settings if needed
• The default filter mode for the trading direction is SWING, and is compatible with the default settings in the strategy and indicators.
4. Signal Filter: Update the weight threshold settings if needed
• All connectable indicators load by default with a score of 6 for each direction (EL, XL, ES, XS)
• By default, weight threshold (TH) in the signal filter is set at 5. This allows each occurrence to score, as the default score in each / Connectable indicator is 6 and thus is 1 point above the threshold. Adjust to your liking.
5. Strategy: Connect the strategy to the signal filter in the strategy settings
• Select a strategy input → and select the Signal filter: Signal connector
6. Strategy: Enable filter compatible directions
• As the default setting of the signal filter has enabled EL (Enter Long), XL (Exit Long), ES (Enter Short) and XS (Exit short), the connectable strategy will receive all compatible directions.
Now that everything is connected, you'll notice green spikes in the signal filter representing long signals, and red spikes indicating short signals. Trades will also appear on the chart, complemented by a performance overview. Your journey is just beginning: delve into different scoring mechanisms, merge diverse connectable indicators, and craft unique chains. Instantly test your results and discover the potential of your configurations. Dive deep and enjoy the process!
█ BENEFITS
• Adaptable Modular Design: Arrange indicators in diverse structures via direct or daisy chaining, allowing tailored configurations to align with your analysis approach.
• Streamlined Backtesting: Simplify the iterative process of testing and adjusting combinations, facilitating a smoother exploration of potential setups.
• Intuitive Interface: Navigate TradingView with added ease. Integrate desired indicators, adjust settings, and establish alerts without delving into complex code.
• Signal Weight Precision: Leverage granular weight allocation among signals, offering a deeper layer of customization in strategy formulation.
• Advanced Signal Filtering: Define entry and exit conditions with more clarity, granting an added layer of strategy precision.
• Clear Visual Feedback: Distinct visual signals and cues enhance the readability of charts, promoting informed decision-making.
• Standardized Defaults: Indicators are equipped with universally recognized preset settings, ensuring consistency in initial setups across different types like momentum or volatility.
• Reliability: Our indicators are meticulously developed to prevent repainting. We strictly adhere to TradingView's coding conventions, ensuring our code is both performant and clean.
█ COMPATIBLE INDICATORS
Each indicator that incorporates our open-source 'azLibConnector' library and adheres to our conventions can be effortlessly integrated and used as detailed above.
For clarity and recognition within the TradingView platform, we append the suffix ' / Connectable' to every compatible indicator.
█ COMMON MISTAKES, CLARIFICATIONS AND TIPS
• Removing an indicator from a chain: Deleting a linked indicator and confirming the "remove study tree" alert will also remove all underlying indicators in the object tree. Before removing one, disconnect the adjacent indicators and move it to the object stack's bottom.
• Point systems: The azLibConnector provides 500 points for each direction (EL: Enter long, XL: Exit long, ES: Enter short, XS: Exit short) Remember this cap when devising a point structure.
• Flow misconfiguration: In daisy chains the first indicator should always have a flow (⌥) setting of 'indicator only' while other indicator should have a flow (⌥) setting of 'both'.
• Hide attributes: As connectable indicators send through quite some information you'll notice all the arguments are taking up some screenwidth and cause some visual clutter. You can disable arguments in Chart Settings / Status line.
• Layout and abbreviations: To maintain a consistent structure, we use abbreviations for each input. While this may initially seem complex, you'll quickly become familiar with them. Each abbreviation is also explained in the inline tooltips.
• Inputs: Connecting a connectable indicator directly to the strategy delivers the raw signal without a weight threshold, meaning every signal will trigger a trade.
█ A NOTE OF GRATITUDE
Through years of exploring TradingView and Pine Script, we've drawn immense inspiration from the community's knowledge and innovation. Thank you for being a constant source of motivation and insight.
█ RISK DISCLAIMER
Azullian's content, tools, scripts, articles, and educational offerings are presented purely for educational and informational uses. Please be aware that past performance should not be considered a predictor of future results.