VIX - SHORT - SVXY - Daily Chart (Oldinvestor)This looks at he VIX and trades SVXY. Load SVXY and run the script on SVXY.
INPUTS:
Entry - You set this number to how high you want the VIX to go before SVXY will be bought. Keep in mind it buys the bar after a trigger, results may be confusing
Exit - You set this number to how low you want the VIX to go before SVXY will be sold.
Year - This as stated, It will start trading on the year you set here.
Good luck.
This script is for learning purposes, and boy did I learn something. UVXY still sucks
Short!!!!

Multiple BTC RSIs in a single indicatorPlots in a single indicator the Bitcoin RSI of multiple exchanges. The selected exchanges are Bitmex, Binance and Coinbase. The reason is that these are the ones with the highest 24h volume (coinmarketcap) and have a ticker available in Trading View.
One drawback with this indicator is that it doesn't automatically adjusts its resolution when the Bitcoin chart is rendered across timeframes. You have to manually update the time resolution in the settings window for the indicator.

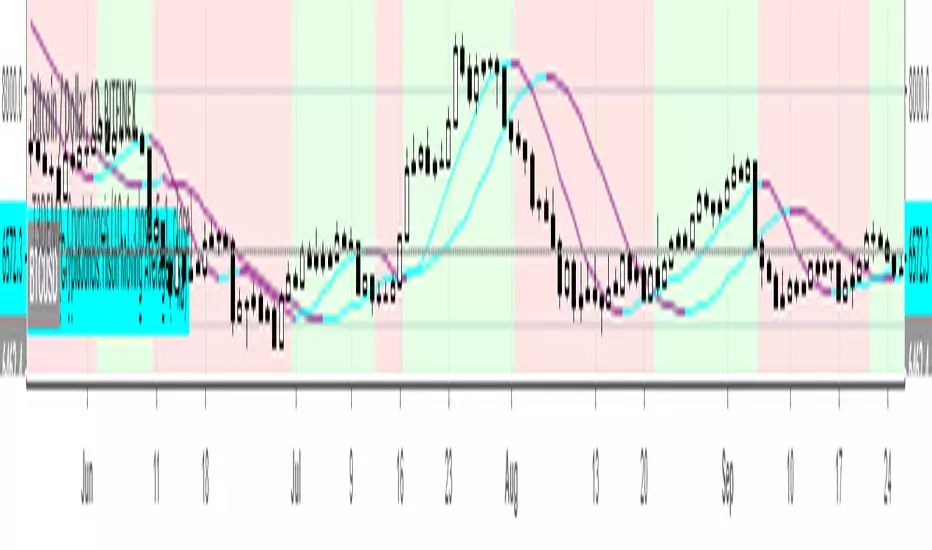
Hucklekiwi Pip - HLHB Trend-Catcher SystemThe strategy was authored by Hucklekiwi Pip back in 2015 and is still being updated today. She says that the system was designed to simply catch short-term forex trends. At its heart, the system is a simple EMA crossover strategy with a couple of other indicators used for confirming entries.
Strategy Rules
See her original post here:
www.babypips.com
Be sure to check out the updates and tweaks over the years!
HOW TO USE
For full information on how to use this strategy and how to correctly set the exit time, see this post:
backtest-rookies.com

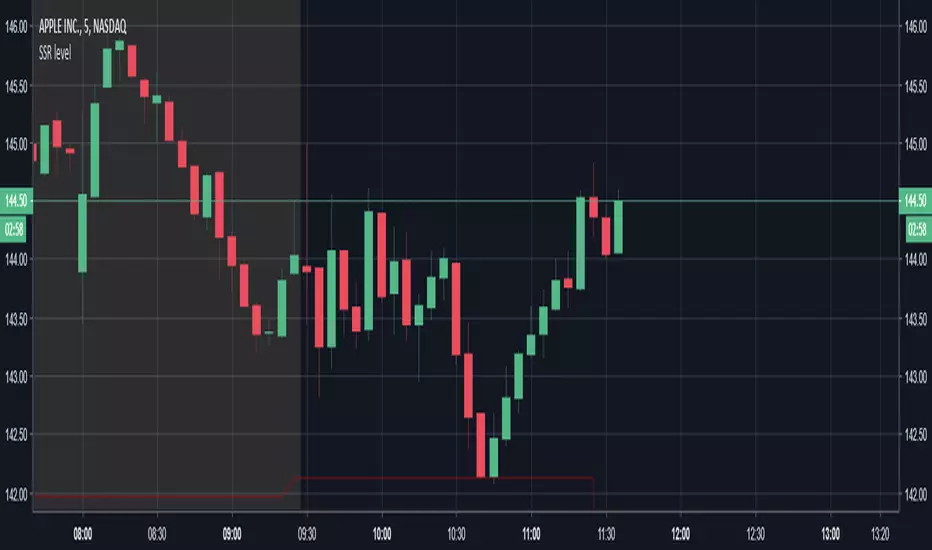
SSR - Short Selling Restriction PriceThis script draws the short selling restriction level in the intraday chart

ETHUSDSHORTS+ETHUSDLONGS - Bitfinex ETH Shorts & Longs & TotalBitfinex ETH Shorts & Longs & Total
There is "Shorts" & "Longs" & "Shorts + Longs" & "Shorts - Longs"


Bitfinex Sentiment Index [Long-Short]BSI provides two attractive graphs that breakdown the long (green area) and short (red area) positions ratio for the all Bitfinex margin cryptocurrency pairs only .
It is a quantitative measure of the bullishness or bearishness that can be used as a trading rule or in a trading system entries or exits. Included slow stochastic oscillator.

Speed_long_short-v2[WOZDUX]Indicator longs and shorts version 2.
------
Индикатор лонги и шорты версия 2.

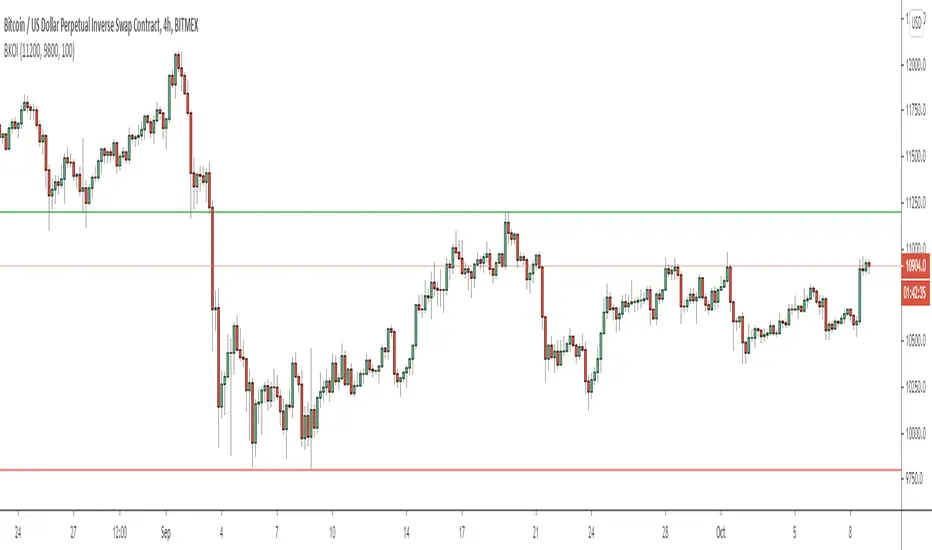
Breakout IndicatorThis script allows you to set breakout alerts.
An alert will be triggered only when price breaks and closes beyond the specified prices. You will get an alert on the first candle that closes beyond the levels you set.
LCI - Short Sale Restriction / SSR levelsThis script highlights the level at which a stock will go into SSR mode for the day. Useful when looking to short a stock
Total Power IndicatorHello traders!
This indicator was originally developed by Daniel Fernandez (Currency Trader magazine, 2011).
It is based on the two well-known indicators by Dr. Alexander Elder - Bulls Power and Bears Power.
Signals
1) Long when Bull and Total lines indicate 100 (it happens rarely)
2) Short when Bear and Total lines indicate 100 (it happens rarely)
3) Bull and Bear lines crossovers
4) Long when Bull line crosses Total line from below
5) Short when Bear line crosses Total line from below
6) Long/Short when Bull/Bear lines cross adjustable level.
Like and follow for more open source indicators!
Happy Trading!

T3DMA Trend DirectionI am using T3 moving averages to generate the idea of what kind of bias I should take in a current market.
So, how does this works?
When the close is higher than T3EMA10, the trend direction is upwards,
When the close is lower than T3EMA10, the trend direction is downward.
Using this, we can assume that there is higher probability for market to continue it's trend up or down, hence trade only in that direction. T3EMA5 is used to exit any open positions before trend changes it's direction.
Have a nice day trading and enjoy.
XRPUSD LONG/SHORT RATIO BITFINEXXRP longs and shorts on finex.
Red line -> Shorts
Green line -> Longs
Area -> Longs/Shorts normalized.

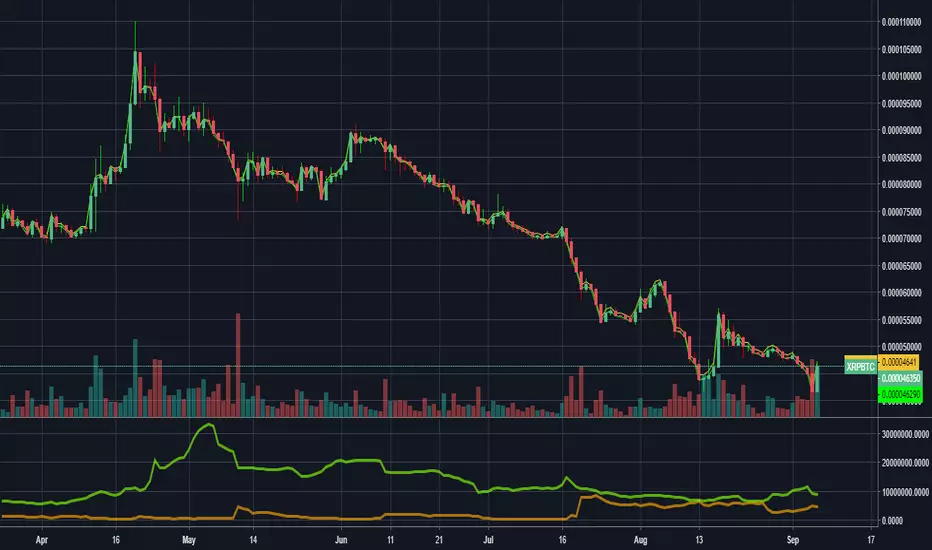
XRPBTCSHORTS XRPBTCLONGS - Bitfinex XRP Shorts & Longs// Created by titanlyy
// This script was inspired by @autemox who created the BTC version of this.
// Hope this helps. Peace out.
// 7th September 2018
BTC longs n' shortsA indicator that neatly shows you BitFinex margin longs and shorts that can be put on any chart!

Dumb Indicator 9 - Bitfinex Shorts X LongsThis is a way to study how the crypto market is going on Bitfinex, you can see the diference between the Long and Short terms on most popular pairs.

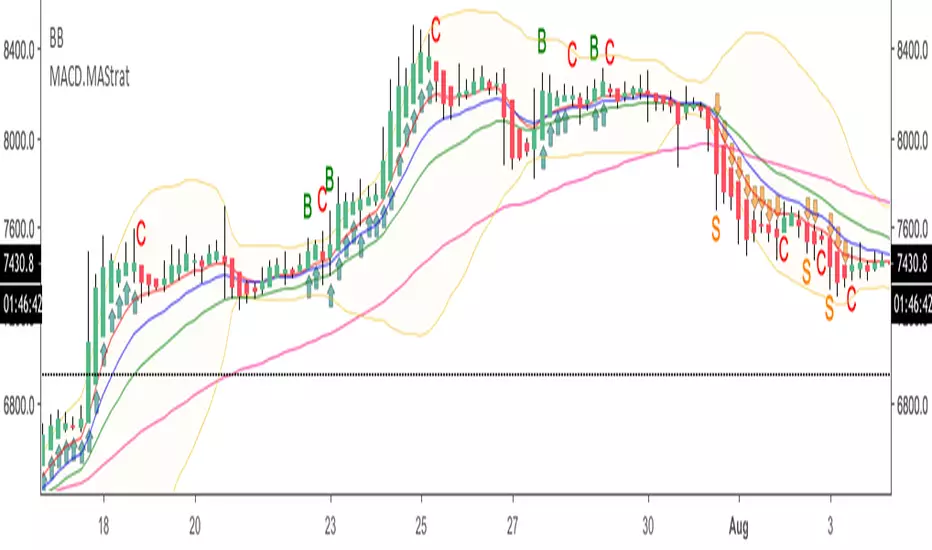
HA.MACD.MA.TradeSetupsHi probably trade setups indicator intended to be used with Heikin Ashi candles. It uses fibo EMAs and MACD to signal longs/shorts. Intended for scalping high cap coin with high volume on lower time frames.
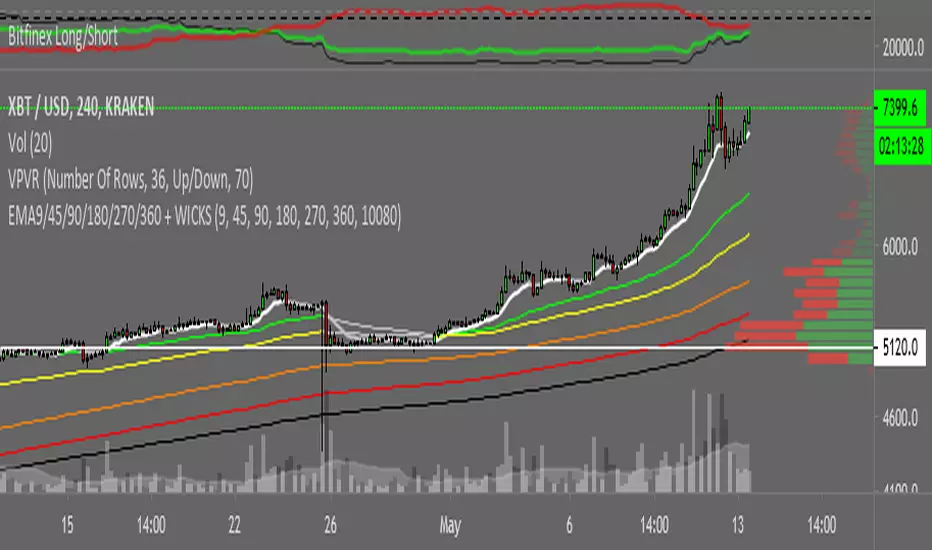
Bitfinex BTC longs vs Short & RatioSince the last BTC Short Squeeze on Bitmex maintenance I decided to made a Indicator plotting Long:Short ratio, and their respective graphs.
Green = Longs
Red = Shorts
Black = Ratio (Longs:Shorts)*Close <= Close price just for chart normalization!
I hope you find it useful.
NOTE: It isn't a prospective indicator, but try to find out who's bitching the market and when ;p

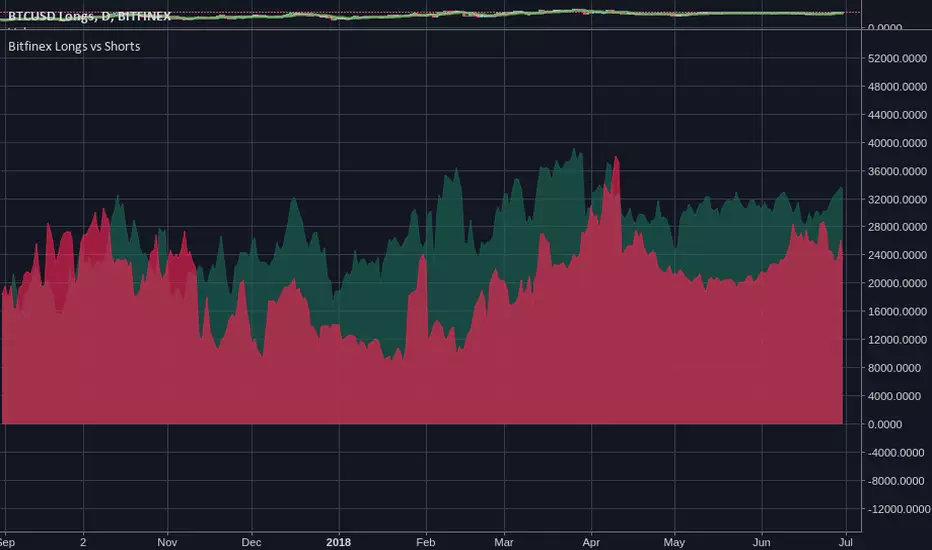
Bitfinex Longs vs Shortssexy view of the current long/short positions on Bitfinex. I saw some pay-for, hidden-source-code version of this and thought: "oh man."
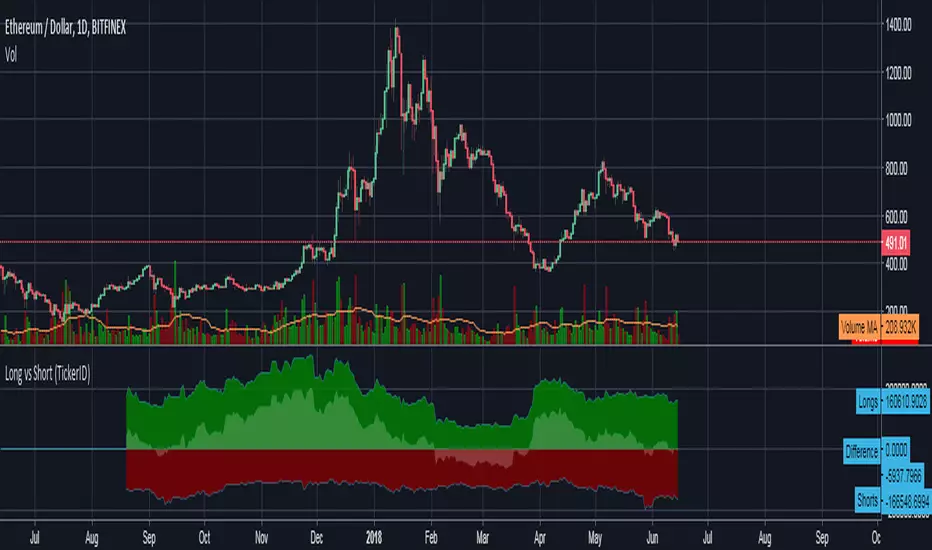
Bitfinex Long vs Short (TickerID)Uses the active ticker to show long/short values on all Bitfinex pairs that have that data available on Tradingview.