Session Opens - Asia, London, NY - VtrendThis script is designed to show the market session opens, for Asia, London and New York.
I couldn't find anything that fit my requirements so I decided to code one up!
You can either have symbols below, LO, AO and NYO - or background colors representing open times.. Or indeed both!
There are no alerts currently coded in, will update this one if i get enough requests.
Timeframe wise, works best under 1 hour, will not plot above that.
Also it does not plot the weekend open times.
Session

Price Action All In One IndicatorIf you are the one who is "Price Action" style & does not want to use many indicators or complex indicators or you are an ICT (The Inner Circle Trader)
student or ICT charter, this simple beautiful All In One Indicator is right for you.
The indicator has the following functions.
TIME ZONE SETTING
The default timezone is New York Time GMT-4, if you leave the time zone setting blank, it will use the symbol timezone. Note that the trading time changes with one hour delay in winter. so if you just trade forex, and leave the time zone setting blank, TradingView will adjust the symbol timezone automatically for you or don't forget to change the timezone setting GMT-4 or GMT-5 depending on daylight saving time.
STATISTIC PANEL
You can choose which panel to show through settings.
Session Info Panel : pips info of ADR, Asian, London, and New York sessions.
Trend Panel : showing trend (up/down) of
5m/15m/1h/4h/D/W time frames (TF)
4MA (default values: SMA with lengths: 20–50–100–200)
Money Management Panel : in trading, money management is very important. Just put the % risk, & stop loss value below, the indicator will calculate a suitable size/amount for each trade.
Size by Lots: input stop loss in pips
Size by Units: input stop loss in % (of price)
(*)Units size is calculated by % stop loss & current bar close price. You have to determine a stop-loss price to convert to % stop loss by yourself.
TIME SEPARATORS
We can choose which time separators we want to display. The indicator has 5 options: Anchor Time/Day/Week/Month/Quarter. Of course, we can choose to show just one or all 5 of them.
With Anchor Time you can choose which time you want to draw a vertical line for better timing analysis. This can show up to 2 Anchor Time lines. The default values are 00:00 (New York Midnight Opening) and 08:30 (New York Session Opening). You also have an option to show the past lines or not.
About Day Separator, cause TradingView has supported Session Breaks in Setting but if you don't like to use it or when enabling, it distracts you, you can use mine. My favorite trading dates are Tuesday & Wednesday.
PRICE LEVELS
For intraday trading, the high/low/close of the previous day, the previous week, ADR (default period is 5) are very important key levels. You can choose which one you like to show for better analysis. Of course, you can change the color & style of the lines. This is also my favorite indicator.
This indicator also has an option to show up to 2 price lines at a specific time, you can choose the price type (high/low/close/open) that you want to display. The default time values are:
Specific Time 1: 0:00. (New York Midnight Opening Price)
Specific Time 2: 8:30 am. (New York Session Opening Price)
ACCUMULATION ZONE
The market tends to reprice the higher/lower to the old high/low or imbalance/fair value price to promote buy/sell stops or to provide smart money pricing for long/short entries. Typically, it redistributes quickly and you must learn to anticipate them at key levels intraday. Weak short/long holders will be squeezed in the retracement.
Except for the open price, the price changes continuously until the closing time, so the accumulation area can also be changed in real-time, but if you combine it with other information when analyzing, you can predict/determine whether the zone has been established or not with high probability. In short, price needs time to be accumulated, I usually don't pay attention to this daily zone till London open/close or New York sessions
Not only daily zone, but the indicator also supports higher timeframes accumulation zone from
SESSION & STD
There are 3 sessions: Asian, London, New York. The default values are below (New York Time).
Asian: 19:00 ~ 00:00
London Open (London KillZone): 01:00 ~ 05:00
New York Open (New York KillZone): 07:00 ~ 10:00
If you do not want to show the label, just leave the label values blank or change them to whatever you want.
This is one of my favorite functions. I use it on 15m, 30m, 1h TF for Forex intraday trading. My favorite trading sessions are London Open & New York Open.
You also can choose to show or not Standard Deviations (STD). The default values are set for Asian Range STD and max STD levels can be shown are 5. I use the following 3 types of STD (New York Time):
CBDR (Central Bank Deviations) STD: 14:00 ~ 20:00
Flout STD: 15:00 ~00:00
Asian Range STD: 19:00 ~ 00:00
LOOKBACK HIGH/LOW/MID
Can show high/low/mid of the data ranges on the daily/4h chart. The default values are:
- 20–40–60 days back from today for daily TF.
- 30–60–90 bars back from the latest bar for 4h TF.
The default anchor bar for calculating the lookback is the latest one but with:
- 4h TF: we can change the lookback from the 1st day of the week.
- Daily TF: we can change the lookback from the 1st day of the month.
The indicator also has options showing the high/low/mid (equilibrium level) lines for better analysis. Especially, on daily TF, we have the option that can show up to 4 lines (25% for each one) of the data range.
Of course, you can change the colors or the style of the high/low/mid lines.
The lookback can be shown on the lower TFs for better detection when the market structure is shifted.
MAGIC BARS
Fractal bar : The bar's color is changed when the divergence occurs between the price & RSI. You can change the RSI period (default value is 14) & RSI source. (open/high/low/close,…)
Imbalance bar or liquidity void or fair value gap - whatever you call it. This is my favorite indicator when trading on all TFs.You can choose to extend the last n imbalance bars if you like in the settings. I make sure I covered all cases of imbalance/fair value gap.
OLD HIGH/LOW
First, this function is not used as the common Support & Resistance that retail traders usually use, so I call it Old High/Low. I usually use it in 2 ways:
Detect the next buy/sell stops that Market Makers aim to manipulate.
Detect whether market structure shifted or not (Break of structure)
In settings you can:
Set the period to detect high/low levels, the default value is 10. My other favorite values are 6 & 2.
On a lower time frame, you might want to set it to a large number to remove noise.
On a higher time frame, a small number is enough, I think.
Choose the numbers of the last lines you want to show on your chart.
Of course, the style of lines can be changed easily.
TRENDLINES
A very simple trendline with default pivot left strength is 10.
By default, trendline uses high/low price but you have the "Using close price" option.
LINEAR REGRESSION CHANNEL
The Linear Regression Channel is a three-line technical indicator used to analyze the upper and lower limits of an existing trend. It is a statistical tool used to predict the future from past data and is used to determine trend direction or when prices may be overextended.
You can choose
To fill the background or not
To show inner/outer lines or not
To change the colors/line styles of upper zone, lower zone, upper lines, lower lines, midline
DIRECTION BOX
Working on all TFs, this looks like the same with lookback function but if you would like to display them in a box for easily focusing/comparing with other symbols or for detecting divergence in a specific period. The indicator also has a setting to show or hide lines connecting between lows or highs.
Another example of how I use High/Low connecting lines to detect divergence between S&P 500 and NASDAQ 100.
ZIG ZAG
Can show up to 2 ZigZag lines.
This is suitable for traders who have difficulty in detecting key levels (recent high/low) of the prices to confirm market structure or just for drawing Fibonacci easily at those levels.
MA (Moving Average)
I believe that this is one of the most used indicators for every trader. There are 5 types of MA to choose from: EMA, SMA, WMA, VWMA, SMMA(RMA).
This can show up to 4 MAs. You can choose the source (close/high/low,…) for each one. My favorite values are 34 & 89 EMA.
This indicator also supports MA Bands. You can select which MA you want to display the bands, and the "width" of the bands can be changed via the settings.
WATERMARK
It's just a simple function but I think it's very useful for those who want to add Copyright info to the chart, to prevent others from copying it.
Others/known issues/limitations
In forex or stock (things that are traded only on weekdays), TradingView's does not include the latest bars till Monday so the Day Separator cannot fill that space. Because TradingView deals with those bars as Sunday's ones so I set the color of Sunday the same as Friday for good UI/UX. On Crypto charts, the indicator shows without problems.
If you see "Internal server study error", please try closing the current TradingView tab in your browser and reopening it in a new tab. The error will disappear.
Because TradingView does not provide any detailed error information when such "general error" occurs. It's very difficult to detect which function is causing this error or is there something that caused TradingView "overloaded" through a long time running/loading on that tab? Honestly, I don't know exactly the cause, but in my experience, this error often occurs in the following cases:
When you have the TradingView Tab open for hours. In my case, I usually leave TradingView tab open overnight & when I come back the next day, this error might appear. (I'm a Mac user & I almost never shut down my Mac)
When you change settings too many times, especially settings of drawing objects like line width in a using session, it might cause this error.
So, after changing the setting or when you come back for the next trade, please save & close that TradingView tab, and then open a new one, everything will work fine.
You can see the images below that show I have tested my indicator from 1-minute time frame, enabled all functions, change every setting to max values & everything still works fine.

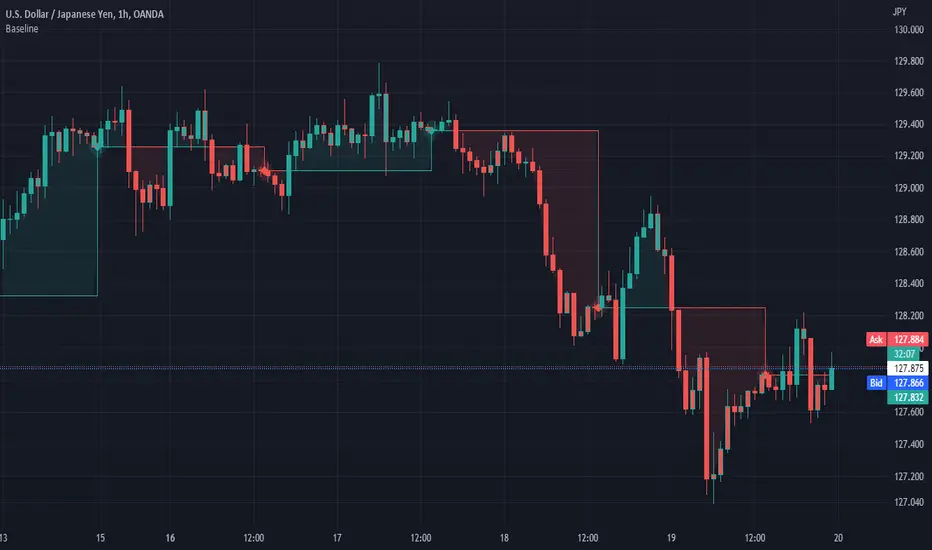
Baseline (BL)My baseline study lets you compare price to the previous days close. You can select the time frame for this baseline. I have included the ability to use a custom period length or your own anchor value. Custom anchor values are great for comparing the price to your cost average. The features I have included are bar color and background color.
I liked the idea of the 'baseline" chart but I didnt like the implementation.
Enjoy
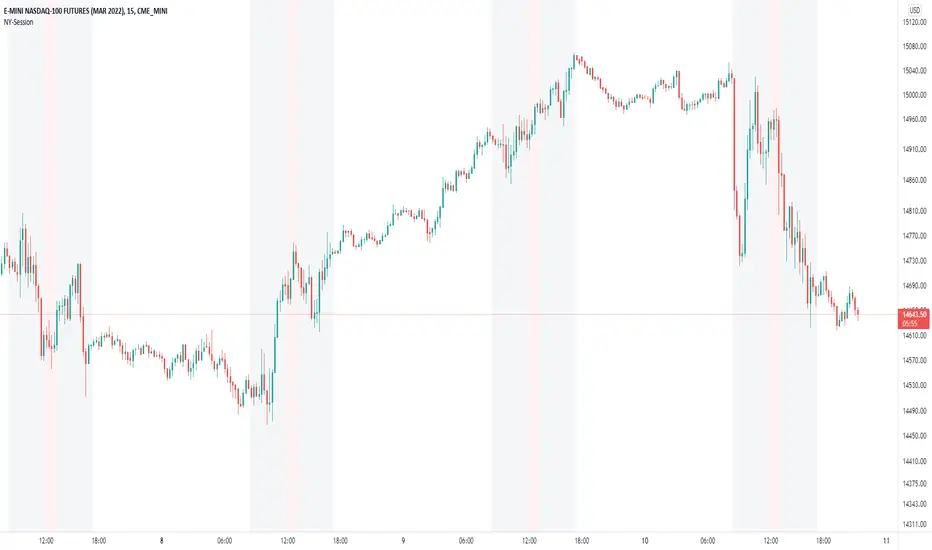
ICT Index Futures Session LinesICT Index Futures Session Lines
Description:
The script is based on one of ICT's concepts on trading Index Futures. The script lays out the daily range from an intraday basis.
Range:
00:00 - New York Midnight
08:30 – New York Open (News events come out)
12:00/13:00 - New York Lunch (No trade time period)
13:30 - (Algorithm)
16:30 - Close
* The open, high and low lines are plotted from 00:00 to 08:30
How To Use:
You will need to check the daily bias. Prior to 8:30 you are to look for previous swing points where liquidity may exist. During the open you want to see if a high or low is taken out, and then wait for an energetic break/displacement for a potential FVG/imbalance retracement entry.
Strategy is for LTF (1 to 15m)
Default time zone is set to America/New_York (UTC New York), so lines will be plotted correctly regardless of user’s local UTC chart setting.

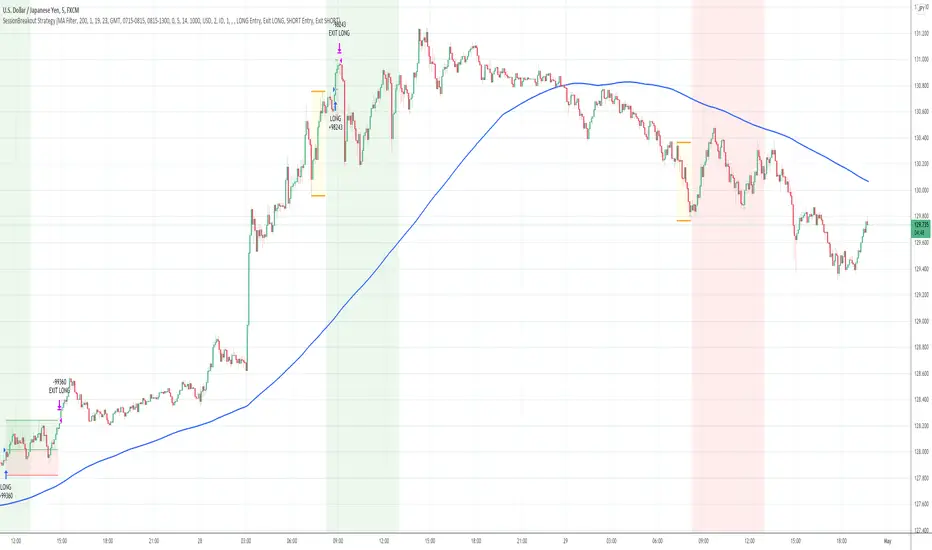
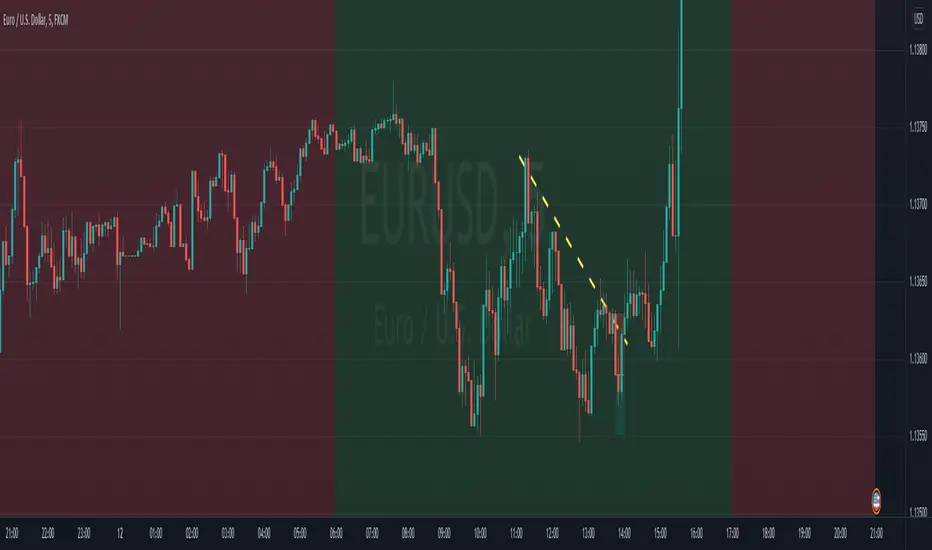
Session Breakout Strategy [Kintsugi Trading]What is Session Breakout Strategy?
This premium indicator was inspired by my desire to find and place high probability forex trades in any market, direction, or time of day.
Why Forex?
The Forex markets operate 24 hours, 5.5 days a week
Access to meaningful leverage
Ability to easily trade long or short
High liquidity
How to use it!
----- First, start by choosing a Range Session and Trade Session. -----
- Range Session = Period of time you believe will be predictive of future price action. I like to overlay 'FX Market Sessions' by boitoki to target timeframes in which forex market sessions overlap. This period is indicative of buyers and sellers battling it out in an effort to choose a direction.
- Trade Session = Period of time you believe the price will act on the information gathered from the range session.
----- Next, we filter the Range Session by information that will help further predict price movement in the Trade Session. -----
Our tools are:
Moving Average Filter
Average RSI Filter
RSI Decision Level
None
Each parameter is customizable.
----- Next, we set our risk. -----
Enter the "stop pip size' you desire.
Enter the 'target profit pip size' you desire.
We can set out ($) dollar risk-per-trade in the inputs. The script does not know your actual account balance, so if you want to risk $100/trade you would enter '$10,000' in the account balance section and '1' in the Risk Per Trade% section.
For example, an '8' stop and an '8' tp would indicate a 1:1 risk-reward. *Note - although you may generate a higher win percent with a less favorable RR, it is rarely worth it.
----- Finally, we backtest our ideas. -----
After using the 'Strategy Tester' tab to thoroughly backtest your predictions you are ready to take it to the next level - Automated Trading!
This was my whole reason for creating the script. If you work a full-time job, live in a time zone that is hard to trade, or just don't have the patience, this will be a game-changer for you as it was for me.
Auto-Trading
When it comes to auto-trading this strategy I have included two options in the script that utilize the alert messages generated by TradingView.
*Note: Please trade on a demo account until you feel comfortable enough to use real money, and then please stick to 1%-2% of your total account value in risk per trade.*
AutoView
PineConnector
Good luck with your trading!
Trading Sessions - SonarlabThe Trading Sessions indicator shows the most significant trading sessions for the Forex market, such as London, New York and Asian.
The sessions are presented as colored boxes on the chart, thereby clearly indicating open and close times of a particular session, as well as its trading range.
How is this Forex market session indicator used?
Traders normally use trading sessions to determine the volatile hours throughout the day, since the trading activities vary from one stock exchange to another.
London and New York market trading sessions are considered to be the most volatile, especially during the 4-hour overlap.
There are also strategies aiming only at the opening of the London session or those that allow trading only during the Asian session.
Backtesting
When testing out your strategy this Indicator can be handy to use while backtesting in Tradingviews replay mode. Only backtest the sessions you will normally trade.
Settings:
For each session:
Time beginning - end
Show session range or only beginning
Colors
Overlay type: BOX/ Background/ High - Low
Display settings statistics
ADR
Mid line (50%)
Range

Session LevelsThis indicator plots important session (intraday) levels for the day. It plots high and low of previous day, week, month, 52 week and all time. Also plots the vix range which shows the daily expected trading range of the instrument. These levels acts as important support/resistance for the day.
For example, if price closes above previous day, week, or month high/low it indicates bullish sentiment and vice versa for bearish.
Vix Range plots top, center, bottom line for expected trading range for the day. It is calculated based on the volatility index selected (NSE:India VIX is used by default).

Phantom - My Session RangeThis is a modification of a script by RobMinty, "FXN - Asian Session Range" The script provides functionality to track specific trading sessions based on user preference rather than just the market sessions open and close. The idea is to help you hold yourself accountable to your specific trading times as well as backtest various marketing timings suitable to your schedule.
This script utilizes RobMinty's pine code to visualize your market session. We have adjusted the script to project the end of the session before the candles print - as well as adding/subtracting the horizontal and/or vertical lines around the current session box. This should help you understand how much time you have left in your session with a quick visual representation. While we have made some additions and adjustments to RobMinty's script- The inputs and functions of the combined script have not changed significantly from the originals. Like the originals, the code has been made open-source. If this script is reused or modified, please provide credit to RobMinty. If you plan to use this specific code with the ability to remove lines from the box and project session end forward, please credit both of us.
Session Bar CountingIf you follow Al Brooks - he has a bar counting overlay from the start of the session.
The timing is set to Trading View - EXCHANGE TIME - so customise the start of the session you like.
Enjoy!

Day/Week/Month/3M/6M/12M MTF breaks by makuchakuThis indicator plots breaks for multiple timeframes. Works on Daily to Yearly timeframes.
Currently supported timeframes :
Daily
Weekly
Monthly
Quarterly
Half Yearly
Yearly
It currently plots all breaks together. From Indicator settings hide what you don't need and save as default settings.

Ultimate Time Filter V1The only time filter that you will ever need.
Easily filter for:
--> Start/End Dates
--> Weekdays
--> 1 or 2 Daily Trade Sessions.
This is open source on purpose so you can enjoy ease of use on your own codes. Simply copy the code and use the variable "inTime" to filter bars that fit your time constraints.
I spent a lot more time on this than I'd like to admit but so be it. Any comments for improvements, or questions on how to use the script is appreciated. Or if you wanna chat about trading / pine script hit me up on Discord.
Cheers

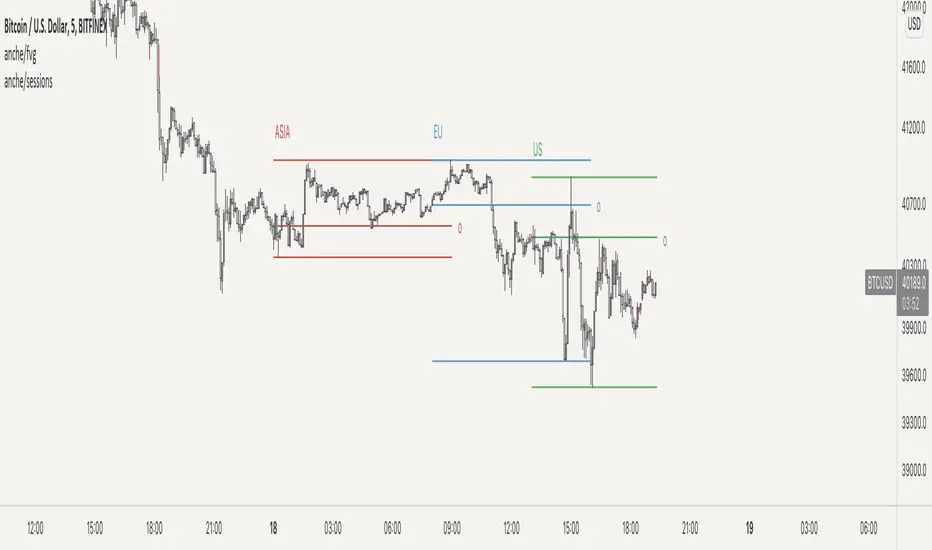
Market Sessions (including extended hours) by Anche█ MARKET SESSIONS BY ANCHE
this script allows you to define up to 4 different sessions and plot those on your chart. It makes it easy to see when these sessions started and ended and what the price level is when the session opened. It's for example beneficial to see when sessions overlap, because at those times there might be more volume , because more people are active within a market.
█ CONCEPTS
• plotting these sessions onto a chart can help you see overlap of 2 or more sessions. An overlap means more market participants, which can hint to an increase in volume .
• when the indicator shows all historic sessions, you can spot certain trends, for example that an asian market is generally more bearish and EU more bullish , or vice versa.
█ FEATURES
• up to 4 sessions
• customisable session labels
• customisable session times
• extended hours (on/off)
• timezone sync
• show past sessions
█ VISUAL FEATURES
• session plotted by top + bottom line or a box
• show session open
• customisable colors per session
• customisable lines (width/style/color)
• different visual settings for extended hours
• customisable label sizes
Fusion: Forex sessions with daylight savingsThis has multiple ways to see Forex sessions as I found both on the main chart and on a separate chart useful at different times so this gives you the benefit of both.
When you want to use this separate from your main chart uncheck it the option "On main chart".
On the main chart we can show:
The legend
Boxes
Labels
Breakout check area
Start & end labels
On any other chart area we can show:
The legend
Horizontal bars representing the sessions.
All objects are color coded and the legend shows the color codes.
Credit:
Blended my own sessions indicator and "FX Market Sessions" by boidoki
The code is structured to easily drop into a bigger system so use it as a lone indicator or add the code to some bigger project you are creating.
Finally, if you find value please do make a comment, give thumbs up etc.
Enjoy and good luck!

Time Session Filter - Visual Only - @Davi117 Simple visual adjustable time filter to highlight certain times of the day.
For instance if you only trade between 06:00 and 10:00 etc.
Includes Time Zone Selector using GMT
E.g if you live in London then you time zone will be just GMT, else if you live in Paris it would be GMT+1.
Ensure Trading View's time zone selection in the bottom right to the left of the Auto Scale toggle, is also set also set to your time zone, else it will be misaligned.
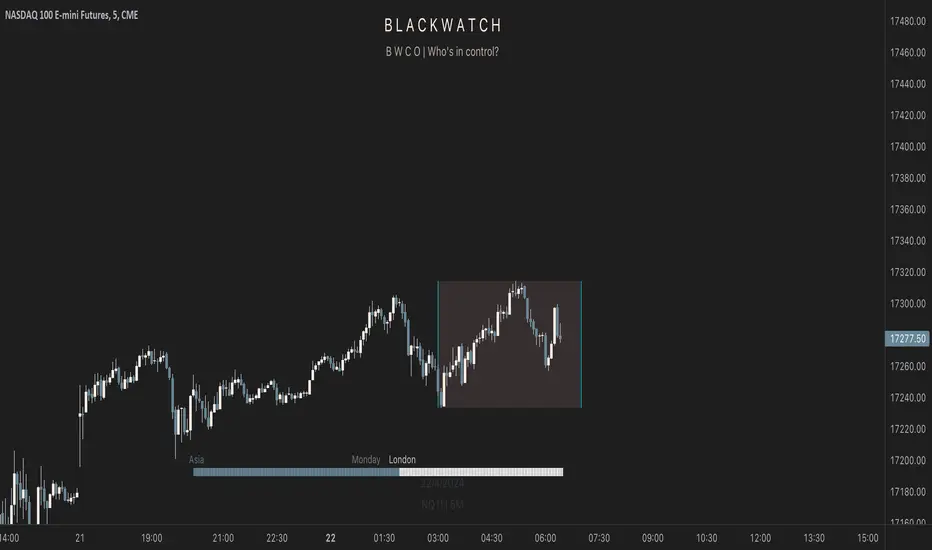
Session Levels - Ultimate Range IndicatorSession Levels - Ultimate Range Indicator
Primarily developed for trading the E-MINI Futures Markets like NQ or ES from the CME Group,
but also more than suitable for Crypto or other instruments.
This indicator highlights the chosen session, which can be Globex, Asian, London and New York.
It plots the important levels and also renders the Opening Range as it forms (a.k.a. Initial Balance).
After the 1st hour Opening Range is finished, it can plot the Standard Deviations / Projections.
See below for a complete feature list.
All Opening Ranges on chart and for the New York session the Range Projections are turned on:
s3.tradingview.com
How to use (example):
If you are trading the Nasdaq Futures (NQ!)
Enable the Globex Overnight session. Basically in the Futures Market, the Globex session is everything outside of US trading hours of Stocks. This draws the important overnight levels, like the Low, 25%, 50%, 75% and the High.
Enable the New York Session with Levels and Opening Range. Generally, 70% of the time the 1st hour will put a Low or High of the day.
If the price is trading above the Globex Low, most likely the Low of the Day is formed and the price target for the day will be 1.5x Standard Deviation and 2x Standard Deviation.
[*} Deviation of the Initial Balance depends on the volume ad overall market structure.
** This is not financial advice or any guarantee **
Features:
Show each Session Highlighted on Intraday chart in it's own color (each session can be turned off and has customizable times and color)
Show Line Levels of each session: Low, 25%, 50%, 75% and the High (customizable color)
Show the Opening Range (Initial Balance) of the Asian, London and New York session. Note: NY has more options.
Opening Range is displayed as a box with level lines (customizable color)
Levels are drawn to the end of the NY Cash session (customizable time)
Show IB Standard Deviations 0.5 - 3.0. Calculated from the Opening Range (Initial Balance)
Option to display Higher Timeframe levels: Previous Day Open/Close and Previous Week Open/Close
All level lines and OR boxes size dynamically as the session progresses
Built in Alerts for when price hits key levels. e.g. Alert when price crosses the NY Opening Range High. Or an Alert when the first STDEV is hit.
Option to toggle display of drawings for Today's trading session only, or Show all recent session levels. This keeps the chart clean or not.
Extras:
The NY Opening Range also has a 50% level line
The NY Opening Bar can be highlighted separately
The Level Lines can have small labels turned on/off. Values are only shown on mouse over to keep a clean chart
Keep in mind:
1) This indicator works on all instruments, but on instruments with limited market hours, your chart setting
has to be set to "Extended Hours" otherwise. For example TSLA on NASDAQ.
2) The Exchange Time Zone for the CME Group is Chicago UTC-6. So the session times you configure in the settings menu are based on that timezone too.
3) Globex opens at 5pm CST and closes when the US session starts 8:30CST.
4) When enabling the Alerts in the Indicator settings, be sure to also create an alarm for this indicator using the Alarm function of Tradingview.

Sessions with High/Low DiffThe main purpose of this indicator is to facilitate backtesting, but it may also be useful for traders to easily identify the current
active/open trading sessions on lower-timeframe charts.
This indicator also tracks the session high/low difference and plots it as a label on the last candle of the session once the last
bar of that session has finished printing and a new candle opened. The position and direction of the label is based on the
session open and close - if the session open is greater than the session close (which would equate to the equivalent of a red candle),
the label will be printed UNDER the last candle, and vice versa if the session close is above the session open.
The number printed inside the label is the difference between the session high and the session low, scaled to the minimum tick value of the chart.
Note #1: There is a Pinescript maximum of 500 labels allowed on any chart. While I could have gotten fancy and done some wizardry with label arrays,
I didn't really see a point to it. If labels are enabled for all 4 sessions at the same time, that would still have them available for the past 125
sessions, which would be about 6 months (approx 252 trading days per year, and this would cover 125 of them). If you limit to 2 sessions, you double
your potential look-back to almost a year (250 days out of the 252 average trading days each year), and for a single session, you double it yet again
to just under 2 years.
Note #2: As this indicator tracks open, high, low, and close for each session, it can potentially be enhanced (or forked) to construct "session candles".
I'm not sure what use this would be to anyone, but the pieces are there should someone find a use for it.
While it would be easy to add alerts on sessions opening/closing, I didn't see a purpose or value in that as it would be little more than a
glorified alarm clock. If I get enough demand to add them, I will gladly consider it.

DTFL FOREX OverlayThese tools are used by FOREX traders who primarily follow the DTFL trading strategy, however, they can easily be utilized by any other FOREX trader looking for an all-in-one indicator that includes sessions, previous high/lows, session values, various moving averages and lockable ADR/ATR lines.

FX Sessions - All in OneFX Sessions - All In One
This Script offer a wide variety of goodies
SESSION OPEN
it will draw a line for the TOP, MID and LOW of the asian session (you can adjust the hours of the session)
It will draw a line for the TOP and LOW of the London Session (you can adjust the hours of the session)
It will draw a line for the TOP and LOW of the NY Session (you can adjust the hours of the session)
SEPARATORS
while on lower timeframe, you will have a separator for days that occurs at midnight NY time
While on Daily timeframe, you will have a separator that will separate every month, on the 1st trading day of that given month
IMBALANCE
The candle leaving imbalance (a candle where there is a portion that is not matched with a price action left or right)
NY Midnight opening price
a dotted line will be drawn (up to 500 bar limitation) from NY open until it reaches either the 500 bar or the end of the day.
on lower timeframe (below 3 minutes) the bar will not reach the end of the day

session min/max support&resistance [LM]Hello traders,
I would like to present you session min/max support&resistance indicator. The idea behind is to calculate min and max per session and render line at those levels and bars until the price reach the level. With this you can see levels where the price didn't reach with granular control over how many lines can be shown.
Indicator has following settings:
General control - where you can select session interval and show/hide labels
Line control - where you can adjust type of line, color of up/bottom level..
I hope you will enjoy it,
Lukas

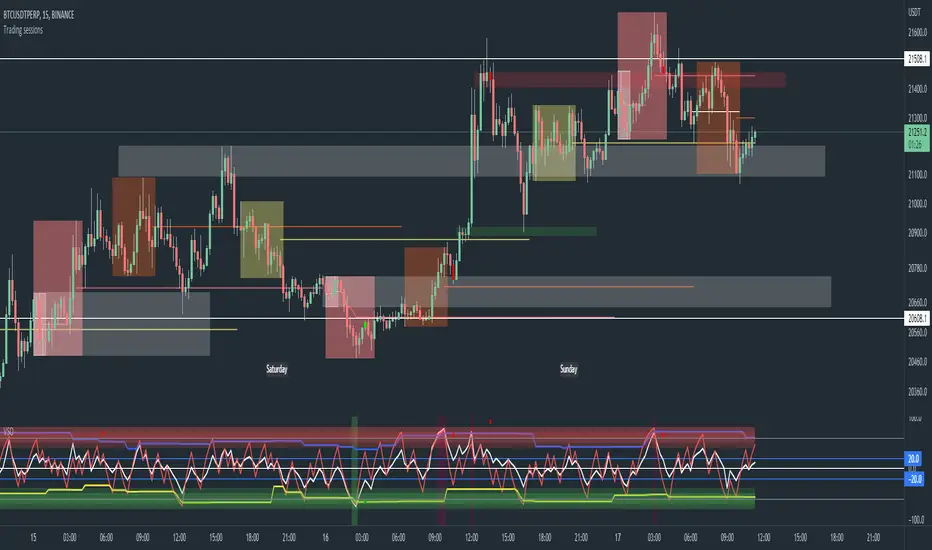
Trading sessions, Ichimoku and Classic Pivots█ OVERVIEW
This a self contained intraday trading style for crypto/forex made to be on and traded on 15-min.
This Script Creates a box around each major session to a trading range, include highlights for the first 12 15-min candles, classic Pivot points and ichimoku cloud.
█ CONCEPTS
1 — Session boxes and ranges are based of the times from Steve from Beat the market maker, and you have the option in setting to have an extension for the high/low until the start of the next box calculation.
2 — 12 candle window, this marks the first 3 hours after a open;
The first hour - stop hunt
The second hour - big moves
The third hour - tend continuation or reversal
3 — The Days of the weeks are labelled and coloured;
Weekends are in grey, ideally no trade days.
Monday, Tuesday, Thursday are green, to mark the week days
Wednesday is red to be mindful of mid week reversal
Friday is red to mark the end of week
4 — Ichimoku cloud, by default the only thing visible is the kumo cloud, but in setting you can turn the line back on. Ichimoku proves a great mark for areas to look for support and resistances.
5 — Lastly, you have classic pivots, by default they are extend to the right and on weekly, Each level act as support and resistance. Look for Bullish momentum at R3 for a larger moves to the upside.
Ichimoku and the pivot are here mainly for when you want to do higher time frame analysis.
█ OTHER SECTIONS
• HOW TO USE
Example of a trade
**Key thing to remember is London will set the high in a down trend and the low in an up trend
you can see the first hour look for stops and stopped at 50% of the range set coming into the session, the second hour a big move to the down side hitting 200% expansion then the third hour reversal stopping wick up then
back down from from London low. before continuing down.
• LIMITATIONS: I have not test this on Stock, as I have a different strategies for those market
• NOTES : I know a lot of people have moving averages on their chart, I have another separate one with all MA types, and it something that will not fit into one script, Other things you can add with this Bollinger bands, and
fib tool with 50%, 100%, 150% and 200%
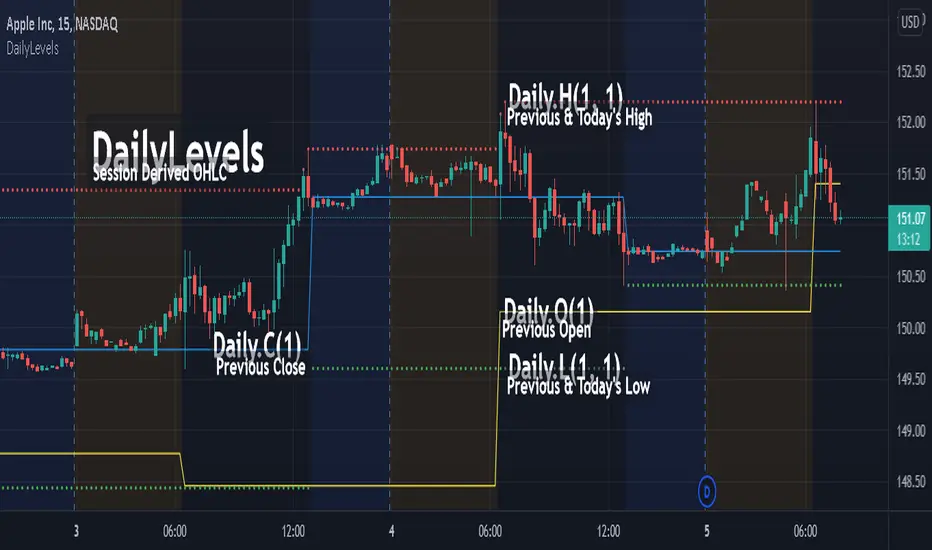
DailyLevelsLibrary "DailyLevels"
Functions for acquiring daily timeframe data by number of prior days.
openD(daysPrior, spec, res) Gets the open for the number of days prior.
Parameters:
daysPrior : Number of days back to get the open from.
spec : session.regular (default), session.extended or other time spec.
res : The resolution (default = '1440').
Returns: The open for the number of days prior.
highD(daysPrior, extraForward, spec, res) Gets the highest value for the number of days prior.
Parameters:
daysPrior : Number of days back to get the high from.
extraForward : Number of extra days forward to include.
spec : session.regular (default), session.extended or other time spec.
res : The resolution (default = '1440').
Returns: The high for the number of days prior.
lowD(daysPrior, extraForward, spec, res) Gets the lowest value for the number of days prior.
Parameters:
daysPrior : Number of days back to get the low from.
extraForward : Number of extra days forward to include.
spec : session.regular (default), session.extended or other time spec.
res : The resolution (default = '1440').
Returns: The low for the number of days prior.
closeD(daysPrior, spec, res) Gets the close for the number of days prior.
Parameters:
daysPrior : Number of days back to get the open from. 0 produces the current close
spec : session.regular (default), session.extended or other time spec.
res : The resolution (default = '1440').
Returns: The close for the number of days prior.
hlc3D(daysPrior, extraForward, spec, res) Gets the HLC3 value for the number of days prior.
Parameters:
daysPrior : Number of days back to get the HLC3 from.
extraForward : Number of extra days forward to include. Determines the closing value.
spec : session.regular (default), session.extended or other time spec.
res : The resolution (default = '1440').
Returns: The HLC3 for the number of days prior.
SessionInfoLibrary "SessionInfo"
Utility functions for session specific information like the bar index of the session.
inSession(spec) Returns true if the current bar is in the session specification.
Parameters:
spec : session.regular (default), session.extended or other time spec.
Returns: True if the current is in session; otherwise false.
minutesToLen(minutes, multiple) Converts the number of minutes to a length to be used with indicators.
Parameters:
minutes : The number of minutes.
multiple : The length multiplier.
Returns: math.ceil(minutes * multiple / timeframe.multiplier)
bar(spec, res) Returns the intraday bar index. May not always map directly to time as a bars can be skipped.
Parameters:
spec : session.regular (default), session.extended or other time spec.
res : The resolution (default = "1440").
Returns: The integer index of the bar of the session.
isFirstBar(spec, res) Returns true if the current bar is the first one of the session.
Parameters:
spec : session.regular (default), session.extended or other time spec.
res : The resolution (default = "1440").
Returns: True if the current bar is the first one of the session.
wasLastBar(spec, res) Returns Returns true if the previous bar was the last of the session.
Parameters:
spec : session.regular (default), session.extended or other time spec.
res : The resolution (default = "1440").
Returns: True if was the last bar of the session.
