EMA band 12/60/150/200EMA band consisting of 12/60/150/200
Specifically for Indian stock market, can be used for other trading scripts after testing.
Best use case : on Daily TF.
Bull run entry criteria, Not bear market or Bottom catching.
Buscar en scripts para "香港市場主線股票市值小於200億"

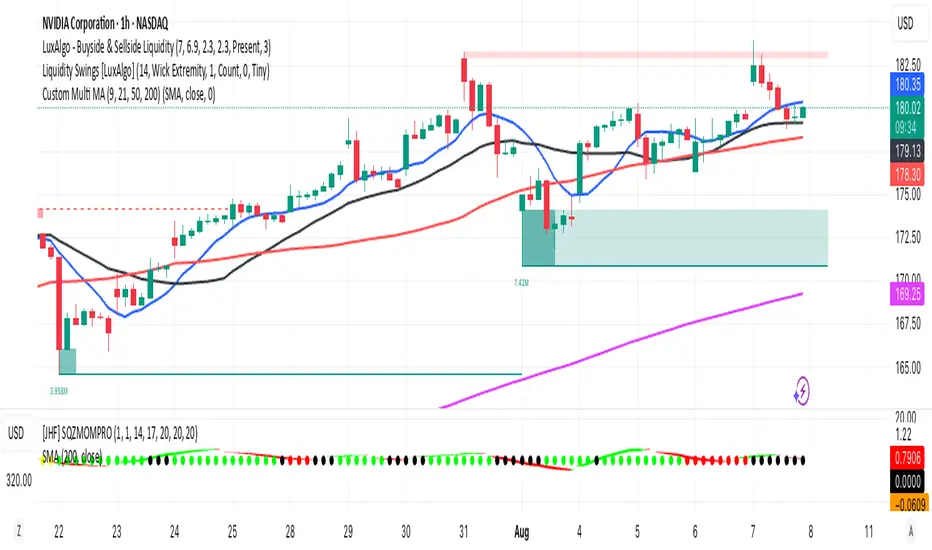
Multi MA (9, 21, 50, 200)This indicator plots four commonly used moving averages — 9, 21, 50, and 200 — with customizable smoothing methods and color-coded lines optimized for visibility on any chart background.
EMA 10/20/50/100/200plot 10, 20, 50,100,200 EMA on the chart. can be used to determine on any timeframe EMA
MTF 200MULTI TIME FRAME 200MA
TIMEFRAME
1m 5m 15m 30m 60m 240m 1D
200 SMA
Check the chart for 200ma you were looking at a candle at a certain time

TOMOs EMA (9, 20, 200) & VWAPThis indicator includes the 9, 20, 200 EMAs and VWAP all in one chart. best to be used on 1m, 5m, 1D timelines.

EMA 10,20 SMA 50, 200This indicator is very helpful for swing traders who plan their trades using EMAs and SMAs. It is used on the daily chart and displays the 10- and 20-EMA, as well as the 50- and 200-SMA.

EMA 20/50/200 - M3EDGE Clean Mode™The M3EDGE Clean Mode™ indicator is designed to spot the cleanest, most aligned market phases.
It filters out market noise and highlights only the high-probability trending zones where the odds are in your favor.
How it works:
• Tracks 3 key EMAs (20, 50, 200)
• Confirms directional alignment across short, medium, and long-term trends
• Colors optimal market phases to identify high-probability setups
• Optional display of the dynamic EMA50/EMA200 zone to visualize the trend’s core
Purpose:
🎯 Avoid choppy, sideways market conditions
🎯 Focus only on smooth, directional price moves
🎯 Reduce false signals and improve chart clarity
Best use cases:
• Ideal for scalping, day trading, and swing trading
• Works on all markets: indices, commodities, forex, crypto
• Perfect when combined with macro analysis and other M3EDGE™ setups
💡 Pro tip: The M3EDGE Clean Mode™ isn’t just another indicator — it’s a quality filter that keeps you out of messy conditions. When it lights up, you know the road ahead is clear.

Color Change EMA 200 (3 Min)- EMA 200 locked on 3 minute time frame
- Color changes red when bearish, and green when bullish.

Velez Price Action Signals (with 20 & 200 SMA)Velez Price Action Signals – With 20 & 200 SMA Overlay
This TradingView Pine Script is a clean and powerful reversal signal tool inspired by Oliver Velez’s price action philosophy, enhanced with trend context via two Simple Moving Averages.
🔍 Signal Logic
Buy Signal:
Current candle sweeps below the previous 5-bar low (liquidity grab).
Candle is bullish (close > open).
The lower wick is significantly larger than the body (e.g. ratio > 1.5).
Sell Signal:
Current candle sweeps above the previous 5-bar high.
Candle is bearish (close < open).
The upper wick is significantly larger than the body.
Signals appear as BUY/SELL labels on the chart (non-repainting).

Moyenne des EMA (5, 9, 20, 50, 100, 200)La moyenne des EMA 5,9,20,50,100,200 haut, bas, ouverture ou fermeture pour le calcul.

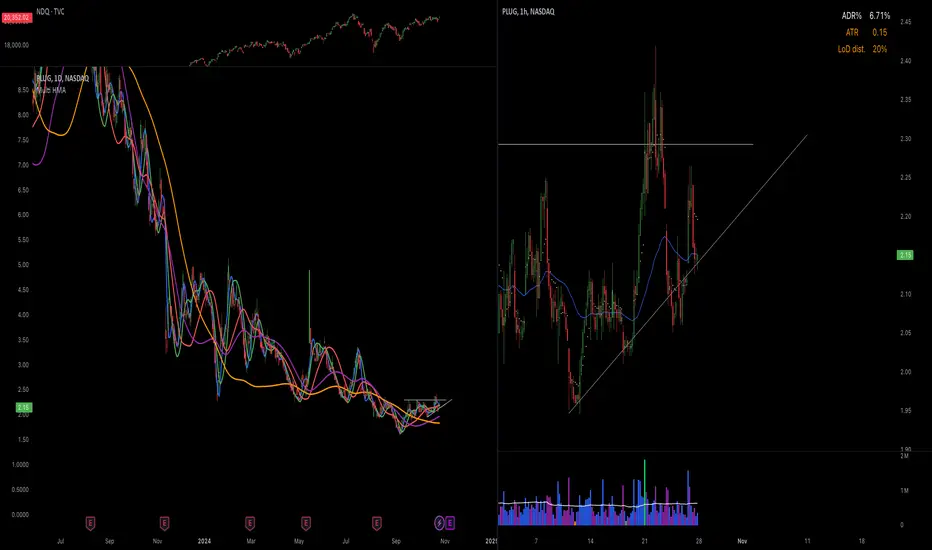
Hull Moving Averages 10, 20, 50, 100, 200This script generates multiple Hull Moving Averages (HMAs) on a trading chart, allowing for comprehensive trend analysis across different timeframes. Five HMAs with lengths of 10, 20, 50, 100, and 200 periods are plotted on the chart, providing insights into short, medium, and long-term market trends.
Each HMA can be customized with individual colors to easily distinguish between the different timeframes, helping traders visually track momentum changes and trend strength across these intervals. The Hull Moving Average is known for reducing lag compared to other moving averages, which makes it particularly useful for identifying turning points more accurately.
With this script:
You can adjust the colors of each HMA line individually, ensuring optimal visual differentiation.
You can analyze short-term trends with HMA 10 and HMA 20, medium-term trends with HMA 50, and long-term trends with HMA 100 and HMA 200.
The chart provides an at-a-glance view of multi-timeframe trends, making it useful for trading strategies that rely on crossovers or divergence patterns.
This tool is ideal for traders who want to identify trend direction, strength, and possible reversal points with minimal lag.
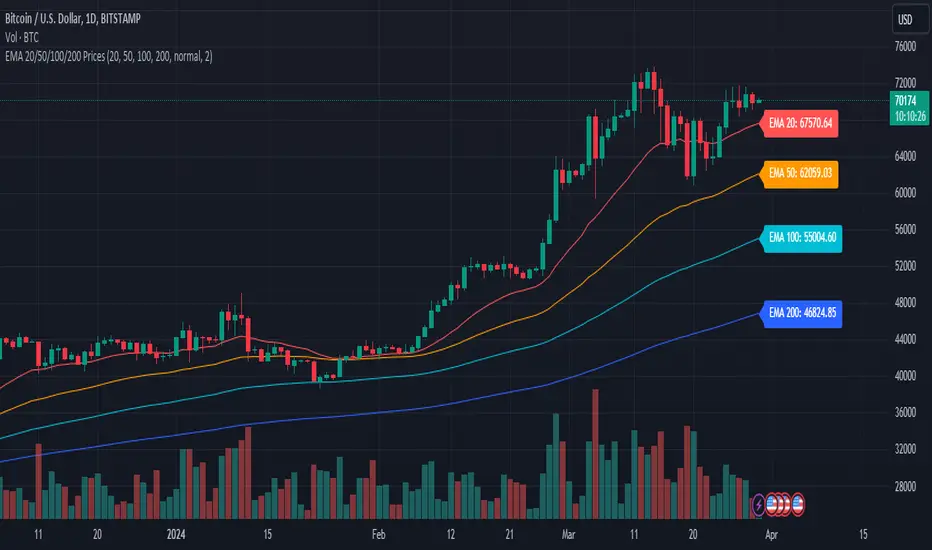
EMA 20/50/100/200 PricesDescription:
Introducing the EMA Indicator with Dynamic Labels, a unique addition to the TradingView Public Library. This innovative script enhances trend analysis and decision-making by overlaying four Exponential Moving Averages (EMAs) – 20, 50, 100, and 200 periods – on your chart, each with a distinct color for quick identification.
What sets this script apart?
Unlike standard EMA indicators, this script includes dynamic labels that display the current price level of each EMA at the latest price bar. This feature provides an instant snapshot of market sentiment, offering insights into potential dynamic support or resistance levels.
Key Features:
Customizable EMA Periods: Tailor the EMA periods according to your trading strategy, allowing for flexibility across different timeframes and assets.
Adaptive Label Sizes: A unique function adjusts label sizes based on user input, ensuring optimal readability across various display settings.
Color-Coded EMAs: Quickly differentiate between the EMAs with pre-defined colors, enhancing visual clarity and trend recognition.
How to Use:
Trend Analysis: Use the EMAs to identify the overall market trend. When shorter EMAs are above longer ones, it suggests a bullish trend, and vice versa.
Trade Entries and Exits: Look for crossovers of the EMAs as potential entry or exit signals. Dynamic labels will help you pinpoint the exact levels.
Customization: Adjust the EMA periods and label sizes under the indicator settings to match your trading style and preferences.
Underlying Concepts:
This script utilizes the classic EMA calculation but innovates by integrating dynamic, real-time labels and customizable periods. The choice of four different periods allows for a nuanced analysis of trend strength and direction, catering to both short-term traders and long-term investors.
Originality and Contribution:
The "Advanced EMA Indicator with Dynamic Labels" is original in its approach to providing real-time, actionable data through dynamic labels. It caters to the community's need for more interactive and informative indicators that go beyond basic trend analysis.
Conclusion:
Whether you're a novice trader seeking to understand market trends or an experienced investor looking for nuanced analysis tools, this script offers valuable insights and flexibility. It stands as a testament to the power of Pine Script in creating practical, user-centric trading tools.
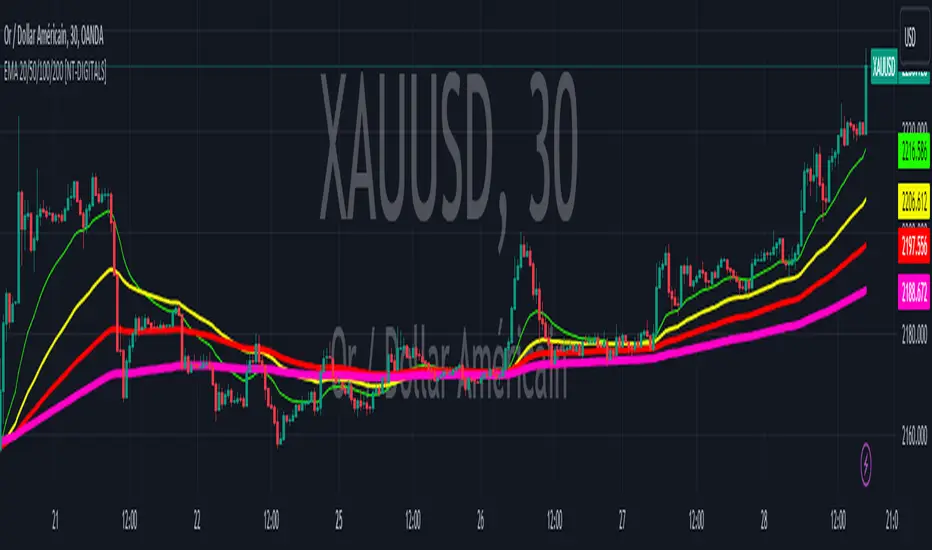
EMA 20/50/100/200 [NT-DIGITALS]This script plots Exponential Moving Averages (EMA) of 20, 50, 100, and 200 periods on the chart. EMAs are commonly used by traders to identify trends and potential reversal points in the market. The EMA smooths out price data to create a single line that follows the overall trend more closely than a simple moving average. By plotting multiple EMAs of different periods, traders can observe the interaction between short-term and long-term trends, aiding in decision-making for entry and exit points.
Exponential Moving Average (EMA) is a type of moving average that gives more weight to recent price data, making it more responsive to current price movements compared to a simple moving average (SMA). The EMA is calculated by applying a smoothing factor to the previous EMA value and adding a fraction of the difference between the current price and the previous EMA value. This weighting mechanism results in EMAs reacting more quickly to price changes, making them popular for traders looking to capture short-term trends in the market.
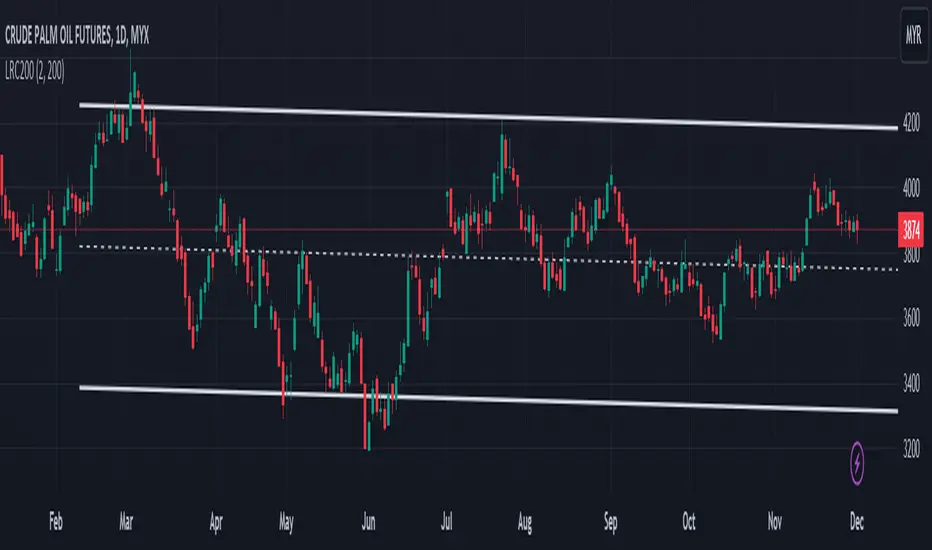
Linear Regression Channel 200█ OVERVIEW
This a simplified version of linear regression channel which use length 200 instead of traditional length 100.
█ FEATURES
Color change depends light / dark mode.
█ LIMITATIONS
Limited to source of closing price and max bars back is 1500.
█ SIMILAR
Regression Channel Alternative MTF
Regression Channel Alternative MTF V2
Conceptive Price Moving Average [CSM]The Conceptive Price Moving Average (CPMA) is a technical indicator designed to provide a more accurate moving average of the price by using the average of various price types, such as open, close, high, low, etc. The CPMA can help to smooth out the noise and provide a clearer picture of the overall trend by taking the average of the last 3 candles for each price type and then calculating the average of those averages.
To use the CPMA for generating buy/sell signals, you can look for crossovers of the CPMA and other commonly used moving averages, such as the 9-period EMA, 20-period EMA, 50-period EMA, 100-period EMA, and 200-period EMA, which are also plotted on the chart. When the CPMA crosses above a shorter-term moving average, such as the 9-period EMA or 20-period EMA, it can indicate a potential buy opportunity, while when the CPMA crosses below a shorter-term moving average, it can indicate a potential sell opportunity.
Based on my analysis of BankNifty and Nifty, I have found that the CPMA works best at a length of 21, showing good resistance and support for stocks. Therefore, I recommend using a length of 21 when using the CPMA for generating buy/sell signals.

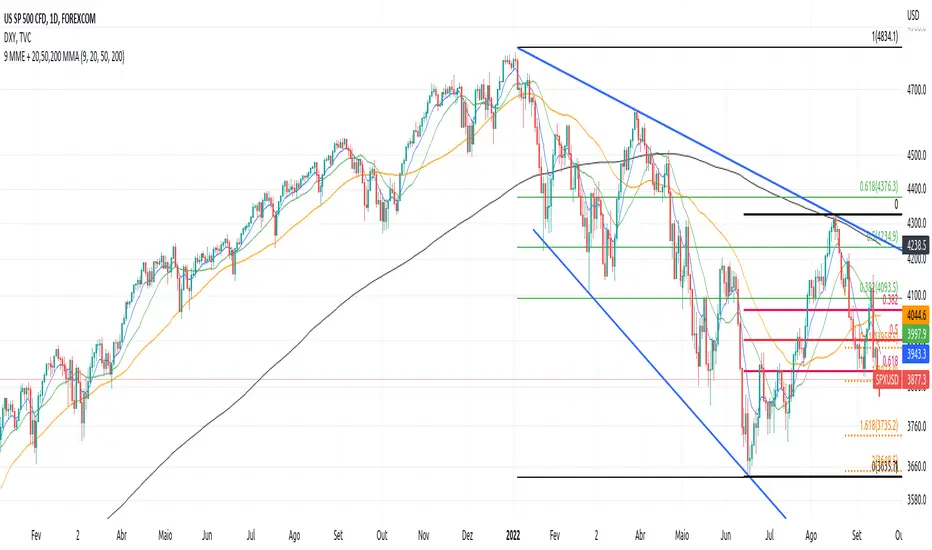
LuizinTradezone - 9 MME + 20,50,200 MMAScript que inclui a média móvel de 9 (exponencial), e as médias aritméticas de 20, 50 e 200
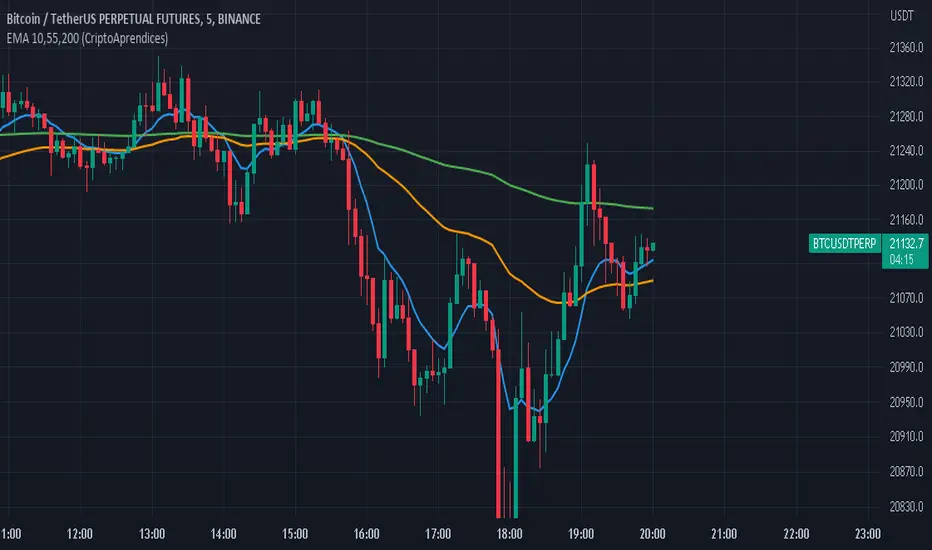
EMA 10,55,200 (CriptoAprendices) CriptoAprendices
Media Móvil Exponencial (EMA'S )de 10,55 Y 200 en Un Solo Indicador
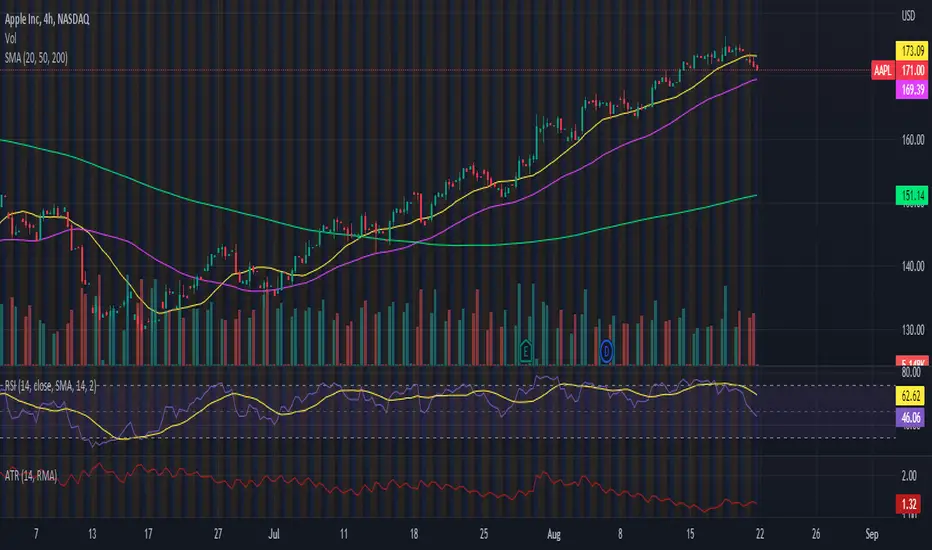
Simple and Exponential Moving Averages (20, 50, 200)Displays the 20, 50, and 200 simple and exponential moving averages in 1 indicator.
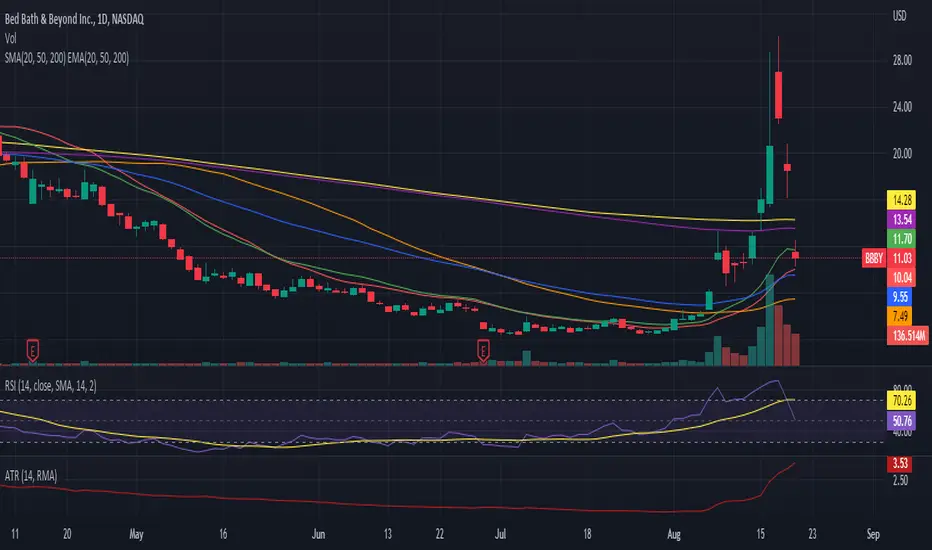
Simple Moving Averages (20, 50, 200)Allows you to plot 20 day, 50 day, and 200 day simple moving averages using only 1 indicator.
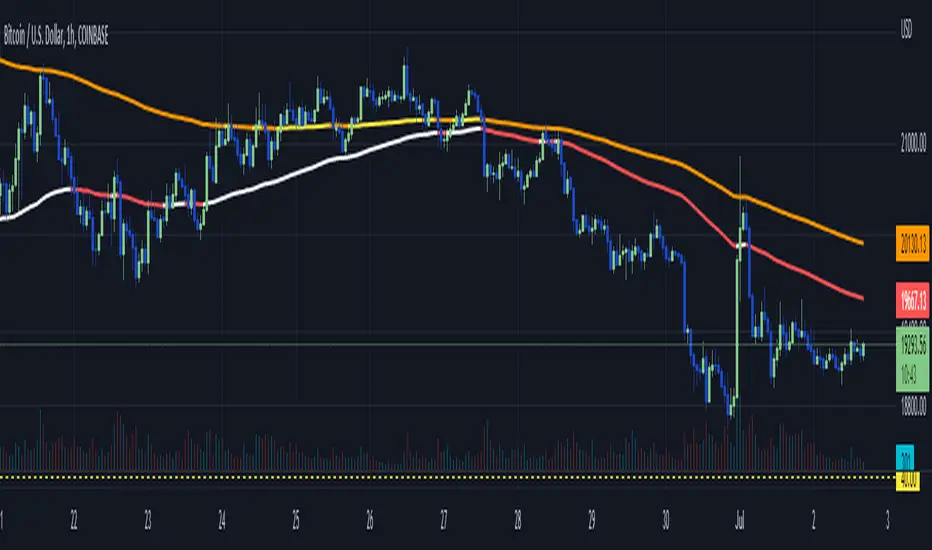
WhiteFang 100 / 200 EMA ColorFlipThis script combines the 100 and 200 EMA and exhibits colour changes ("colour flip") at price action crosses.
The intention here is to create an "at a glance trend indicator" to allow quick and accurate stock, forex and crypto screening prior to selecting targets for entry.
For example I find it prudent to select long when the PA is above both the White (100EMA) and Yellow (200EMA) - conversely selecting short when below Red (100EMA) and Orange (200EAM).
Other attributes:
- Multi timeframe compatible
- Easily to spot:
- golden cross = (white crossing over yellow), and
- Death cross ( red crossing below orange)
EMA20-50-200Display EMA 20, 50 and 200 in a single indicator
You can choose colors and modify the EMA input value
Distance to 200 SMAThis indicator shows the relative distance (in %) from the closing price to the 200 SMA.
