VWAP + Volume Spikes See Where Smart Money ExhaustsVolume tells the truth. VWAP tells the bias. This script shows both — live.
If you trade intraday momentum, reversals, or liquidity sweeps, this indicator is built for you.
It shows where volume spikes hit extreme levels, anchored around VWAP and its dynamic bands, so you can instantly spot capitulation or hidden absorption.
🎯 What This Indicator Does
✅ Plots VWAP — session-anchored, updates automatically
✅ Adds dynamic VWAP bands — standard deviation envelopes showing volatility context
✅ Highlights volume spikes — colored candles + background for abnormal prints
✅ Includes alerts — “Volume Spike”, “VWAP Cross”, or a combined alert with direction
✅ Clean visual design — instantly readable in fast markets
It’s your visual orderflow radar — whether you’re trading gold, indices, or small caps.
🔍 Why It Works
Institutions build and unwind positions around VWAP.
Retail often chases volume… this script shows you when that volume becomes too extreme.
A spike above VWAP near resistance? → Likely distribution.
A spike below VWAP near support? → Likely capitulation.
Combine volume exhaustion + VWAP context, and you’ll see market turning points form before most indicators react.
⚙️ Inputs You Can Tune
Bands lookback: adjusts how reactive the VWAP bands are
Band width (σ): set how tight or wide your deviation envelope is
Volume baseline length: controls how “abnormal” a spike must be
Spike threshold: multiplier vs. average volume
Toggle color-coding, bands, and labels
Default settings work well across 1m–15m intraday charts and 1h–4h swing frames.
💡 How Traders Use It
1️⃣ Fade Parabolics:
When a green spike candle pierces upper VWAP band on high volume → smart money unloading.
Look for rejection and short into VWAP.
2️⃣ Catch Capitulations:
When a red spike candle dumps below lower VWAP band → panic selling.
Watch for stabilization and long back to VWAP.
3️⃣ VWAP Rotation Plays:
Alerts for price crossing VWAP help you spot shift in intraday control.
Above VWAP = buyers in charge.
Below VWAP = sellers in charge.
🧠 Best Practices
Pair it with Volume Profile or Delta/Flow tools to confirm exhaustion.
Don’t chase — wait for spike confirmation + reversal candle.
Use it on liquid tickers (NASDAQ, SPY, GOLD, BTC, etc.).
Great for Dux-style small-cap shorts or index pullbacks.
🔔 Alerts Ready
Choose from:
Volume Spike (single-bar explosion)
VWAP Cross Up/Down (trend shift confirmation)
One Combined Alert (any signal, includes ticker, price, and volume)
Set once — get real-time push notifications, Telegram, or webhook signals.
📊 My Favorite Setups
US100 / NASDAQ: fade rallies above VWAP + spike
Gold / Silver: trade reversals from VWAP bands
Small caps: short back-side after volume climax
ES, DAX, Oil: scalp VWAP rotation with confluence
❤️ Support This Work
I release free and premium scripts weekly — combining smart money concepts, VWAP tools, and volume analytics.
👉 Follow me on TradingView for more indicators and setups.
👉 Comment “🔥” if you want me to post the multi-timeframe VWAP + Volume Pressure version next.
👉 Share this with your team — it helps the community grow.
Buscar en scripts para "纳斯达克期货cfd"

3TF Supertrend Resonance— 4H/1H/15m+ 3TP/SLMTF Supertrend — 4H / 1H / 15m Confluence + Dynamic TP/SL + Adaptive Trend/Range Filters
This script is a multi-timeframe Supertrend confluence system designed for traders who operate on lower timeframes (15m / 1m) but want higher-timeframe structure, trend confirmation, and dynamic TP/SL projections.
It combines 4H + 1H + 15m Supertrend, trend alignment detection, range filtering, and auto-projected risk-based targets, providing a complete directional framework for both scalping and intraday swing entries.
👉1. Multi-Timeframe Supertrend Framework (4H / 1H / 15m)
The script calculates Supertrend levels and direction on three major timeframes:
-4H Supertrend
-1H Supertrend
-15m Supertrend
Users can choose between:
-Confirmed HTF values (no repaint)
-Live HTF values (more sensitive but may repaint)
Each Supertrend level is plotted on the current chart as a horizontal line, extended far to the left and slightly to the right, with optional lightweight labels showing direction and price.
These levels function as HTF dynamic support/resistance during intraday trading.
👉2. Confluence Detection (4H = 1H = 15m)
A trend confluence occurs when:
-4H direction = 1H direction = 15m direction
When the three timeframes align:
A full-height vertical line marks the first candle of confluence (color-coded bullish/bearish).
An alert is triggered:
“Triple-TF Trend Confluence — First Candle”
This identifies the earliest moment when the market shifts into unified directional behavior.
👉3. Trend Background Coloring (15m + 1m)
When confluence is active:
-Bullish confluence → Green background
-Bearish confluence → Red background
Background visualization is applied on:
-15m timeframe (main directional chart)
-1m timeframe (scalping entries with HTF alignment)
This ensures lower-timeframe decisions always stay aligned with higher-timeframe direction.
👉4. Weak-Trend / Range Detection (Only on 15m)
Even if all three timeframes are aligned, momentum may be weak.
Range/weak-trend detection activates when:
-Confluence = true
-AND (ADX < threshold OR Choppiness > threshold)
On 15m charts:
A grey overlay appears, covering green/red confluence colors.
First candle entering range shows a vertical grey mark (optional).
Alert:
“Confluence but Weak Momentum — First Candle”
This identifies moments where the market is aligned but lacking trend strength — a “trend that doesn’t move.”
👉5. Dynamic TP/SL Projection (1.5R / 3R / 4.5R)
Using the current timeframe’s Supertrend as a structural stop-loss:
SL = current Supertrend line
Risk = | Close - SL |
The script auto-calculates:
TP1 = 1.5 × risk
TP2 = 3.0 × risk
TP3 = 4.5 × risk
All projected upward for bullish trends and downward for bearish trends.
Displayed visually:
Dotted short-range lines for SL, TP1, TP2, TP3
Lightweight left-side labels showing:
SL price + distance
Individual TP prices
This provides an immediate R-multiple framework for trade planning.
👉6. 15m Supertrend Flip Indicator (Minimalistic)
When the 15m Supertrend changes direction:
A tiny circle marker is plotted:
-Bullish flip → below the bar, green
-Bearish flip → above the bar, red
Alerts:
“15m ST Flip Up (Bear → Bull)”
“15m ST Flip Down (Bull → Bear)”
This highlights early shifts in short-term structure before confluence or major trend changes occur.
👉7. Alerts Included
The script provides alerts for:
-Triple-TF Trend Confluence — First Candle
-Weak Trend / Range Start
-15m Supertrend Flip Up
-15m Supertrend Flip Down
These are practical for automated notifications when key structural conditions appear.
Summary
This script provides:
✅ Higher-Timeframe Context
4H, 1H, and 15m Supertrend levels + direction.
✅ Directional Certainty
Triple-timeframe confluence with visual + alert confirmation.
✅ Smart Background Guidance
Color-coded trend zones for 15m & 1m.
✅ Range / Weak Trend Filtering
Avoid false trends using ADX + Choppiness.
✅ Actionable TP/SL Framework
Auto-projected 1.5R / 3R / 4.5R + SL lines based on Supertrend structure.
✅ Precise Intraday Signals
15m Supertrend flips marked with minimalistic dots.


Pivot Points High Low & Missed Reversal Levels + Alertsmake alert if there come a new high and low, best in 15 min and pivot go from 50 to 15

Asia & UK Sessions H/LThis will show you the Highs and Lows of the Asia and UK sessions on the same day.

Liquidity Hunter Pro v11.9 — TQI EditionLiquidity Hunter Pro v12 is built for intraday traders who want structure, clarity, and precision without unnecessary clutter. The tool blends market structure, momentum, trend alignment, volatility regime analysis, and liquidity mapping into a single unified model.
This version focuses on three core goals:
1. Identify only high-quality, directional market conditions.
The engine filters through HTF bias, short-term structure shifts, RSI momentum, and volatility compression/expansion. The idea is simple: wait for the market to become clean, aligned, and directional before considering an entry.
2. Map liquidity and detect sweeps in real time.
Major highs and lows are tracked using extended pivots, and the system highlights key areas where stop hunts or sweeps may occur. Sweeps and pressure zones are evaluated and factored directly into the quality score.
3. Grade every potential setup with a single, objective metric (TQI).
The Trade Quality Index (0–5⭐) compresses all signals into one reading so the trader can quickly judge whether a setup has enough quality to act on.
The script includes:
• Trend + Momentum + Structure detection
• HTF bias (optional)
• Volatility regime analysis
• Liquidity sweeps + pressure zones
• Micro-confirmation engine
• PQI (0–100%)
• TQI (0–5⭐)
• Clean HUD and Driver’s Guide
• Auto-cleaning labels and signal management
• Optional session filtering (London/NY)
This tool is designed for traders who value confirmation over noise.
It will not fire constantly.
It will wait patiently for clean, directional, aligned markets — and only then issue a signal.
How to Use Liquidity Hunter Pro v12
1. Check the HUD (top-right by default)
The HUD is your dashboard. Before doing anything:
A. HTF Bias
This is your map. Only trade in the direction of the bias.
B. Trend / Momentum / Structure
These should ideally all match the direction of the bias.
If they don’t line up → wait. No alignment = low probability.
C. Liquidity + Volatility Regime
“Sweep ↑→↓” or “Sweep ↓→↑” = potential reversal points
“Expansion” = clean conditions
“Compression” = choppy, avoid
You don’t need to overthink any of this — just think:
“Are the ingredients lined up?”
2. Wait for a valid signal
The indicator will only trigger a BUY or SELL when:
✓ HTF bias aligns
✓ Trend & momentum align
✓ Structure supports the move
✓ Micro-confirmation kicks in
✓ PQI ≥ 75
✓ Sessions are open (optional)
Signals are rare on purpose.
When one prints, you know the market conditions are stacked.
3. Read the label
Each signal prints a small block next to the candle containing:
• Entry price
• SL (based on structure)
• TP(2R) suggestion
• Liquidity context (e.g., sweep or pressure)
• Volatility regime
• TQI ⭐ rating (0–5)
This helps you judge the setup instantly.
A simple rule for beginners:
Trade only if TQI ≥ ⭐⭐⭐
Lower than that = more noise, less edge.
4. Use the liquidity zones
The script plots subtle boxes at recent liquidity highs/lows.
These mark:
• Where the market may hunt stops
• Where reversals often start
• Where signals are more meaningful
When a signal happens near liquidity → higher quality.
5. Follow the session filter (optional but recommended)
By default the tool focuses on:
• London session
• New York session
That removes 70% of low-volatility garbage.
You can turn this off if you trade crypto or indices overnight, but beginners usually benefit from keeping it on.
Recommended Settings
These are the settings used by most testers and early users.
Everything is configurable, but start with this:
Core Settings
• Fast EMA: 21
• Slow EMA: 55
• RSI Length: 14
• Pivot Lookback: 2
These settings create balanced structure detection and smooth trend signals.
HTF Bias
• Use HTF Bias: ON
• HTF Timeframe: 240 (H4)
H4 bias keeps you out of counter-trend traps.
Sessions
• Use London/NY Filter: ON
• London: 08:00–17:00
• New York: 13:30–21:00
Perfect for FX, indices, and metals.
Crypto traders: turn sessions OFF.
HUD + Guide
• HUD: ON
• Guide: ON
• Linger Bars: 12
This keeps things readable and prevents clutter.
Trading Tips for Beginners
These help keep you out of trouble:
1. Don’t fade the bias.
If HTF says bearish → avoid buys.
2. Don’t trade in compression regimes.
It saves you from chop.
3. Don’t chase signals that fire far from structure.
If the signal candle is huge, let it go.
4. Don’t trade without at least ⭐⭐⭐.
You’ll thank yourself later.
Final Thoughts
Liquidity Hunter Pro v12 isn’t meant to spam signals.
It’s meant to filter hard, highlight clean conditions, and help new traders avoid the traps the market throws every day.
Treat it as a trading assistant that tells you:
“The environment is right. Now you decide.”

VWAP D/W/M + MA100 & EMA100 albanThis TradingView indicator displays three independent VWAPs (Volume Weighted Average Prices) along with MA100 (Simple Moving Average) and EMA100 (Exponential Moving Average) on the chart.
Key Features:
VWAP #1, VWAP #2, VWAP #3: Each VWAP can be configured independently with:
Source (hlc3, close, etc.)
Anchor period (Session, Week, Month, Quarter, Year, Decade, Century, Earnings, Dividends, Splits)
Offset
Option to hide on daily or higher timeframes
MA100: 100-period Simple Moving Average
EMA100: 100-period Exponential Moving Average
Purpose:
This script is ideal for traders who want to track multiple VWAP levels simultaneously while also monitoring the 100-period moving averages for trend analysis. It provides a clean setup without bands or fills, focusing solely on price averages.
Use Cases:
Identify intraday or multi-timeframe VWAP levels
Combine VWAP levels with MA100/EMA100 for support/resistance analysis
Analyze trend direction and momentum using moving averages

PLANBXPRESS PSYCHOLOGICAL LEVEL ENTRY MODELThis Indicator merges multiple professional trading concepts into one visual tool — helping traders identify momentum shifts, entry zones, and daily trading plans with volume confirmation.
It automatically detects trend direction, generates dynamic take-profit & stop-loss levels, and overlays key daily reference points such as VWAP, pivot, support, and resistance zones based on ATR and trend context.
⚙️ Main Components
1️⃣ Signal System
Detects trend bias using SMA-based logic.
Generates entry price, TP1–TP3, and SL dynamically from recent impulse ranges.
Updates signals automatically when trend bias changes or previous targets are hit.
Visual levels are drawn directly on the chart.
2️⃣ Volume Analysis
Compares current volume against a moving average (SMA).
Classifies volume as:
🟢 Strong (above 1.5× average)
🟡 Average
🔴 Weak (below 0.8× average)
Displays the current volume strength and trend bias in an on-chart table.
3️⃣ Auto Day Plan
Uses multi-timeframe ATR calculations to define:
Support / Resistance zones
Pivot & Balance areas
Daily VWAP
Auto Targets (ATR-based expansion levels)
Adapts automatically to selected base timeframe (1H, 4H, or Daily).
4️⃣ Trend Context
Dual EMA system (50 & 200) to confirm bullish/bearish structure.
Aligns expected direction with VWAP & pivot location for context-aware bias.
🎯 What You Get on Chart
📈 Automatic LONG/SHORT signals
🎯 TP1, TP2, TP3, and SL levels
📊 Volume strength meter
🧭 VWAP, pivot, support/resistance & balance zones
🎨 Clean visual layout for intraday and swing traders
🧩 Inputs
Parameter Description
lenImpulse Impulse range length
smaLen SMA length for trend bias
levelRatio SL/TP ratio multiplier
volLen Volume SMA length
baseTF Base timeframe for zones/VWAP
atrMult1 / atrMult2 ATR multipliers for target levels
fwdBars Extension range for future projection
💡 How to Use
Add the script to your chart and choose your preferred timeframe.
Observe signal direction (📈 LONG / 📉 SHORT) and TP/SL levels.
Confirm entries when:
Trend aligns with VWAP direction, and
Volume category shows Strong or Average.
Use Auto Day Plan levels (pivot, balance, VWAP) as intraday reaction zones.

PLANBXPRESS ENTRYThe Combined Signal + Auto Day Plan + Volume indicator merges multiple professional trading concepts into one visual tool — helping traders identify momentum shifts, entry zones, and daily trading plans with volume confirmation.
It automatically detects trend direction, generates dynamic take-profit & stop-loss levels, and overlays key daily reference points such as VWAP, pivot, support, and resistance zones based on ATR and trend context.
⚙️ Main Components
1️⃣ Signal System
Detects trend bias using SMA-based logic.
Generates entry price, TP1–TP3, and SL dynamically from recent impulse ranges.
Updates signals automatically when trend bias changes or previous targets are hit.
Visual levels are drawn directly on the chart.
2️⃣ Volume Analysis
Compares current volume against a moving average (SMA).
Classifies volume as:
🟢 Strong (above 1.5× average)
🟡 Average
🔴 Weak (below 0.8× average)
Displays the current volume strength and trend bias in an on-chart table.
3️⃣ Auto Day Plan
Uses multi-timeframe ATR calculations to define:
Support / Resistance zones
Pivot & Balance areas
Daily VWAP
Auto Targets (ATR-based expansion levels)
Adapts automatically to selected base timeframe (1H, 4H, or Daily).
4️⃣ Trend Context
Dual EMA system (50 & 200) to confirm bullish/bearish structure.
Aligns expected direction with VWAP & pivot location for context-aware bias.
🎯 What You Get on Chart
📈 Automatic LONG/SHORT signals
🎯 TP1, TP2, TP3, and SL levels
📊 Volume strength meter
🧭 VWAP, pivot, support/resistance & balance zones
🎨 Clean visual layout for intraday and swing traders
🧩 Inputs
Parameter Description
lenImpulse Impulse range length
smaLen SMA length for trend bias
levelRatio SL/TP ratio multiplier
volLen Volume SMA length
baseTF Base timeframe for zones/VWAP
atrMult1 / atrMult2 ATR multipliers for target levels
fwdBars Extension range for future projection
💡 How to Use
Add the script to your chart and choose your preferred timeframe.
Observe signal direction (📈 LONG / 📉 SHORT) and TP/SL levels.
Confirm entries when:
Trend aligns with VWAP direction, and
Volume category shows Strong or Average.
Use Auto Day Plan levels (pivot, balance, VWAP) as intraday reaction zones.

Macro Flow Assistant — Full Clean Levels public versionpublic easy macro flow tracker.
important levels only marked.
trend bias.


Presidential ScannerThe Presidential Scanner is an advanced analysis tool that combines state-of-the-art algorithmic calculations with the processing of economic and macroeconomic data in real time.
Thanks to its intelligent technology, it detects high-potential market revenue, offering clear, profitable and highly operationally effective signals.

CyberFX Round NumbersThis is a traditional Round Numbers indicators. As all know RND # are psychological levels that represents Support and Resistance. Of course they are not exact science but in general they can give us a possible level where maybe the price move will be rejected.
One other thing I have been using in my strategy is no matter what the time frame I am trading I always check the Daily trend. We know that the banks and financial institutions are always looking for the high TFs trend for long investments so, on my understand, the Daily trend will affect the lower TFs in one way or other so I decided to add this option into this indicator.
Also to avoid an over crowed chart with many lines around I added the option to Show/Hide the RND# so during the analysis I can check the RND# levels.
The Daily Trend is based on a SMA(200).

Institucional Force IndexThe indicator shows the true strength of the movements, thus allowing one to assess whether price increases or decreases are genuine or false.

RSI (Custom Background) KDMThis code is a custom version of the RSI (Relative Strength Index) indicator.
Its main purpose is to compare recent price gains and losses to determine whether the market is in an overbought or oversold condition.
30–50 zone (purple tone): represents a weak or pullback area.
50–70 zone (green tone): represents a strengthening or dominant buying area.
Additionally, when the RSI line moves above 70, a green gradient background highlights the overbought region; when it moves below 30, a red gradient background emphasizes the oversold region.
Like the classic RSI, this version is a momentum indicator showing whether the price is losing or gaining strength.
The key difference is the colored background, which allows you to visually identify the RSI zones (e.g., 30–50 weak, 50–70 strong) much faster and more clearly.

GEX / Gamma - SPX Indicator Description – GEX / Gamma (SPX)
This indicator allows you to manually plot your daily +GEX, TRANS-GEX, and –GEX levels on SPX and visualize how price reacts around key gamma zones.
You enter the three levels each morning, and the script automatically draws:
+GEX / TRANS / –GEX zones with an adjustable buffer
Clean labels (e.g., “+GEX: 6850”) pinned to the right side of the chart
Today-only candle coloring (green above TRANS-GEX, red below)
Zones extend from yesterday’s session through the current session, helping highlight areas where dealer hedging flows may influence volatility, compression, or acceleration.
How to Use
Add the indicator to any intraday SPX chart.
Open settings and enter your +GEX, TRANS-GEX, and –GEX levels for the day.
Adjust the buffer, colors, and label style as needed.
Watch how price behaves as it moves above or below TRANS-GEX and interacts with +/- GEX zones.
Best For
Intraday SPX / ES / SPY
Options traders
Volatility and gamma-aware strategies
Strategy Behind It (Tight Version)
GEX levels help identify where dealer hedging flows can influence SPX price behavior.
+GEX (Positive Gamma)
Market tends to stabilize here. Dealers hedge against price moves, creating mean-reversion and lower volatility.
TRANS-GEX (Transition Level)
Key pivot where gamma flips. Price crossing this level often signals a shift in volatility or intraday direction.
–GEX (Negative Gamma)
Market becomes more reactive. Dealers hedge with price, increasing volatility, momentum, and trend potential.
How traders use it:
Expect resistance or slowdown into +GEX
Watch for potential bottoming or increased volatility –GEX
Use TRANS-GEX as a bias line or trigger for intraday shifts
A move outside of either the +GEX or -GEX will likely result in some type of high volume move.

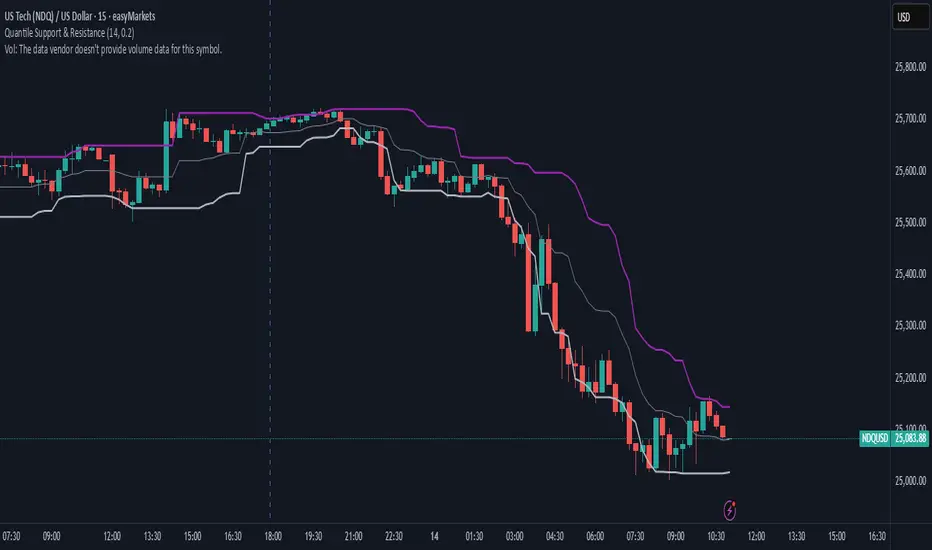
Quantile Support & ResistanceThis indicator plots dynamic support and resistance zones based on quantile logic — a statistically grounded method for identifying structural price boundaries.
Support Level: The price below which only a small percentage of lows fall (default: 10%). This approximates a strong demand zone.
Resistance Level: The price above which only a small percentage of highs rise (default: 10%). This approximates a strong supply zone.
Volatility-Adaptive: Levels adjust automatically to changing market conditions using a configurable lookback window.
Quantile Interpolation: Uses sorted price data and fractional indexing to estimate percentile thresholds with precision.
This tool is ideal for traders who want to visualize statistically significant price zones without relying on subjective drawing or fixed levels. It pairs well with breakout strategies, retest logic, and compression overlays.
Market Structure Volume Time Velocity ProfileThis is the Market Structure Volume Time Velocity Profile (MSVTVP). It combines event-based profiling with advanced metrics like Time and Velocity (Flow Rate). Instead of fixed time periods, profiles are anchored to critical market events (Swings, Structure Breaks, Delta Breaks), giving you a precise view of value development during specific market phases.
## The 3 Dimensions of the Market
Unlike standard tools that only show Volume, MSVTVP allows you
to switch between three critical metrics:
1. **VOLUME Profile (The "Where"):**
* Shows standard acceptance. High volume nodes (HVN)
are magnets for price.
2. **TIME Profile (The "How Long"):**
* Similar to TPO, it measures how long price spent at each
level.
* **High Time:** True acceptance and fair value.
* **Low Time:** Rejection or rapid movement.
3. **VELOCITY Profile (The "How Fast"):**
* Measures the **speed of trading** (Contracts per Second).
This reveals the hidden intent of market participants.
* **High Velocity (Fast Flow):** Aggression. Initiative
buyers/sellers are hitting market orders rapidly. Often
seen at breakouts or in liquidity vacu.
* **Low Velocity (Slow Flow):** Absorption. Massive passive
limit orders are slowing price down despite high volume.
Often seen at major reversals ("hitting a brick wall").
Key Features:
1. **Event-Based Profile Anchoring:** The indicator starts a new
profile based on one of three user-selected events
('Profile Anchor'):
- **Swing:** A new profile begins when the 'impulse baseline'
(derived from intra-bar delta) changes. This baseline
adjusts when a new **price pivot** is confirmed: When a
price **high** forms, the baseline moves to the **lower**
of its previous level or the peak delta (max of
delta O/C) at the pivot. When a price **low** forms, it
moves to the **higher** of its previous level or the
trough delta (min of delta O/C) at the pivot.
- **Structure:** A new profile begins immediately on the bar
that *confirms* a market structure break (e.g., a new HH
or LL, based on a sequence of price pivots).
- **Delta:** A new profile begins immediately on the bar
that *confirms* a break in the *cumulative delta's*
market structure (e.g., a new HH or LL in the delta).
Both 'Swing' and 'Delta' anchors are derived from the same
**continuous (non-resetting) Cumulative Volume Profile Delta (CVPD)**,
which is built from the intra-bar statistical analysis.
2. **Statistical Profile Engine:** For each bar in the anchored
period, the indicator builds a volume profile on a lower
'Intra-Bar Timeframe'. Instead of simple tick counting, it
uses advanced statistical models:
- **Allocation ('Allot model'):** 'PDF' (Probability Density
Function) distributes volume proportionally across the
bar's range based on an assumed statistical model
(e.g., T4-Skew). 'Classic' assigns all volume to
the close.
- **Buy/Sell Split ('Volume Estimator'):** 'Dynamic'
applies a model that analyzes candle wicks and
recent trend to estimate buy/sell pressure. 'Classic'
classifies all volume based on the candle color.
3. **Visualization & Lag:** The indicator plots the final
profile (as a polygon) and the developing statistical
lines (POC, VA, VWAP, StdDev).
- **Note on Lag:** All anchor events require `Pivot Right Bars`
for confirmation.
- In 'Structure' and 'Delta' mode, the developing lines
(POC, VA, etc.) are plotted using a **non-repainting**
method (showing the value from `pivRi` bars ago).
- In 'Swing' mode, the profile is plotted **retroactively**,
starting *from the bar where the pivot occurred*. The
developing lines are also plotted with this full
`pivRi` lag to align with the past data.
4. **Flexible Display Modes:** The finalized profile can be displayed
in three ways: 'Up/Down' (buy vs. sell), 'Total' (combined
volume), and 'Delta' (net difference).
5. **Dynamic Row Sizing:** Includes an option ('Rows per Percent')
to automatically adjust the number of profile rows (buckets)
based on the profile's price range.
6. **Integrated Alerts:** Includes 13 alerts that trigger for:
- A new profile reset ('Profile was resetted').
- Price crossing any of the 6 developing levels (POC,
VA High/Low, VWAP, StdDev High/Low).
- **Alert Lag Assumption:** In 'Swing' mode, alerts are
delayed to match the retroactively plotted lines.
In 'Structure' and 'Delta' modes, alerts fire in
**real-time** based on the *current price* crossing
the *current (repainting)* value of the metric, which
may **differ from the non-repainting plotted line.**
**Caution: Real-Time Data Behavior (Intra-Bar Repainting)**
This indicator uses high-resolution intra-bar data. As a result, the
values on the **current, unclosed bar** (the real-time bar) will
update dynamically as new intra-bar data arrives. This includes
the values used for real-time alerts in 'Structure' and
'Delta' modes.
---
**DISCLAIMER**
1. **For Informational/Educational Use Only:** This indicator is
provided for informational and educational purposes only. It does
not constitute financial, investment, or trading advice, nor is
it a recommendation to buy or sell any asset.
2. **Use at Your Own Risk:** All trading decisions you make based on
the information or signals generated by this indicator are made
solely at your own risk.
3. **No Guarantee of Performance:** Past performance is not an
indicator of future results. The author makes no guarantee
regarding the accuracy of the signals or future profitability.
4. **No Liability:** The author shall not be held liable for any
financial losses or damages incurred directly or indirectly from
the use of this indicator.
5. **Signals Are Not Recommendations:** The alerts and visual signals
(e.g., crossovers) generated by this tool are not direct
recommendations to buy or sell. They are technical observations
for your own analysis and consideration.

VIX Calm vs Choppy (Bar Version, VIX High Threshold)This indicator tracks market stability by measuring how long the VIX stays below or above a chosen intraday threshold. Instead of looking at VIX closes, it uses VIX high, so even a brief intraday spike will flip the regime into “choppy.”
The tool builds a running clock of consecutive bars spent in each regime:
Calm regime: VIX high stays below the threshold
Choppy regime: VIX high hits or exceeds the threshold
Calm streaks plot as positive bars (light blue background).
Choppy streaks plot as negative bars (dark pink background).
This gives a clean picture of how long the market has been stable vs volatile — useful for trend traders, breakout traders, and anyone who watches risk-on/risk-off conditions. A table shows the current regime and streak length for quick reference.

Periodic Volume Time Velocity ProfileThis is the Periodic Volume Time Velocity Profile (PVTVP). It is an advanced professional profiling tool that goes beyond standard volume analysis by introducing Time and Velocity (Flow Rate) as profile dimensions.
By analyzing high-resolution intra-bar data, it builds
precise profiles for any custom period (Session, Day, Week, etc.),
helping you understand not just *where* the market traded,
but *how* it traded there.
## The 3 Dimensions of the Market
Unlike standard tools that only show Volume, PVTVP allows you
to switch between three critical metrics:
1. **VOLUME Profile (The "Where"):**
* Shows standard acceptance. High volume nodes (HVN)
are magnets for price.
2. **TIME Profile (The "How Long"):**
* Similar to TPO, it measures how long price spent at each
level.
* **High Time:** True acceptance and fair value.
* **Low Time:** Rejection or rapid movement.
3. **VELOCITY Profile (The "How Fast"):**
* Measures the **speed of trading** (Contracts per Second).
This reveals the hidden intent of market participants.
* **High Velocity (Fast Flow):** Aggression. Initiative
buyers/sellers are hitting market orders rapidly. Often
seen at breakouts or in liquidity vacuums.
* **Low Velocity (Slow Flow):** Absorption. Massive passive
limit orders are slowing price down despite high volume.
Often seen at major reversals ("hitting a brick wall").
## Key Features
1. **Statistical Volume Profile Engine:** For each bar in the selected
period, the indicator builds a complete volume profile on a lower
'Intra-Bar Timeframe'. Instead of simple tick counting, it uses
**statistical models ('PDF' allocation)** to distribute volume
across price levels and **advanced classifiers ('Dynamic' split)**
to determine the buy/sell pressure within that profile.
2. **Flexible Profile Display:** The **finalized profile** (plotted at
the end of each period) can be visualized in three distinct
ways: 'Up/Down' (buy vs. sell), 'Total' (combined volume),
and 'Delta' (net difference).
3. **Developing Key Levels:** The indicator also plots the developing
Point of Control (POC), Value Area (VA), VWAP, and Standard
Deviation bands in real-time as the period unfolds, providing
live insights into the emerging market structure.
4. **Dynamic Row Sizing:** Includes an option ('Rows per Percent')
to automatically adjust the number of profile rows (buckets)
based on the profile's price range, maintaining a consistent
visual density.
5. **Integrated Alerts:** Includes 12 alerts that trigger when the
main price crosses over or under the key developing levels:
POC, VWAP, Value Area High/Low, and the +/- Standard
Deviation bands.
**Caution: Real-Time Data Behavior (Intra-Bar Repainting)**
This indicator uses high-resolution intra-bar data. As a result, the
values on the **current, unclosed bar** (the real-time bar) will
update dynamically as new intra-bar data arrives. This behavior is
normal and necessary for this type of analysis. Signals should only
be considered final **after the main chart bar has closed.**
---
**DISCLAIMER**
1. **For Informational/Educational Use Only:** This indicator is
provided for informational and educational purposes only. It does
not constitute financial, investment, or trading advice, nor is
it a recommendation to buy or sell any asset.
2. **Use at Your Own Risk:** All trading decisions you make based on
the information or signals generated by this indicator are made
solely at your own risk.
3. **No Guarantee of Performance:** Past performance is not an
indicator of future results. The author makes no guarantee
regarding the accuracy of the signals or future profitability.
4. **No Liability:** The author shall not be held liable for any
financial losses or damages incurred directly or indirectly from
the use of this indicator.
5. **Signals Are Not Recommendations:** The alerts and visual signals
(e.g., crossovers) generated by this tool are not direct
recommendations to buy or sell. They are technical observations
for your own analysis and consideration.

DAO - Demand Advanced Oscillator# DAO - Demand Advanced Oscillator
## 📊 Overview
DAO (Demand Advanced Oscillator) is a powerful momentum oscillator that measures buying and selling pressure by analyzing consecutive high-low relationships. It helps identify market extremes, divergences, and potential trend reversals.
**Values range from 0 to 1:**
- **Above 0.70** = Overbought (potential reversal down)
- **Below 0.30** = Oversold (potential reversal up)
- **0.30 - 0.70** = Neutral zone
---
## ✨ Key Features
✅ **Automatic Divergence Detection**
- Bullish divergences (price lower low + DAO higher low)
- Bearish divergences (price higher high + DAO lower high)
- Visual lines connecting divergence points
✅ **Multi-Timeframe Analysis**
- View higher timeframe DAO on current chart
- Perfect for trend alignment strategies
✅ **Signal Line (EMA)**
- Customizable EMA for trend confirmation
- Crossover signals for momentum shifts
✅ **Real-Time Statistics Dashboard**
- Current DAO value
- Market status (Overbought/Oversold/Neutral)
- Trend direction indicator
✅ **Complete Alert System**
- Overbought/Oversold signals
- Bullish/Bearish divergences
- Signal line crosses
- Level crosses
✅ **Fully Customizable**
- Adjustable periods and levels
- Customizable colors and zones
- Toggle features on/off
---
## 📈 Trading Signals
### 1. Divergences (Most Powerful)
**Bullish Divergence:**
- Price makes lower low
- DAO makes higher low
- Signal: Strong reversal up likely
**Bearish Divergence:**
- Price makes higher high
- DAO makes lower high
- Signal: Strong reversal down likely
### 2. Overbought/Oversold
**Overbought (>0.70):**
- Market may be overextended
- Consider taking profits or looking for shorts
- Can remain overbought in strong trends
**Oversold (<0.30):**
- Market may be oversold
- Consider buying opportunities
- Can remain oversold in strong downtrends
### 3. Signal Line Crossovers
**Bullish Cross:**
- DAO crosses above signal line
- Momentum turning positive
**Bearish Cross:**
- DAO crosses below signal line
- Momentum turning negative
### 4. Level Crosses
**Cross Above 0.30:** Exiting oversold zone (potential uptrend)
**Cross Below 0.70:** Exiting overbought zone (potential downtrend)
---
## ⚙️ Default Settings
📊 Oscillator Period: 14
Number of bars for calculation
📈 Signal Line Period: 9
EMA period for signal line
🔴 Overbought Level: 0.70
Upper threshold
🟢 Oversold Level: 0.30
Lower threshold
🎯 Divergence Detection: ON
Auto divergence identification
⏰ Multi-Timeframe: OFF
Higher TF overlay (optional)
All parameters are fully customizable!
---
## 🔔 Alerts
Six pre-configured alerts available:
1. DAO Overbought
2. DAO Oversold
3. DAO Bullish Divergence
4. DAO Bearish Divergence
5. DAO Signal Cross Up
6. DAO Signal Cross Down
**Setup:** Right-click indicator → Add Alert → Choose condition
---
## 💡 How to Use
### Best Practices:
✅ Focus on divergences (strongest signals)
✅ Combine with support/resistance levels
✅ Use multiple timeframes for confirmation
✅ Wait for price action confirmation
✅ Practice proper risk management
### Avoid:
❌ Trading on indicator alone
❌ Fighting strong trends
❌ Ignoring market context
❌ Overtrading
### Recommended Settings by Trading Style:
**Day Trading:** Period 7-10, All alerts ON
**Swing Trading:** Period 14-21, Divergence alerts
**Scalping:** Period 5-7, Signal crosses
**Position Trading:** Period 21-30, Weekly/Daily TF
---
## 🌍 Markets & Timeframes
**Works on all markets:**
- Forex (all pairs)
- Stocks (all exchanges)
- Cryptocurrencies
- Commodities
- Indices
- Futures
**Works on all timeframes:** 1m to Monthly
---
## 📊 How It Works
DAO calculates the ratio of buying pressure to total market pressure:
1. **Calculate Buying Pressure (DemandMax):**
- If current high > previous high: DemandMax = difference
- Otherwise: DemandMax = 0
2. **Calculate Selling Pressure (DemandMin):**
- If previous low > current low: DemandMin = difference
- Otherwise: DemandMin = 0
3. **Apply Smoothing:**
- Calculate SMA of DemandMax over N periods
- Calculate SMA of DemandMin over N periods
4. **Final Formula:**
```
DAO = SMA(DemandMax) / (SMA(DemandMax) + SMA(DemandMin))
```
This produces a normalized value (0-1) representing market demand strength.
---
## 🎯 Trading Strategies
### Strategy 1: Divergence Trading
- Wait for divergence label
- Confirm at support/resistance
- Enter on confirming candle
- Stop loss beyond recent swing
- Target: opposite level or 0.50
### Strategy 2: Overbought/Oversold
- Best for ranging markets
- Wait for extreme readings
- Enter on reversal from extremes
- Target: middle line (0.50)
### Strategy 3: Trend Following
- Identify trend direction first
- Use DAO to time entries in trend direction only
- Enter on pullbacks to oversold (uptrend) or overbought (downtrend)
- Trade with the trend
### Strategy 4: Multi-Timeframe
- Enable MTF feature
- Trade only when both timeframes align
- Higher TF = trend direction
- Lower TF = precise entry
---
## 📂 Category
**Primary:** Oscillators
**Secondary:** Statistics, Volatility, Momentum
---
## 🏷️ Tags
dao, oscillator, momentum, overbought-oversold, divergence, reversal, demand-indicator, price-exhaustion, statistics, volatility, forex, stocks, crypto, multi-timeframe, technical-analysis
---
## ⚠️ Disclaimer
**This indicator is for educational purposes only.** It does not constitute financial advice. Trading involves substantial risk of loss. Always conduct your own research, use proper risk management, and consult with financial professionals before making trading decisions. Past performance does not guarantee future results.
---
## 📄 License
Open source - Free to use for personal trading, modify as needed, and share with attribution.
---
**Version:** 1.0
**Status:** Production Ready ✅
**Pine Script:** v5
**Trademark-Free:** 100% Safe to Publish
---
*Made with 💙 for traders worldwide*

LibVeloLibrary "LibVelo"
This library provides a sophisticated framework for **Velocity
Profile (Flow Rate)** analysis. It measures the physical
speed of trading at specific price levels by relating volume
to the time spent at those levels.
## Core Concept: Market Velocity
Unlike Volume Profiles, which only answer "how much" traded,
Velocity Profiles answer "how fast" it traded.
It is calculated as:
`Velocity = Volume / Duration`
This metric (contracts per second) reveals hidden market
dynamics invisible to pure Volume or TPO profiles:
1. **High Velocity (Fast Flow):**
* **Aggression:** Initiative buyers/sellers hitting market
orders rapidly.
* **Liquidity Vacuum:** Price slips through a level because
order book depth is thin (low resistance).
2. **Low Velocity (Slow Flow):**
* **Absorption:** High volume but very slow price movement.
Indicates massive passive limit orders ("Icebergs").
* **Apathy:** Little volume over a long time. Lack of
interest from major participants.
## Architecture: Triple-Engine Composition
To ensure maximum performance while offering full statistical
depth for all metrics, this library utilises **object
composition** with a lazy evaluation strategy:
#### Engine A: The Master (`vpVol`)
* **Role:** Standard Volume Profile.
* **Purpose:** Maintains the "ground truth" of volume distribution,
price buckets, and ranges.
#### Engine B: The Time Container (`vpTime`)
* **Role:** specialized container for time duration (in ms).
* **Hack:** It repurposes standard volume arrays (specifically
`aBuy`) to accumulate time duration for each bucket.
#### Engine C: The Calculator (`vpVelo`)
* **Role:** Temporary scratchpad for derived metrics.
* **Purpose:** When complex statistics (like Value Area or Skewness)
are requested for **Velocity**, this engine is assembled
on-demand to leverage the full statistical power of `LibVPrf`
without rewriting complex algorithms.
---
**DISCLAIMER**
This library is provided "AS IS" and for informational and
educational purposes only. It does not constitute financial,
investment, or trading advice.
The author assumes no liability for any errors, inaccuracies,
or omissions in the code. Using this library to build
trading indicators or strategies is entirely at your own risk.
As a developer using this library, you are solely responsible
for the rigorous testing, validation, and performance of any
scripts you create based on these functions. The author shall
not be held liable for any financial losses incurred directly
or indirectly from the use of this library or any scripts
derived from it.
create(buckets, rangeUp, rangeLo, dynamic, valueArea, allot, estimator, cdfSteps, split, trendLen)
Construct a new `Velo` controller, initializing its engines.
Parameters:
buckets (int) : series int Number of price buckets ≥ 1.
rangeUp (float) : series float Upper price bound (absolute).
rangeLo (float) : series float Lower price bound (absolute).
dynamic (bool) : series bool Flag for dynamic adaption of profile ranges.
valueArea (int) : series int Percentage for Value Area (1..100).
allot (series AllotMode) : series AllotMode Allocation mode `Classic` or `PDF` (default `PDF`).
estimator (series PriceEst enum from AustrianTradingMachine/LibBrSt/1) : series PriceEst PDF model for distribution attribution (default `Uniform`).
cdfSteps (int) : series int Resolution for PDF integration (default 20).
split (series SplitMode) : series SplitMode Buy/Sell split for the master volume engine (default `Classic`).
trendLen (int) : series int Look‑back for trend factor in dynamic split (default 3).
Returns: Velo Freshly initialised velocity profile.
method clone(self)
Create a deep copy of the composite profile.
Namespace types: Velo
Parameters:
self (Velo) : Velo Profile object to copy.
Returns: Velo A completely independent clone.
method clear(self)
Reset all engines and accumulators.
Namespace types: Velo
Parameters:
self (Velo) : Velo Profile object to clear.
Returns: Velo Cleared profile (chaining).
method merge(self, srcVolBuy, srcVolSell, srcTime, srcRangeUp, srcRangeLo, srcVolCvd, srcVolCvdHi, srcVolCvdLo)
Merges external data (Volume and Time) into the current profile.
Automatically handles resizing and re-bucketing if ranges differ.
Namespace types: Velo
Parameters:
self (Velo) : Velo The profile object.
srcVolBuy (array) : array Source Buy Volume bucket array.
srcVolSell (array) : array Source Sell Volume bucket array.
srcTime (array) : array Source Time bucket array (ms).
srcRangeUp (float) : series float Upper price bound of the source data.
srcRangeLo (float) : series float Lower price bound of the source data.
srcVolCvd (float) : series float Source Volume CVD final value.
srcVolCvdHi (float) : series float Source Volume CVD High watermark.
srcVolCvdLo (float) : series float Source Volume CVD Low watermark.
Returns: Velo `self` (chaining).
method addBar(self, offset)
Main data ingestion. Distributes Volume and Time to buckets.
Namespace types: Velo
Parameters:
self (Velo) : Velo The profile object.
offset (int) : series int Offset of the bar to add (default 0).
Returns: Velo `self` (chaining).
method setBuckets(self, buckets)
Sets the number of buckets for the profile.
Namespace types: Velo
Parameters:
self (Velo) : Velo The profile object.
buckets (int) : series int New number of buckets.
Returns: Velo `self` (chaining).
method setRanges(self, rangeUp, rangeLo)
Sets the price range for the profile.
Namespace types: Velo
Parameters:
self (Velo) : Velo The profile object.
rangeUp (float) : series float New upper price bound.
rangeLo (float) : series float New lower price bound.
Returns: Velo `self` (chaining).
method setValueArea(self, va)
Set the percentage of volume/time for the Value Area.
Namespace types: Velo
Parameters:
self (Velo) : Velo The profile object.
va (int) : series int New Value Area percentage (0..100).
Returns: Velo `self` (chaining).
method getBuckets(self)
Returns the current number of buckets in the profile.
Namespace types: Velo
Parameters:
self (Velo) : Velo The profile object.
Returns: series int The number of buckets.
method getRanges(self)
Returns the current price range of the profile.
Namespace types: Velo
Parameters:
self (Velo) : Velo The profile object.
Returns:
rangeUp series float The upper price bound of the profile.
rangeLo series float The lower price bound of the profile.
method getArrayBuyVol(self)
Returns the internal raw data array for **Buy Volume** directly.
Namespace types: Velo
Parameters:
self (Velo) : Velo The profile object.
Returns: array The internal array for buy volume.
method getArraySellVol(self)
Returns the internal raw data array for **Sell Volume** directly.
Namespace types: Velo
Parameters:
self (Velo) : Velo The profile object.
Returns: array The internal array for sell volume.
method getArrayTime(self)
Returns the internal raw data array for **Time** (in ms) directly.
Namespace types: Velo
Parameters:
self (Velo) : Velo The profile object.
Returns: array The internal array for time duration.
method getArrayBuyVelo(self)
Returns the internal raw data array for **Buy Velocity** directly.
Automatically executes _assemble() if data is dirty.
Namespace types: Velo
Parameters:
self (Velo) : Velo The profile object.
Returns: array The internal array for buy velocity.
method getArraySellVelo(self)
Returns the internal raw data array for **Sell Velocity** directly.
Automatically executes _assemble() if data is dirty.
Namespace types: Velo
Parameters:
self (Velo) : Velo The profile object.
Returns: array The internal array for sell velocity.
method getBucketBuyVol(self, idx)
Returns the **Buy Volume** of a specific bucket.
Namespace types: Velo
Parameters:
self (Velo) : Velo The profile object.
idx (int) : series int The index of the bucket.
Returns: series float The buy volume.
method getBucketSellVol(self, idx)
Returns the **Sell Volume** of a specific bucket.
Namespace types: Velo
Parameters:
self (Velo) : Velo The profile object.
idx (int) : series int The index of the bucket.
Returns: series float The sell volume.
method getBucketTime(self, idx)
Returns the raw accumulated time (in ms) spent in a specific bucket.
Namespace types: Velo
Parameters:
self (Velo) : Velo The profile object.
idx (int) : series int The index of the bucket.
Returns: series float The time in milliseconds.
method getBucketBuyVelo(self, idx)
Returns the **Buy Velocity** (Aggressive Buy Flow) of a bucket.
Namespace types: Velo
Parameters:
self (Velo) : Velo The profile object.
idx (int) : series int The index of the bucket.
Returns: series float The buy velocity in .
method getBucketSellVelo(self, idx)
Returns the **Sell Velocity** (Aggressive Sell Flow) of a bucket.
Namespace types: Velo
Parameters:
self (Velo) : Velo The profile object.
idx (int) : series int The index of the bucket.
Returns: series float The sell velocity in .
method getBktBnds(self, idx)
Returns the price boundaries of a specific bucket.
Namespace types: Velo
Parameters:
self (Velo) : Velo The profile object.
idx (int) : series int The index of the bucket.
Returns:
up series float The upper price bound of the bucket.
lo series float The lower price bound of the bucket.
method getPoc(self, target)
Returns Point of Control (POC) information for the specified target metric.
Calculates on-demand if the target is 'Velocity' and data changed.
Namespace types: Velo
Parameters:
self (Velo) : Velo The profile object.
target (series Metric) : Metric The data aspect to analyse (Volume, Time, Velocity).
Returns:
pocIdx series int The index of the POC bucket.
pocPrice series float The mid-price of the POC bucket.
method getVA(self, target)
Returns Value Area (VA) information for the specified target metric.
Calculates on-demand if the target is 'Velocity' and data changed.
Namespace types: Velo
Parameters:
self (Velo) : Velo The profile object.
target (series Metric) : Metric The data aspect to analyse (Volume, Time, Velocity).
Returns:
vaUpIdx series int The index of the upper VA bucket.
vaUpPrice series float The upper price bound of the VA.
vaLoIdx series int The index of the lower VA bucket.
vaLoPrice series float The lower price bound of the VA.
method getMedian(self, target)
Returns the Median price for the specified target metric distribution.
Calculates on-demand if the target is 'Velocity' and data changed.
Namespace types: Velo
Parameters:
self (Velo) : Velo The profile object.
target (series Metric) : Metric The data aspect to analyse (Volume, Time, Velocity).
Returns:
medianIdx series int The index of the bucket containing the median.
medianPrice series float The median price.
method getAverage(self, target)
Returns the weighted average price (VWAP/TWAP) for the specified target.
Calculates on-demand if the target is 'Velocity' and data changed.
Namespace types: Velo
Parameters:
self (Velo) : Velo The profile object.
target (series Metric) : Metric The data aspect to analyse (Volume, Time, Velocity).
Returns:
avgIdx series int The index of the bucket containing the average.
avgPrice series float The weighted average price.
method getStdDev(self, target)
Returns the standard deviation for the specified target distribution.
Calculates on-demand if the target is 'Velocity' and data changed.
Namespace types: Velo
Parameters:
self (Velo) : Velo The profile object.
target (series Metric) : Metric The data aspect to analyse (Volume, Time, Velocity).
Returns: series float The standard deviation.
method getSkewness(self, target)
Returns the skewness for the specified target distribution.
Calculates on-demand if the target is 'Velocity' and data changed.
Namespace types: Velo
Parameters:
self (Velo) : Velo The profile object.
target (series Metric) : Metric The data aspect to analyse (Volume, Time, Velocity).
Returns: series float The skewness.
method getKurtosis(self, target)
Returns the excess kurtosis for the specified target distribution.
Calculates on-demand if the target is 'Velocity' and data changed.
Namespace types: Velo
Parameters:
self (Velo) : Velo The profile object.
target (series Metric) : Metric The data aspect to analyse (Volume, Time, Velocity).
Returns: series float The excess kurtosis.
method getSegments(self, target)
Returns the fundamental unimodal segments for the specified target metric.
Calculates on-demand if the target is 'Velocity' and data changed.
Namespace types: Velo
Parameters:
self (Velo) : Velo The profile object.
target (series Metric) : Metric The data aspect to analyse (Volume, Time, Velocity).
Returns: matrix A 2-column matrix where each row is an pair.
method getCvd(self, target)
Returns Cumulative Volume/Velo Delta (CVD) information for the target metric.
Namespace types: Velo
Parameters:
self (Velo) : Velo The profile object.
target (series Metric) : Metric The data aspect to analyse (Volume, Time, Velocity).
Returns:
cvd series float The final delta value.
cvdHi series float The historical high-water mark of the delta.
cvdLo series float The historical low-water mark of the delta.
Velo
Velo Composite Velocity Profile Controller.
Fields:
_vpVol (VPrf type from AustrianTradingMachine/LibVPrf/2) : LibVPrf.VPrf Engine A: Master Volume source.
_vpTime (VPrf type from AustrianTradingMachine/LibVPrf/2) : LibVPrf.VPrf Engine B: Time duration container (ms).
_vpVelo (VPrf type from AustrianTradingMachine/LibVPrf/2) : LibVPrf.VPrf Engine C: Scratchpad for velocity stats.
_aTime (array) : array Pointer alias to `vpTime.aBuy` (Time storage).
_valueArea (series float) : int Percentage of total volume to include in the Value Area (1..100)
_estimator (series PriceEst enum from AustrianTradingMachine/LibBrSt/1) : LibBrSt.PriceEst PDF model for distribution attribution.
_allot (series AllotMode) : AllotMode Attribution model (Classic or PDF).
_cdfSteps (series int) : int Integration resolution for PDF.
_isDirty (series bool) : bool Lazy evaluation flag for vpVelo.