Ben's BTC Macro Fair Value OscillatorBen's BTC Macro Fair Value Oscillator
Overview
The **BTC Macro Fair Value Oscillator** is a non-crypto fair value framework that uses macro asset relationships (equities, dollar, gold) to estimate Bitcoin's "macro-driven fair value" and identify mean-reversion opportunities.
"Is BTC cheap or expensive right now?" on the 4 Hour Timeframe ONLY
### Key Features
✅ **Macro-driven**: Uses QQQ, DXY, XAUUSD instead of on-chain or crypto metrics
✅ **Dynamic weighting**: Assets weighted by rolling correlation strength
✅ **Mean-reversion signals**: Identifies when BTC is cheap/expensive vs macro
✅ **Validated parameters**: Optimized through 5-year backtest (Sharpe 6.7-9.9)
✅ **Visual transparency**: Live correlation panel, fair value bands, statistics
✅ **Non-repainting**: All calculations use confirmed historical data only
### What This Indicator Does
- Builds a **synthetic macro composite** from traditional assets
- Runs a **rolling regression** to predict BTC price from macro
- Calculates **deviation z-score** (how far BTC is from macro fair value)
- Generates **entry signals** when BTC is extremely cheap vs macro (dev < -2)
- Generates **exit signals** when BTC returns to fair value (dev > 0)
### What This Indicator Is NOT
❌ Not a high-frequency trading system (sparse signals by design)
❌ Not optimized for absolute returns (optimized for Sharpe ratio)
❌ Not suitable as standalone trading system (best as overlay/confirmation)
❌ Not predictive of short-term price movements (mean-reversion timeframe: days to weeks)
---
## Core Concept
### The Premise
Bitcoin doesn't trade in a vacuum. It's influenced by:
- **Risk appetite** (equities: QQQ, SPX)
- **Dollar strength** (DXY - inverse to risk assets)
- **Safe haven flows** (Gold: XAUUSD)
When macro conditions are "good for BTC" (risk-on, weak dollar, strong equities), BTC should trade higher. When macro conditions turn against it, BTC should trade lower.
### The Innovation
Instead of looking at BTC in isolation, this indicator:
1. **Measures how strongly** BTC currently correlates with each macro asset
2. **Builds a weighted composite** of those macro returns (the "D" driver)
3. **Regresses BTC price on D** to estimate "macro fair value"
4. **Tracks the deviation** between actual price and fair value
5. **Signals mean reversion** when deviation becomes extreme
### The Edge
The validated edge comes from:
- **Extreme deviations predict future returns** (dev < -2 → +1.67% over 12 bars)
- **Monotonic relationship** (more negative dev → higher forward returns)
- **Works out-of-sample** (test Sharpe +83-87% better than training)
- **Low correlation with buy & hold** (provides diversification value)
---
## Methodology
### Step 1: Macro Composite Driver D(t)
The indicator builds a weighted composite of macro asset returns:
**Process:**
1. Calculate **log returns** for BTC and each macro reference (QQQ, DXY, XAUUSD)
2. Compute **rolling correlation** between BTC and each reference over `corrLen` bars
3. **Weight each asset** by `|correlation|` if above `minCorrAbs` threshold, else 0
4. **Sign-adjust** weights (+1 for positive corr, -1 for negative) to handle inverse relationships
5. **Z-score normalize** each reference's returns over `fvWindow`
6. **Composite D(t)** = weighted sum of sign-adjusted z-scores
**Formula:**
```
For each reference i:
corr_i = correlation(BTC_returns, ref_i_returns, corrLen)
weight_i = |corr_i| if |corr_i| >= minCorrAbs else 0
sign_i = +1 if corr_i >= 0 else -1
z_i = (ref_i_returns - mean) / std
contrib_i = sign_i * z_i * weight_i
D(t) = sum(contrib_i) / sum(weight_i)
```
**Key Insight:** D(t) represents "how good macro conditions are for BTC right now" in a normalized, correlation-weighted way.
---
### Step 2: Fair Value Regression
Uses rolling linear regression to predict BTC price from D(t):
**Model:**
```
BTC_price(t) = α + β * D(t)
```
**Calculation (Pine Script approach):**
```
corr_CD = correlation(BTC_price, D, fvWindow)
sd_price = stdev(BTC_price, fvWindow)
sd_D = stdev(D, fvWindow)
cov = corr_CD * sd_price * sd_D
var_D = variance(D, fvWindow)
β = cov / var_D
α = mean(BTC_price) - β * mean(D)
fair_value(t) = α + β * D(t)
```
**Result:** A time-varying "macro fair value" line that adapts as correlations change.
---
### Step 3: Deviation Oscillator
Measures how far BTC price has deviated from fair value:
**Calculation:**
```
residual(t) = BTC_price(t) - fair_value(t)
residual_std = stdev(residual, normWindow)
deviation(t) = residual(t) / residual_std
```
**Interpretation:**
- `dev = 0` → BTC at fair value
- `dev = -2` → BTC is 2 standard deviations **cheap** vs macro
- `dev = +2` → BTC is 2 standard deviations **rich** vs macro
---
### Step 4: Signal Generation
**Long Entry:** `dev` crosses below `-2.0` (BTC extremely cheap vs macro)
**Long Exit:** `dev` crosses above `0.0` (BTC returns to fair value)
**No shorting** in default config (risk management choice - crypto volatility)
---
## How It Works
### Visual Components
#### 1. Price Chart (Main Panel)
**Fair Value Line (Orange):**
- The estimated "macro-driven fair value" for BTC
- Calculated from rolling regression on macro composite
**Fair Value Bands:**
- **±1σ** (light): 68% confidence zone
- **±2σ** (medium): 95% confidence zone
- **±3σ** (dark, dots): 99.7% confidence zone
**Entry/Exit Markers:**
- **Green "LONG" label** below bar: Entry signal (dev < -2)
- **Red "EXIT" label** above bar: Exit signal (dev > 0)
#### 2. Deviation Oscillator (Separate Pane)
**Line plot:**
- Shows current deviation z-score
- **Green** when dev < -2 (cheap)
- **Red** when dev > +2 (rich)
- **Gray** when neutral
**Histogram:**
- Visual representation of deviation magnitude
- Green bars = negative deviation (cheap)
- Red bars = positive deviation (rich)
**Threshold lines:**
- **Green dashed at -2.0**: Entry threshold
- **Red dashed at 0.0**: Exit threshold
- **Gray solid at 0**: Fair value line
#### 3. Correlation Panel (Top-Right)
Shows live correlation and weighting for each macro asset:
| Asset | Corr | Weight |
|-------|------|--------|
| QQQ | +0.45 | 0.45 |
| DXY | -0.32 | 0.32 |
| XAUUSD | +0.15 | 0.00 |
| Avg \|Corr\| | 0.31 | 0.77 |
**Reading:**
- **Corr**: Current rolling correlation with BTC (-1 to +1)
- **Weight**: How much this asset contributes to fair value (0 = excluded)
- **Avg |Corr|**: Average correlation strength (should be > 0.2 for reliable signals)
**Colors:**
- Green/Red corr = positive/negative correlation
- White weight = asset included, Gray = excluded (below minCorrAbs)
#### 4. Statistics Label (Bottom-Right)
```
━━━ BTC Macro FV ━━━
Dev: -2.34
Price: $103,192
FV: $110,500
Status: CHEAP ⬇
β: 103.52
```
**Fields:**
- **Dev**: Current deviation z-score
- **Price**: Current BTC close price
- **FV**: Current macro fair value estimate
- **Status**: CHEAP (< -2), RICH (> +2), or FAIR
- **β**: Current regression beta (sensitivity to macro)
---
## Installation & Setup
### TradingView Setup
1. Open TradingView and navigate to any **BTC chart** (BTCUSD, BTCUSDT, etc.)
2. Open **Pine Editor** (bottom panel)
3. Click **"+ New"** → **"Blank indicator"**
4. **Delete** all default code
5. **Copy** the entire Pine Script from `GHPT_optimized.pine`
6. **Paste** into the editor
7. Click **"Save"** and name it "BTC Macro Fair Value Oscillator"
8. Click **"Add to Chart"**
### Recommended Chart Settings
**Timeframe:** 4h (validated timeframe)
**Chart Type:** Candlestick or Heikin Ashi
**Overlay:** Yes (indicator plots on price chart + separate pane)
**Alternative Timeframes:**
- Daily: Works but slower signals
- 1h-2h: May work but not validated
- < 1h: Not recommended (too noisy)
### Symbol Requirements
**Primary:** BTC/USD or BTC/USDT on any exchange
**Macro References:** Automatically fetched
- QQQ (Nasdaq 100 ETF)
- DXY (US Dollar Index)
- XAUUSD (Gold spot)
**Data Requirements:**
- At least **90 bars** of history (warmup period)
- Premium TradingView recommended for full historical data
---
## Reading the Indicator
### Identifying Signals
#### Strong Long Signal (High Conviction)
- ✅ Deviation < -2.0 (extreme undervaluation)
- ✅ Avg |Corr| > 0.3 (strong macro relationships)
- ✅ Price touching or below -2σ band
- ✅ "LONG" label appears below bar
**Interpretation:** BTC is extremely cheap relative to macro conditions. Historical data shows +1.67% average return over next 12 bars (48 hours at 4h timeframe).
#### Moderate Long Signal (Lower Conviction)
- ⚠️ Deviation between -1.5 and -2.0
- ⚠️ Avg |Corr| between 0.2-0.3
- ⚠️ Price approaching -2σ band
**Interpretation:** BTC is cheap but not extreme. Consider as confirmation for other signals.
#### Exit Signal
- 🔴 Deviation crosses above 0 (returns to fair value)
- 🔴 "EXIT" label appears above bar
**Interpretation:** Mean reversion complete. Close long positions.
#### Strong Short/Avoid Signal
- 🔴 Deviation > +2.0 (extreme overvaluation)
- 🔴 Avg |Corr| > 0.3
- 🔴 Price touching or above +2σ band
**Interpretation:** BTC is expensive vs macro. Historical data shows -1.79% average return over next 12 bars. Consider exiting longs or reducing exposure.
### Regime Detection
**Strong Regime (Reliable Signals):**
- Avg |Corr| > 0.3
- Multiple assets weighted > 0
- Fair value line tracking price reasonably well
**Weak Regime (Unreliable Signals):**
- Avg |Corr| < 0.2
- Most weights = 0 (grayed out)
- Fair value line diverging wildly from price
- **Action:** Ignore signals until correlations strengthen
Buscar en scripts para "电脑桌面显示BTC"

Intellect_city - Halvings Bitcoin CycleWhat is halving?
The halving timer shows when the next Bitcoin halving will occur, as well as the dates of past halvings. This event occurs every 210,000 blocks, which is approximately every 4 years. Halving reduces the emission reward by half. The original Bitcoin reward was 50 BTC per block found.
Why is halving necessary?
Halving allows you to maintain an algorithmically specified emission level. Anyone can verify that no more than 21 million bitcoins can be issued using this algorithm. Moreover, everyone can see how much was issued earlier, at what speed the emission is happening now, and how many bitcoins remain to be mined in the future. Even a sharp increase or decrease in mining capacity will not significantly affect this process. In this case, during the next difficulty recalculation, which occurs every 2014 blocks, the mining difficulty will be recalculated so that blocks are still found approximately once every ten minutes.
How does halving work in Bitcoin blocks?
The miner who collects the block adds a so-called coinbase transaction. This transaction has no entry, only exit with the receipt of emission coins to your address. If the miner's block wins, then the entire network will consider these coins to have been obtained through legitimate means. The maximum reward size is determined by the algorithm; the miner can specify the maximum reward size for the current period or less. If he puts the reward higher than possible, the network will reject such a block and the miner will not receive anything. After each halving, miners have to halve the reward they assign to themselves, otherwise their blocks will be rejected and will not make it to the main branch of the blockchain.
The impact of halving on the price of Bitcoin
It is believed that with constant demand, a halving of supply should double the value of the asset. In practice, the market knows when the halving will occur and prepares for this event in advance. Typically, the Bitcoin rate begins to rise about six months before the halving, and during the halving itself it does not change much. On average for past periods, the upper peak of the rate can be observed more than a year after the halving. It is almost impossible to predict future periods because, in addition to the reduction in emissions, many other factors influence the exchange rate. For example, major hacks or bankruptcies of crypto companies, the situation on the stock market, manipulation of “whales,” or changes in legislative regulation.
---------------------------------------------
Table - Past and future Bitcoin halvings:
---------------------------------------------
Date: Number of blocks: Award:
0 - 03-01-2009 - 0 block - 50 BTC
1 - 28-11-2012 - 210000 block - 25 BTC
2 - 09-07-2016 - 420000 block - 12.5 BTC
3 - 11-05-2020 - 630000 block - 6.25 BTC
4 - 20-04-2024 - 840000 block - 3.125 BTC
5 - 24-03-2028 - 1050000 block - 1.5625 BTC
6 - 26-02-2032 - 1260000 block - 0.78125 BTC
7 - 30-01-2036 - 1470000 block - 0.390625 BTC
8 - 03-01-2040 - 1680000 block - 0.1953125 BTC
9 - 07-12-2043 - 1890000 block - 0.09765625 BTC
10 - 10-11-2047 - 2100000 block - 0.04882813 BTC
11 - 14-10-2051 - 2310000 block - 0.02441406 BTC
12 - 17-09-2055 - 2520000 block - 0.01220703 BTC
13 - 21-08-2059 - 2730000 block - 0.00610352 BTC
14 - 25-07-2063 - 2940000 block - 0.00305176 BTC
15 - 28-06-2067 - 3150000 block - 0.00152588 BTC
16 - 01-06-2071 - 3360000 block - 0.00076294 BTC
17 - 05-05-2075 - 3570000 block - 0.00038147 BTC
18 - 08-04-2079 - 3780000 block - 0.00019073 BTC
19 - 12-03-2083 - 3990000 block - 0.00009537 BTC
20 - 13-02-2087 - 4200000 block - 0.00004768 BTC
21 - 17-01-2091 - 4410000 block - 0.00002384 BTC
22 - 21-12-2094 - 4620000 block - 0.00001192 BTC
23 - 24-11-2098 - 4830000 block - 0.00000596 BTC
24 - 29-10-2102 - 5040000 block - 0.00000298 BTC
25 - 02-10-2106 - 5250000 block - 0.00000149 BTC
26 - 05-09-2110 - 5460000 block - 0.00000075 BTC
27 - 09-08-2114 - 5670000 block - 0.00000037 BTC
28 - 13-07-2118 - 5880000 block - 0.00000019 BTC
29 - 16-06-2122 - 6090000 block - 0.00000009 BTC
30 - 20-05-2126 - 6300000 block - 0.00000005 BTC
31 - 23-04-2130 - 6510000 block - 0.00000002 BTC
32 - 27-03-2134 - 6720000 block - 0.00000001 BTC

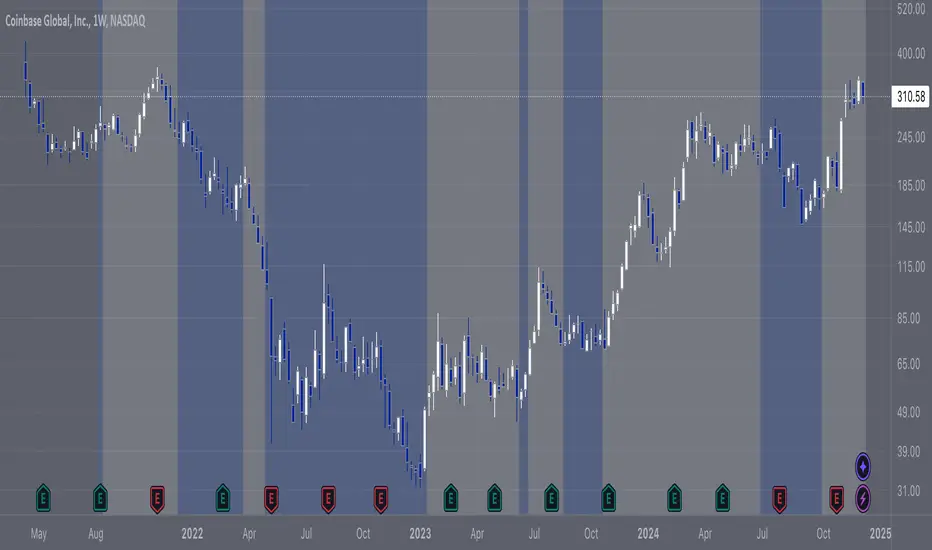
Momentum Matrix (BTC-COIN)The Momentum Matrix (BTC-COIN) indicator analyzes the momentum relationship between Coinbase stock ( NASDAQ:COIN ) and Bitcoin ( CRYPTOCAP:BTC ). By combining RSI, correlation, and dominance metrics, it identifies bullish and bearish macro trends to align trades with market momentum.
How It Works
Price Inputs: Pulls weekly price data for CRYPTOCAP:BTC and NASDAQ:COIN for macro analysis.
Metrics Calculated:
• RSI Divergence: Measures momentum differences between CRYPTOCAP:BTC and $COIN.
• Price Ratio: Tracks the $COIN/ CRYPTOCAP:BTC relationship relative to its long-term average (SMA).
• Correlation: Analyzes price co-movement between CRYPTOCAP:BTC and $COIN.
• Dominance Impact: Incorporates CRYPTOCAP:BTC dominance for broader crypto trends.
Composite Momentum Score: Combines these metrics into a smoothed macro momentum value.
Thresholds for Trend Detection: Upper and lower thresholds dynamically adapt to market conditions.
Signals and Visualization:
• Buy Signal: Momentum exceeds the upper threshold, indicating bullish trends.
• Sell Signal: Momentum falls below the lower threshold, indicating bearish trends.
• Background Colors: Green (bullish), Red (bearish).
Strengths
Integrates multiple metrics for robust macro analysis.
Dynamic thresholds adapt to market conditions.
Effective for identifying macro momentum shifts.
Limitations
Lag in high volatility due to smoothing.
Less effective in choppy, sideways markets.
Assumes CRYPTOCAP:BTC dominance drives NASDAQ:COIN momentum, which may not always hold true.
Improvements
Multi-Timeframe Analysis: Add daily or monthly data for precision.
Volume Filters: Include volume thresholds for signal validation.
Additional Metrics: Consider MACD or Stochastics for further confirmation.
Complementary Tools
Volume Indicators: OBV or cumulative delta for confirmation.
Trend-Following Systems: Pair with moving averages for timing.
Market Breadth Metrics: Combine with CRYPTOCAP:BTC dominance trends for context.

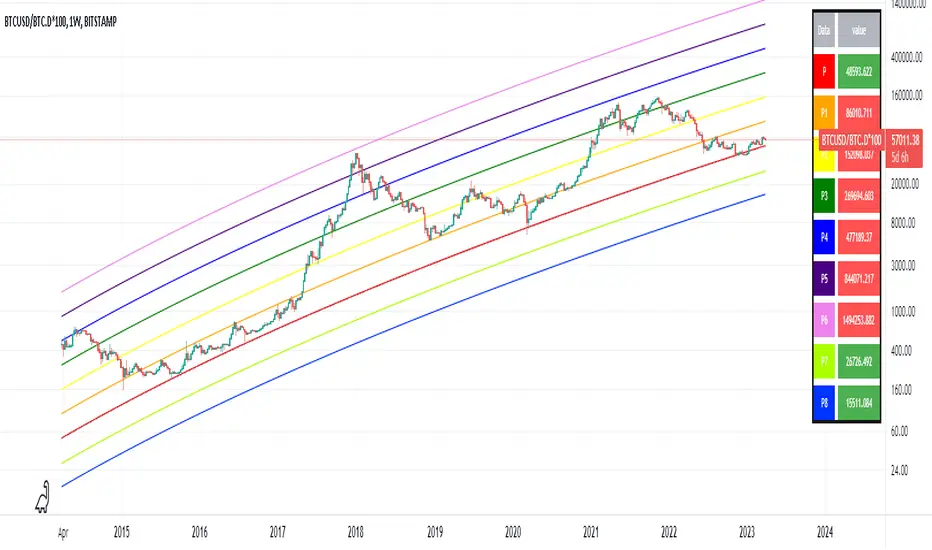
MACRO BTC HEALTH 1WThis indicator is used as MACRO tool to view the outlook of BTC on the 1W time frame to illustrate (BLX chart works best)
BTC's price action and where it's at, it helps provide an indication of the crypto market's current health as BTC health is an overall indicator in the crypto market as a whole.
This indicator uses historic data to fit between 4 bands fitted to MA, top(red) when BTC is overheated, 2 bands in middle(yellow) when BTC in fair value, and bottom band(blue) when BTC is oversold
I combined MA that fit BTC 1W chart precisely to show when BTC looks overheated vs over sold using historic data.
When BTC is in the top bands historically overheated.
When BTC is in the middle it is fighting at fair value with the 2 yellow lines in the middle, bullish when above yellow lines, as they act as support, and in downtrend when price is below yellow lines and can act as resistance.
Historically the 200W MA is where BTC finds support at an oversold level at the bottom blue line.
When two yellow lines in middle cross downwards historically results in a downtrend to the bottom oversold line (blue). and when two yellow lines cross up and BTC holds them as support bullish trend continues until it is overheated passed the red band.
This indicator is not meant for day trading but is meant to illustrate a MACRO view of BTC current situation from a zoomed-out view, and to help illustrate to investors where things are at so they leave emotions out of the market and can make decisions based on BTC current levels using Historic data. Pro tip use bottom line(blue, oversold) as an opportunity to buy in and top line red(overheated) to scale out of positions, LONG TERM CRYPTO IS BULLISH BUT GREAT TO GET AN OUTLOOK OF THE CURRENT STATE OF BTC, WHILE ALSO USING MACRO ECONOMIC SENTIMENT IRL, FUNDAMENTAL ECONOMIC DECISIONS, ECONOMIC CONDITIONS/ENVIRONMENT, ECONOMIC HEALTH ,FED DECISIONS, INTEREST RATE ENVIRONMENT AND OF COURSE LOOKING AT CRYPTO ADOPTION.
Hope this indicator helps leave emotions out of the market by providing a good guide of BTC sentiment, and its current health to make decisions accordingly. NFA but good to envision the MACRO BTC HEALTH at the 1W timeframe.

Rolling Correlation BTC vs Hedge AssetsRolling Correlation BTC vs Hedge Assets
Overview
This indicator calculates and plots the rolling correlation between Bitcoin (BTC) returns and several key hedge assets:
• XAUUSD (Gold)
• EURUSD (proxy for DXY, U.S. Dollar Index)
• VIX (Volatility Index)
• TLT (20y U.S. Treasury Bonds ETF)
By monitoring these dynamic correlations, traders can identify whether BTC is moving in sync with risk assets or decoupling as a hedge, and adjust their trading strategy accordingly.
How it works
1. Computes returns for BTC and each asset using percentage change.
2. Uses the rolling correlation function (ta.correlation) over a configurable window length (default = 12 bars).
3. Plots each correlation as a separate colored line (Gold = Yellow, EURUSD = Blue, VIX = Red, TLT = Green).
4. Adds threshold levels at +0.3 and -0.3 to help classify correlation regimes.
How to use it
• High positive correlation (> +0.3): BTC is moving together with the asset (risk-on behavior).
• Near zero (-0.3 to +0.3): BTC is showing little to no correlation — neutral/independent moves.
• Negative correlation (< -0.3): BTC is moving in the opposite direction — potential hedge opportunity.
Practical strategies:
• Watch BTC vs VIX: a spike in volatility (VIX ↑) usually coincides with BTC selling pressure.
• Track BTC vs EURUSD: stronger USD often puts downside pressure on BTC.
• Observe BTC vs Gold: during “flight to safety” events, gold rises while BTC weakens.
• Monitor BTC vs TLT: rising yields (falling TLT) often align with BTC weakness.
Inputs
• Window Length (bars): Number of bars used to calculate rolling correlations (default = 12).
• Comparison Timeframe: Default = 5m. Can be changed to align with your intraday or swing trading style.
Notes
• Works best on intraday charts (1m, 5m, 15m) for scalping and short-term setups.
• Use correlations as context, not standalone signals — combine with volume, VWAP, and price action.
• Correlations are dynamic; they can switch regimes quickly during macro events (CPI, NFP, FOMC).
This tool is designed for traders who want to manage risk exposure by monitoring whether BTC is behaving as a risk-on asset or hedge, and to exploit opportunities during decoupling phases.

Cash And Carry Arbitrage BTC Compare Month 6 by SeoNo1Detailed Explanation of the BTC Cash and Carry Arbitrage Script
Script Title: BTC Cash And Carry Arbitrage Month 6 by SeoNo1
Short Title: BTC C&C ABT Month 6
Version: Pine Script v5
Overlay: True (The indicators are plotted directly on the price chart)
Purpose of the Script
This script is designed to help traders analyze and track arbitrage opportunities between the spot market and futures market for Bitcoin (BTC). Specifically, it calculates the spread and Annual Percentage Yield (APY) from a cash-and-carry arbitrage strategy until a specific expiry date (in this case, June 27, 2025).
The strategy helps identify profitable opportunities when the futures price of BTC is higher than the spot price. Traders can then buy BTC in the spot market and short BTC futures contracts to lock in a risk-free profit.
1. Input Settings
Spot Symbol: The real-time BTC spot price from Binance (BTCUSDT).
Futures Symbol: The BTC futures contract that expires in June 2025 (BTCUSDM2025).
Expiry Date: The expiration date of the futures contract, set to June 27, 2025.
These inputs allow users to adjust the symbols or expiry date according to their trading needs.
2. Price Data Retrieval
Spot Price: Fetches the latest closing price of BTC from the spot market.
Futures Price: Fetches the latest closing price of BTC futures.
Spread: The difference between the futures price and the spot price (futures_price - spot_price).
The spread indicates how much higher (or lower) the futures price is compared to the spot market.
3. Time to Maturity (TTM) and Annual Percentage Yield (APY) Calculation
Current Date: Gets the current timestamp.
Time to Maturity (TTM): The number of days left until the futures contract expires.
APY Calculation:
Formula:
APY = ( Spread / Spot Price ) x ( 365 / TTM Days ) x 100
This represents the annualized return from holding a cash-and-carry arbitrage position if the trader buys BTC at the spot price and sells BTC futures.
4. Display Information Table on the Chart
A table is created on the chart's top-right corner showing the following data:
Metric: Labels such as Spread and APY
Value: Displays the calculated spread and APY
The table automatically updates at the latest bar to display the most recent data.
5. Alert Condition
This sets an alert condition that triggers every time the script runs.
In practice, users can modify this alert to trigger based on specific conditions (e.g., APY exceeds a threshold).
6. Plotting the APY and Spread
APY Plot: Displays the annualized yield as a blue line on the chart.
Spread Plot: Visualizes the futures-spot spread as a red line.
This helps traders quickly identify arbitrage opportunities when the spread or APY reaches desirable levels.
How to Use the Script
Monitor Arbitrage Opportunities:
A positive spread indicates a potential cash-and-carry arbitrage opportunity.
The larger the APY, the more profitable the arbitrage opportunity could be.
Timing Trades:
Execute a buy on the BTC spot market and simultaneously sell BTC futures when the APY is attractive.
Close both positions upon futures contract expiry to realize profits.
Risk Management:
Ensure you have sufficient margin to hold both positions until expiry.
Monitor funding rates and volatility, which could affect returns.
Conclusion
This script is an essential tool for traders looking to exploit price discrepancies between the BTC spot market and futures market through a cash-and-carry arbitrage strategy. It provides real-time data on spreads, annualized returns (APY), and visual alerts, helping traders make informed decisions and maximize their profit potential.

Arbitrage Sniper (POC)Good Morning Traders!
Today I want to share with you the proof-of-concept of how you would be able to do arbitrage with crypto pairs.
THE INDICATOR MUST BE PLACED ON THE TRADING PAIR OF THE TWO CURRENCIES (i.e. ETH/BTC, EOS/ETH etc.)
This arbitrage method is based on the transitional decorrelation between the crypto treding pair and the price ratio of the involved currencies, of course computing commissions as well.
Whenever the non-arbitrage condition is not respected, there is an arbitrage oportunity.
This indicator won't consider the chance of shorting, so if the arbitrage oportunity occurs the indicator will suggest you just the chance of buying the relative-undervalued currency (but inside the code you will know how to do the alternative method as well, by shorting the relative-overvalued currency)
Let's take the trading pair ETH/BTC (as in the graph) → if we assume commissions for the 0.075% of the order, the non-arbitrage condition will be presented like this
This arbitrage method will need three orders, so n=3
So let's assume that P(ETH)/(P(BTC)*P(ETH/BTC))>(1-0.075)^(-3) → it means that the price of Ethereum is currently overreated enough (relatively to the trading pair) for doing arbitrage.
We have two alternatives:
• Buy BTC, change it into ETH (by "buying" ETH in the trading pair ETH/BTC) and then sell ETH
• Sell ETH, buy BTC, change it into ETH (by "buying" ETH in the trading pair ETH/BTC)
On the other hand, if P(ETH)/(P(BTC)*P(ETH/BTC))<(1-0.075)^(-3) → it means that the price of Ethereum is currently underrared enough (relatively to the trading pair) for doing arbitrage.
We have two alternatives:
• Buy ETH, change it into BTC (by "selling" ETH in the trading pair ETH/BTC) and then sell BTC
• Sell BTC, buy ETH, change it into BTC (by "selling" ETH in the trading pair ETH/BTC)
I'm saying that is nothing more than a proof-of-concept since:
- Arbitrage Oportunities will emerge frequently just nearly zero commissions
- Data of prices are retrieved using security() function and there can be some delay (so the arbitrage oportunity will be already extinguished by the time the signal is retrieved)
- In order to have the freshest data, repiainting will occurr

Sveezy BTC Level SyncThis indicator lets you define up to 5 key Bitcoin price levels (support or resistance zones). Whenever BTC “touches” (crosses up) one of those levels on your chosen exchange, the script records the exact bar, then on any non-BTC chart it draws a dashed horizontal line at that asset’s price at the same moment in time. You can optionally display a plain-text BTC-level label, right-justified a configurable number of bars to the right of each line.
Features:
- 5 user-defined BTC levels via separate inputs
- Time-synced across symbols: marks altcoin price on the exact bar BTC hit the level
- Most recent touch only: lines update when BTC crosses the same level again
- Right-justified labels: plain text (no box) showing the BTC level, offset by bars & ticks
- Lightweight: uses only built-in line and label primitives, no heavy loops
How to Use:
- Open any altcoin chart (ETH, SOL, your token).
- Add the indicator from Pine Editor (paste and save).
- Enter your BTC symbol and up to 5 levels.
- Enable labels if desired; adjust offsets.
- Watch dashed lines plot at your alt’s price every time BTC crosses a level.
Ideal For:
- Pair traders who want to sync entries/exits to BTC key levels
- Arbitrageurs scanning multiple alt charts for BTC-driven swings
- Anyone wishing to visualize how alts responded at specific BTC prices
Feel free to fork and customize further (cross-down detection, color schemes, multi-timeframe support). If you find it helpful, drop a comment or upvote!
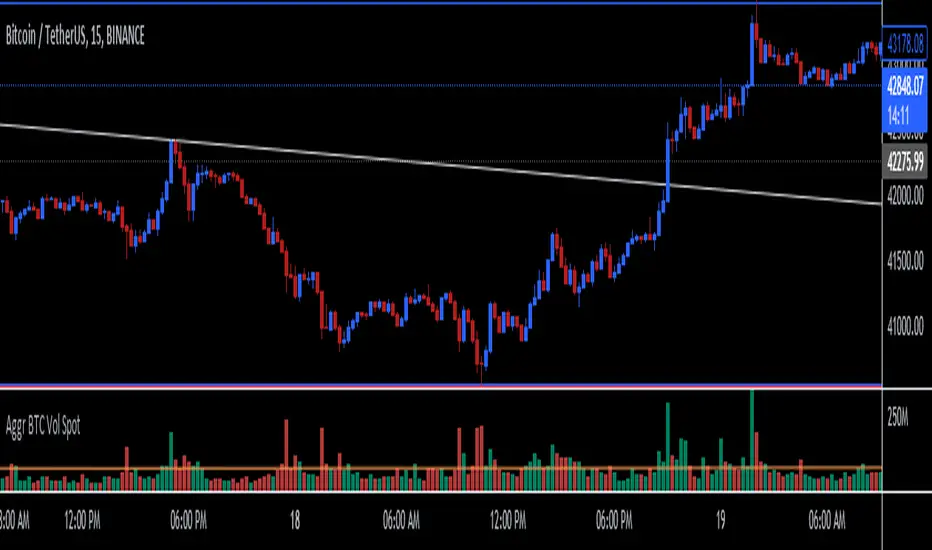
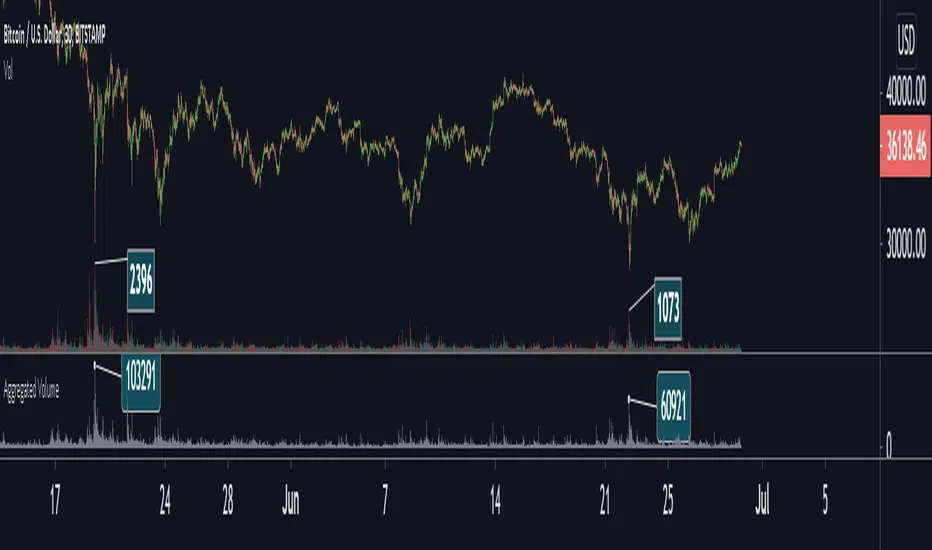
Aggregate BTC Volume Spot - Ma78erAggregate BTC Volume indicator show aggregates trading volumes of Bitcoin from multiple trading platforms.
Exchange Include:
1: Binance - BTC(USDT, USDC, FDUSD, TUSD)
2: Coinbase - BTC(USD, EUR, USDT, GBP)
3: OKX - BTC(USDT, USDC)
4: BYBIT - BTC(USDT, USDC)
5: KUCOIN - BTC(USDT, USDC)
6: KRAKEN - BTC(USD, EUR, USDT, GBP, USDC)
7: Bitfinex - BTC(USD, EUR, GBP)
8: Bitstamp - BTC(USD, EUR, USDT, GBP, USDC)
9: GATEIO - BTC(USDT)
You can also add other exchange in script manually.
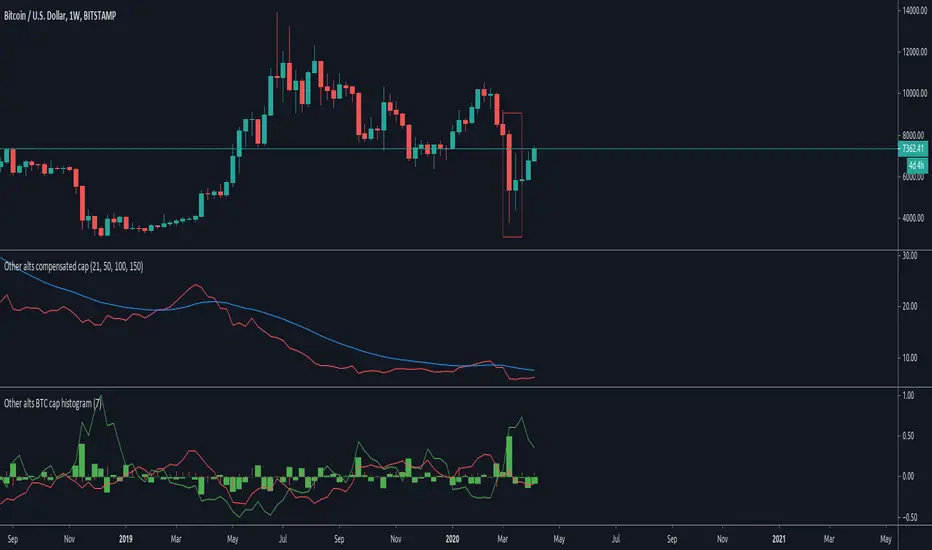
Other altcoins BTC capitalization histogram [peregringlk]Introduction
==========
This study is intented to be used in combination with my other study "Other alts compensated cap". Read its description, in particular, it's rationale, to understand why I have removed the big capitalized altcoins from these studies.
The middle indicator in the image is that other study, while the indicator in the buttom of the image is that one.
It shows, in form of histogram, the BTC capitalization change rate (per candle, using closes) of the "OTHERS" altcoins together with the inverse of the BTCUSD price change rate per candle.
NOTE: I call the change rate to the multiplier factor of price from bar to bar. For example, a change rate of 1.20 means +20% respect to "yesterday", and a change rate of 0.80 means -20%.
The idea is to know what are altcoin markets (against BTC) doing after each BTC price change.
Definitions
=========
I will use ALT from now one as the name of an index or fictional coin that represents the average price of all other altcoins combined. I'll use then ALTUSD to represent the price against USD of such fictional coin (= the OTHERS capitalization, as if the USD capitalization of altcoins were the USD price of ALT), and ALTBTC to represent the same price but against BTC (calculated by taking ALTUSD/BITSTAMP:BTCUSD; the choosing of BITSTAMP is because it's the market with a longer history in tradingview).
Since I use the "OTHERS" security, I cannot know the real altcoin index so I can only estimate by using the capitalization. CIX100 could be a solution, but it is too recent in time as to inspect past price actions.
Description
=========
For example, let's assume BTCUSD decreases by 20% today. It would cause a fall in ALTUSD of 20% (just maths). So, what should it happen in ALTBTC to preserve the original ALTUSD price? People should buy alts in BTC markets by a factor of 1/0.8 = 1.25. Or in other words, unless there are a +25% grow in ALTBTC, ALTUSD would see a decrease in value.
This is what the histogram shows. The red columns shows the ALTBTC change rate per candle, while each green column shows what is the required change rate in ALTBTC required to preserve its ALTUSD value (capitalization). In other words, the green columns are the "targets" to preserve USD capitalization in ALTBTC, while the red histogram shows the actual changes.
Also, it shows two curves. There are just the change rate accumulation during some customizable interval (the same for both lines, and 7 by default; or the "week" for daily candles).
The green line is the accumulated "target" change rate within that period of time (the accumulated product of the last `interval` change rates), and the red line is the actual change rate for the same `interval` candles.
Interpretation
============
If red column values are bigger than the green ones (green column is negative, and red column is positive; or both are positives but the red one "put outs", or both are negative but the red column doesn't "put out"), OTHERS USD capitalization has increased.
If red column values are lower than the green ones (green column is positive and red column is negative; or both are positives but the red one doesn't "put out"; or both are negative but the red column "put outs"), OTHERS USD capitalization has decreased.
The same for the continuous lines: if the red line is above the green one, OTHERS USD capitalization has increased during "the past week". Otherwise, it has decreased.
The added value of this indicator is that it allows you to know "why". For example, if a green column is positive, and its corresponding red column is positive as well, but below the green one, the capitalization has decreased but BECAUSE the btc price has fallen, not because there was a sellof in alts. Actually, there was some buys (the ALTBTC price increased); it just it was not enough to counteract the btc fall.
That can be clearly seen in the remarked candle in the plot, the "coronavirus" sellof. The BTCUSD fall was huge (the hugest in BTC history), and the green column is telling you that to preserve the capitalization a lot of buys were required. However, that didn't happen. Actually, the OTHER alts were pretty quiet (the red column is tiny), causing a massive indirect loss of capitalization.
Also, with the curves, you can know if there was a total gainning or loss of capitalization during the past few days or candles. Also you can try to spot the beginning of alts seasons by crosses between red and green lines: if the red lines crosses above the green one (because there was a continuous sequence of red columns above green ones), it means that, potentially, were are at the beginning of an alt season because people are accumulating.
Table of cases
===========
- if the green column is positive (BTCUSD is down)
- if the red column is positive (ALTBTC is up)
- bigger than the green column: ALTBTC buys are stronger than required by arbitrage and have counteracted and overcome the BTC fall.
- shorter than the green column: there have been some buys but not enough, so the BTCUSD fall has not been fully counteracted.
- if the red column is negative (ALTBTC is down): the loss is double: BTCUSD have lost value + ALTBTC is bleeding.
- If the green column is negative (BTCUSD is up)
- if the red column is negative (ALTBTC is down)
- bigger than the green column: ALTBTC sells are so strong that have counteracted the BTC increase in value, causing a loss of USD value.
- shorter than the green column: there have been sells but overall the ALTUSD price has increased.
- if the red column is positive (ALTBTC is up): the gain is double: BTCUSD has gain value + ALTBTC is also growing.
Stochastic BTC OptimizedEnhanced Stochastic for Bitcoin (BTC) – Optimized for Daily Timeframe
This enhanced Stochastic oscillator is specifically fine-tuned for BTC/USD on the 1D timeframe, leveraging historical data from Bitstamp (2011–2025) to minimize false signals and maximize reliability in Bitcoin's volatile swings.
Unlike the classic Stochastic (14, 3, 3), this version uses optimized parameters:
- K Period = 21 – smoother reaction, better suited for BTC’s macro cycles
- D Period = 3, Smooth K = 3 – reduces noise while preserving responsiveness
- Overbought = 85, Oversold = 15 – accounts for BTC’s tendency to trend strongly within extreme zones without immediate reversal
✅ Smart Signal Logic:
Buy/sell signals appear only when %K crosses %D inside the oversold (≤15) or overbought (≥85) zones, and only the first signal is shown to avoid whipsaws.
Visual Enhancements:
- Thick lines when %K/%D are in overbought/oversold zones
- Green/red background highlights on valid signals
- Optional up/down arrows for clear entry visualization
- Customizable colors, line widths, and transparency
🔒 No alerts included – clean, focused on price action and momentum.
💡 Pro Tip: For even higher accuracy, use this indicator in combination with a long-term trend filter (e.g., EMA 200). The oscillator excels in ranging or retracement phases but should not be used alone in strong parabolic moves.
Based on Mozilla Public License v2.0 – feel free to use, modify, and share. Perfect for swing traders and long-term Bitcoin analysts seeking high-probability reversal zones.
перевод на русский
Улучшенный Stochastic для Bitcoin (BTC) — оптимизирован для дневного таймфрейма
Этот улучшенный осциллятор Stochastic специально настроен под BTC/USD на дневном графике, с учётом исторических данных Bitstamp (2011–2025), чтобы минимизировать ложные сигналы и повысить надёжность в условиях высокой волатильности биткоина.
В отличие от классического Stochastic (14, 3, 3), эта версия использует оптимизированные параметры:
- Период K = 21 — более плавная реакция, лучше соответствует макроциклам BTC
- Период D = 3, Сглаживание K = 3 — снижает шум, сохраняя отзывчивость
- Уровень перекупленности = 85, перепроданности = 15 — учитывает склонность BTC к сильным трендам в экстремальных зонах без немедленного разворота
✅ Интеллектуальная логика сигналов:
Покупка/продажа отображается только при пересечении %K и %D внутри зоны перепроданности (≤15) или перекупленности (≥85), и только первый сигнал фиксируется, чтобы избежать «хлыстов».
Улучшенная визуализация:
- Жирные линии, когда %K/%D находятся в экстремальных зонах
- Зелёный/красный фон при появлении сигналов
- Опциональные стрелки для чёткого отображения точек входа
- Настройка цветов, толщины линий и прозрачности
🔒 Без алертов — чистый инструмент, сфокусированный на цене и импульсе.
💡 Совет профессионала: для ещё большей точности используйте этот индикатор вместе с трендовым фильтром (например, EMA 200). Осциллятор лучше всего работает в фазах консолидации или отката, но не стоит применять его в одиночку во время сильных параболических движений.
На основе Mozilla Public License v2.0 — свободно используйте, модифицируйте и делитесь. Идеален для свинг-трейдеров и аналитиков Bitcoin, ищущих зоны с высокой вероятностью разворота.

Dual Harmonic-based AHR DCA (Default :BTC-ETH)A panel indicator designed for dual-asset BTC/ETH DCA (Dollar Cost Averaging) decisions.
It is inspired by the Chinese community indicator "AHR999" proposed by “Jiushen”.
How to use:
Lower HM-based AHR → cheaper (potential buy zone).
Higher HM-based AHR → more expensive (potential risk zone).
Higher than Risk Threshold → consider to sell, but not suitable for DCA.
When both AHR lines are below the Risk threshold → buy the cheaper one (or split if similar).
If one AHR is above Risk → buy the other asset.
If both are above Risk → simulation shows “STOP (both risk)”.
Not limited to BTC/ETH — you can freely change symbols in the input panel
to build any dual-asset DCA pair you want (e.g., BTC/BNB, ETH/SOL, etc.).
What you’ll see:
Two lines: AHR BTC (HM) and AHR ETH (HM)
Two dashed lines: OppThreshold (green) and RiskThreshold (red)
Colored fill showing which asset is cheaper (BTC or ETH)
Buy markers:
- B = Buy BTC
- E = Buy ETH
- D = Dual (split budget)
Top-right table: prices, AHRs, thresholds, qOpp/qRisk%, simulation, P&L
Labels showing last-bar AHR values
Core idea:
Use an AHR based on Harmonic Moving Average (HM) — a ratio that measures how “cheap or expensive” price is relative to both its short-term mean and long-term trend.
The original AHR999 used SMA and was designed for BTC only.
This indicator extends it with cross-exchange percentile mapping, allowing the empirical “opportunity/risk” zones of the AHR999 (on Bitstamp) to adapt automatically to the current market pair.
The indicator derives two adaptive thresholds:
OppThreshold – opportunity zone
RiskThreshold – risk zone
These thresholds are compared with the current HM-based AHR of BTC and ETH to decide which asset is cheaper, and whether it is good to DCA or not, or considering to sell(When it in risk area).
This version uses
Display base: Binance (default: perpetual) with HM-based AHR
Percentile base: Bitstamp spot SMA-AHR (complete, stable history)
Rolling window: 2920 daily bars (~8 years) for percentile tracking
Concept summary
AHR measures the ratio of price to its long-term regression and short-term mean.
HM replaces SMA to better reflect equal-fiat-cost DCA behavior.
Cross-exchange percentile mapping (Bitstamp → Binance) keeps thresholds consistent with the original AHR999 interpretation.
Recommended settings (1D):
DCA length (harmonic): 200
Log-regression lookback: 1825 (≈5 years)
Rolling window: 2920 (≈8 years)
Reference thresholds: 0.45 / 1.20 (AHR999 empirical priors)
Tie split tolerance (ΔAHR): 0.05
Daily budget: 15 USDT (simulation)
All display options can be toggled: table, markers, labels, etc.
Notes:
When the rolling window is filled (2920 bars by default), thresholds are first calculated and then visually backfilled as left-extended lines.
The “buy markers” and “decision table” are light simulations without fees or funding costs — for rhythm and relative analysis, not backtesting.

BitCoin RSI TrendWhat is it?
This indicator will plot the RSI of BTC with a red or green background based on the top and bottom values which you can set.
How to use it?
For example, you want to trade only if the RSI of BTC is between 50 and 70, so the top value is 70 and bottom is 50. If the RSI value between those values the background will be green, else it will be red.
Why to use it?
The buy and sell strength of the BTC controls the other coins, and it is noticeable when the BTC is over sold and the RSI exceeding the 70, the price will reverse its movement to down, thus it is advisable to not open long position if the RSI of BTC is above the 70-75. Also, if the RSI is under 50 there is a big possibility to move down further to the over bought areas. The best is to buy a altcoins when the BTC RSI is between 50 and 70.
For example, I could avoid a bad long trade on MATICUSDT when the RSI of BTC is going under 50
Or, get a good long trade on MATICUSDT when the RSI of BTC is between 50 and 70

R19 STRATEGYHello again.
Let me introduce you R19 Strategy I wrote for mostly BTC long/short signals
This is an upgrated version of STRATEGY R18 F BTC strategy.
I checked this strategy on different timeframes and different assest and found it very usefull for BTC 1 Hour and 5 minutes chart.
Strategy is basically takes BTC/USDT as a main indicator, so you can apply this strategy to all cryptocurrencies as they mostly acts accordingly with BTC itself (Of course you can change main indicator to different assets if you think that there is a positive corelation with. i.e. for BTC signals you can sellect DXY index for main indicator to act for BTC long/short signals)
Default variables of the inticator is calibrated to BTC/USDT 5 minute chart. I gained above %77 success.
Strategy simply uses, ADX, MACD, SMA, Fibo, RSI combination and opens positions accordingly. Timeframe variable is very important that, strategy decides according the timeframe you've sellected but acts within the timeframe in the chart. For example, if you're on the 5 minutes chart, but you've selected 1 hour for the time frame variable, strategy looks for 1 hour MACD crossover for opening a position, but this happens in 5 minutes candle, It acts quickly and opens the position.
Strategy also uses a trailing stop loss feature. You can determine max stoploss, at which point trailing starts and at which distance trailing follows. The green and red lines will show your stoploss levels according to the position strategy enters (green for long, red for short stop loss levels). When price exceeds to the certaing levels of success, stop loss goes with the profitable price (this means, when strategy opens a position, you can put your stop loss to the green/red line in actual trading)
You can fine tune strategy to all assets.
Please write down your comments if you get more successfull about different time zones and different assets. And please tell me your fine tuning levels of this strategy as well.
See you all.

Aggregated Volume Colored (Bitcoin, ETH, Altcoins, everything)BITSTAMP:BTCUSD
This indicator aggregates trading volume data of up to 10 symbols and can display the individual data by color.
It is useful for assets which are traded on multiple exchanges, like cryptocurrencies, commodities, forex and derivatives showing you what is happening across the market and on the individual exchanges to give you beter insights.
You can change the symbols from which the indicator gathers data in the settings under inputs, just like the colors, and you can add a moving average.
By default trading volume is aggregated from the following symbols:
Binance, BTC /USDT
Binance, BTC /BUSD
Bingbon, BTC /USD
Huobi, BTC /USDT
OkeX, BTC /USDT
Coinbase, BTC /USD
Bitfinex, BTC /USD
Gemini, BTC /USD
Kraken, XBT/USD
Bitstamp, BTC /USD

Aggregated VolumeBITSTAMP:BTCUSD
This indicator aggregates trading volume data of assets which are traded on multiple exchanges (like cryptocurrencies, commodities, forex and derivatives) to give you better insights on the markets.
You can change the markets from which the indicator gathers data in the settings under inputs.
By default, data is aggregated from the following markets:
Binance, BTC /USDT
Binance, BTC /BUSD
Bitfinex, BTC /USD
Coinbase, BTC /USD
Bingbon, BTC /USD
Bitstamp , BTC /USD
Kraken, XBT/USD
Gemini, BTC /USD
OkeX, BTC /USDT
Huobi, BTC /USDT
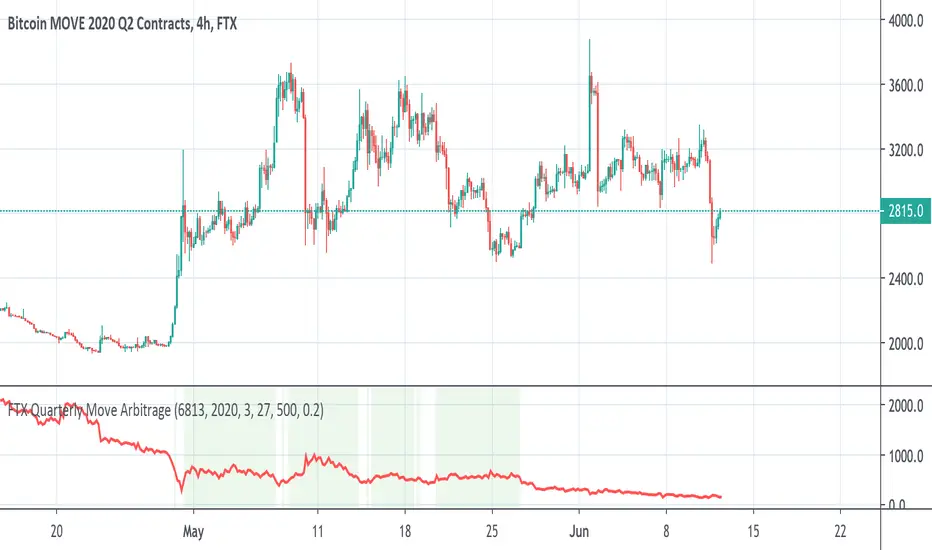
FTX BTC Quarterly Move ArbitrageThis script is for arbitraging BTC's volatility on FTX.
We use 3 factors to detect the best timing for arbitraging:
1. BTC Quarterly Move current price
2. BTC Quarterly Move strike price
3. BTC current price
When green background appears, long BTC and short BTC move.
When red background appears, short BTC and short BTC move.
Bollinger ALTswap Alert v1.0 (MA28 Rotation ALT↔BTC)Inspired by: Bollinger Awesome Alert R1 by JustUncleL
What is it?
BBALTSWAP overlays Bollinger Bands (20, 2), a 3-EMA, and a Rotation MA (default 28), then gives state-change alerts to rotate between ALT ↔ BTC on any ALT/BTC chart.
Core rotation rule
• Rotate → ALT when close > Bollinger middle and close > MA28.
• Rotate → BTC when close < Bollinger middle and close < MA28.
• Otherwise: Wait (no rotation).
Labels only print when the state changes (to avoid spam). You can also compute the rotation on a higher timeframe (default 4h) while viewing a lower one (e.g., 1h).
Optional extras
• Breakout arrows (scalping-style) when 3-EMA crosses the Bollinger middle with an Awesome Oscillator direction filter.
• Bollinger Squeeze coloring (relative width) to highlight expansion/contraction.
• Min bars between labels to throttle how often rotation labels appear.
Inputs (highlights)
• Use EMA for Bollinger / Rotation MA
• Bollinger length & multiplier
• AO fast/slow lengths
• Higher-timeframe selector for rotation (default 240 = 4h)
• Show breakout arrows / show “Wait” / min bars between labels
How to use (simple playbook)
1. Chart: open your ALT/BTC pair (e.g., ETHBTC).
2. Direction: leave rotation HTF at 4h for steadier signals.
3. Execution: take rotations on bar close; manage entries on your lower TF (1h/15m) if desired.
4. Override check (optional): when BTCUSDT is in a fresh breakout, prefer BTC even if ALT flashes briefly.
Alerts
Add two alerts, Once per bar close:
• “Rotate to ALT (state change)”
• “Rotate to BTC (state change)”
Notes
• Works on any ALT/BTC pair.
• The breakout arrows are optional and independent from the rotation signals.
• This tool is educational; not financial advice.

COIN/BTC Trend OscillatorThe COIN/BTC Trend Oscillator is a versatile tool designed to measure and visualize momentum divergences between Coinbase stock ( NASDAQ:COIN ) and Bitcoin ( CRYPTOCAP:BTC ). It helps identify overbought and oversold conditions, while also highlighting potential trend reversals.
Key Features:
VWAP-Based Divergence Analysis:
• Tracks the difference between NASDAQ:COIN and CRYPTOCAP:BTC relative to their respective VWAPs.
• Highlights shifts in momentum between the two assets.
Normalized Oscillator:
• Uses ATR normalization to adapt to different volatility conditions.
• Displays momentum shifts on a standardized scale for better comparability.
Overbought and Oversold Conditions:
• Identifies extremes using customizable thresholds (default: ±80).
• Dynamic background colors for quick visual identification:
• Blue for overbought zones (potential sell).
• White for oversold zones (potential buy).
Rolling Highs and Lows Detection:
• Tracks turning points in the oscillator to identify possible trend reversals.
• Useful for spotting exhaustion or accumulation phases.
Use Case:
This indicator is ideal for trading Coinbase stock relative to Bitcoin’s momentum. It’s especially useful during strong market trends, helping traders time entries and exits based on extremes in relative performance.
Limitations:
• Performance may degrade in choppy or sideways markets.
• Assumes a strong correlation between NASDAQ:COIN and CRYPTOCAP:BTC , which may not hold during independent events.
Pro Tip: Use this oscillator with broader trend confirmation tools like moving averages or RSI to improve reliability. For macro strategies, consider combining with higher timeframes for alignment.
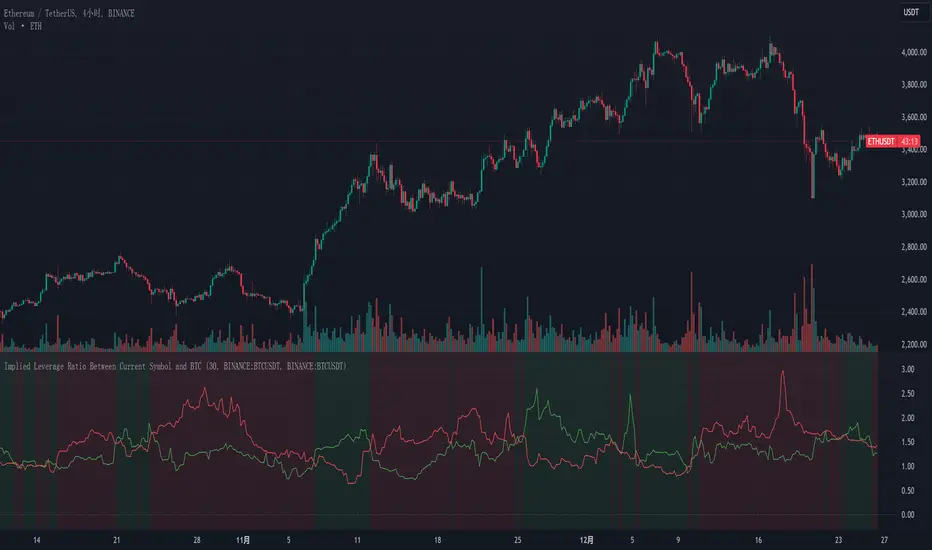
Implied Leverage Ratio Between Current Symbol and BTCThis script calculates and visualizes the implied leverage ratio between the current symbol and Bitcoin (BTC). The implied leverage ratio is computed by comparing the cumulative price changes of the two symbols over a defined number of candles. The results provide insights into how the current symbol performs relative to BTC in terms of bullish (upward) and bearish (downward) movements.
Features
Cumulative Up and Down Ratios:
The script calculates the cumulative price increase (up) and decrease (down) ratios for both the current symbol and BTC. These ratios are based on the percentage changes relative to each candle's opening price.
Implied Leverage Ratio:
For bullish movements, the cumulative up ratio of the current symbol is divided by BTC's cumulative up ratio.
For bearish movements, the cumulative down ratio of the current symbol is divided by BTC's cumulative down ratio.
These values reflect the implied leverage of the current symbol relative to BTC in both directions.
Customizable Comparison Symbol:
By default, the script compares the current symbol to BINANCE:BTCUSDT. However, you can specify any other symbol to tailor the analysis.
Interactive Visualization:
Green Line: Represents the ratio of cumulative up movements (current symbol vs. BTC).
Red Line: Represents the ratio of cumulative down movements (current symbol vs. BTC).
A horizontal zero line is included for reference, ensuring the chart always starts from zero.
How to Use
Add this script to your chart from the Pine Editor or the public library.
Customize the number of candles (t) to define the period over which cumulative changes are calculated.
If desired, replace the comparison symbol with another asset in the input settings.
Analyze the green and red lines to identify relative strength and implied leverage trends.
Who Can Benefit
Traders and Analysts: Gain insights into the relative performance of altcoins, stocks, or other instruments against BTC.
Leverage Seekers: Identify assets with higher or lower implied leverage compared to Bitcoin.
Market Comparisons: Understand how various assets react to market movements relative to BTC.
This tool is particularly useful for identifying potential outperformers or underperformers relative to Bitcoin and can guide strategic decisions in trading pairs or market analysis.
MoonFlag BTC Daily Swing PredictorThis script mainly works on BTC on the daily timeframe. Other coins also show similar usefulness with this script however, BTC on the daily timeframe is the main design for this script.
(Please note this is not trading advice this is just comments about how this indicator works.)
This script is predictive. It colors the background yellow when the script calculates a large BTC swing is potentially about to happen. It does not predict in which direction the swing will occur but it leads the price action so can be useful for leveraged trades. When the background gets colored with vertical yellow lines - this shows that a largish price swing is probably going to occur.
The scripts also shades bands around the price action that are used to estimate an acceptable volatility at any given time. If the bands are wide that means price action is volatile and large swings are not easily predicted. Over time, with reducing volatility, these price action bands narrow and then at a set point or percentage (%) which can be set in the script settings, the background gets colored yellow. This indicates present price action is not volatile and a large price swing is potentially going to happen in the near future. When price action breaks through the narrowing bands, the background is no longer presented because this is seen as an increase in volatility and a considerable portion of the time, a large sudden drop in price action or momentous gain in price is realized.
This indicator leads price action. It predicts that a swing is possibly going to happen in the near future. As the indicator works on the BTC daily, this means on a day-to-day basis if the bands continually narrow - a breakout is more likely to happen. In order to see how well this indicator works, have a look at the results on the screenshot provided. Note the regions where vertical yellow lines are present on the price action - and then look after these to see if a sizeable swing in price has occurred.
To use this indicator - wait until yellow vertical lines are presented on the BTC daily. Then use your experience to determine which way the price action might swing and consider entering a trade or leveraged trade in this direction. Alternatively wait a while to see in which direction the break-out occurs and considering and attempt to trade with this. Sometimes swings can be unexpected and breakout in one direction before then swinging much larger in the other. Its important to remember/consider that this indicator works on the BTC daily timeframe, so any consideration of entering a trade should be expected to cover a duration over many days or weeks, or possibly months. A large swing is only estimated every several plus months.
Most indicators are based on moving averages. A moving average is not predictive in the sense in that it lags price actions. This indicator creates bands that are based on the momentum of the price action. A change in momentum of price action therefore causes the bands to widen. When the bands narrow this means that the momentum of the price action is steady and price action volatility has converged/reduced over time. With BTC this generally means that a large swing in price action is going to occur as momentum in price action then pick-up again in one direction or another. Trying to view this using moving averages is not easy as a moving average lags price action which means that it is difficult to predict any sudden movements in price action ahead of when they might occur. Although, moving averages will converge over time in a similar manner as the bands calculated by this script. This script however, uses the price action momentum in a predictive manner to estimate where the price action might go based on present price momentum. This script therefore reacts to reduced volatility in price action much faster than a set of moving averages over various timescales can achieve.
MoonFlag

Optimized Logarithmic Curve for Bitcoin (BTC/USD) by FICASHello everyone!
I'd like to share with you a handy tool that is incredibly useful for analyzing Bitcoin's price movements. This optimized logarithmic curve indicator is a refined version of the popular "My BTC log curve" indicator, originally created by @quantadelic.
We have made several improvements to enhance its predictive capabilities when it comes to identifying potential price bottoms for Bitcoin BTC/USD.
Description:
In this detailed analysis, we are excited to introduce you to an optimized version of the popular "My BTC log curve" indicator, originally created by @quantadelic. We have refined the indicator for enhanced predictive capabilities when it comes to identifying potential price bottoms for Bitcoin BTC/USD. By putting ourselves in the reader's shoes, we aim to provide a comprehensive and meaningful explanation of our analysis and predictions using this improved tool.
The logarithmic curve is a powerful tool for analyzing price movements in a non-linear fashion, allowing traders and investors to identify critical turning points and trends. With the optimized logarithmic curve, we can more accurately predict potential price bottoms, ultimately guiding better-informed trading and investment decisions.
Key Features of the Optimized Logarithmic Curve:
Improved predictive capabilities: The refined logarithmic curve has been optimized to provide more accurate predictions of potential price bottoms, enabling traders to make better-informed decisions.
Enhanced visualization: The optimized curve offers a clearer visual representation of Bitcoin's price movements, making it easier for traders to identify patterns and trends.
Adaptability: This indicator can be applied to various timeframes, providing insights for both short-term and long-term traders.
The optimized logarithmic curve indicator is based on a logarithmic regression of the USD price of Bitcoin, calculated according to the equation:
y = A * exp(beta * x^lambda + c) + m * x + b
where x is the number of days since the genesis block. All parameters are editable in the script options, allowing traders to customize the curve to their preferences.
Here are some of the key changes made to the original indicator to create the optimized logarithmic curve:
Midline Calculation: The optimized logarithmic curve utilizes an updated method for calculating the midline, which better represents the average price movement of Bitcoin over time. This improved midline calculation provides a more accurate representation of Bitcoin's historical price trajectory, making it easier to identify potential price bottoms.
Cross Line Calculation: We have modified the way cross lines are calculated in the optimized logarithmic curve. These new cross lines are derived from a combination of the updated midline calculation and historical support and resistance levels. This change allows traders to more accurately identify critical points in the market where price action is likely to reverse or continue its trend.
Table Display: a powerful visualization tool designed to provide a comprehensive overview of the relationships between various exponential curves and the Bitcoin price. This table display, integrated into the "FiCAS BTC log curve" indicator, enables traders and analysts to quickly compare and assess the impact of these curves on the market.
Our analysis using the optimized logarithmic curve suggests that Bitcoin might be at a critical price bottom, indicating that selling at this point may not be the most prudent course of action. Instead, traders and investors could consider taking advantage of the potential upswing as the market moves away from the identified price bottom.
Key highlights of this Optimized Logarithmic Curve for Bitcoin (BTC/USD) by FICAS:
Custom Pine Script: Pinescript code serves as the backbone of this strategy, providing a strong foundation for identifying potential opportunities based on the relationships between exponential curves and Bitcoin price.
MACD Indicator: The Moving Average Convergence Divergence (MACD) is integrated to help traders recognize trend reversals, bullish or bearish market conditions, and potential entry or exit points.
Momentum Indicator: By incorporating the Momentum (10, close) indicator, traders can identify the strength of price movements and potential trend continuations or reversals.
RSI and SMA: The Relative Strength Index (RSI) is used to assess overbought or oversold conditions, while the Simple Moving Average (SMA) with a period of 14 and an applied factor of 2 smoothens the data for better trend identification.
IMPORTANT:
While this indicator can be applied to traditional BTC/USD charts, we highly recommend using it on the following chart for optimal results in identifying price bottoms:
BITSTAMP:BTCUSD / CRYPTOCAP:BTC.D * 100
By employing the optimized logarithmic curve indicator on the recommended chart, traders can gain a more accurate perspective on potential price bottoms, leading to improved decision-making.
In conclusion, the optimized logarithmic curve indicator provides valuable insights into Bitcoin's price movements, allowing traders and investors to make more informed decisions. We encourage you to test this refined tool and share your thoughts in the comments section. Special thanks to @quantadelic, the first creator of this indicator, for inspiring us to develop this optimized version. If you have any questions or require further clarification, please feel free to ask. Wishing you success in your trading and investment endeavors!
Please ensure you understand and abide by the TradingView House Rules when using this indicator: www.tradingview.com
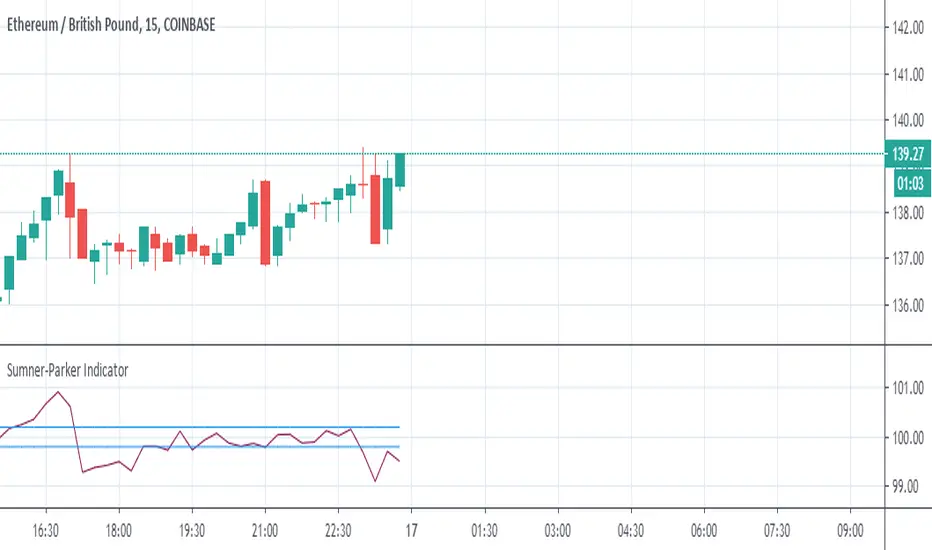
Sumner-Parker Indicator (Over/Under Priced BTC or ETH)This is to be used when trading between ETH/GBP, BTC/GBP and ETH/BTC .
It compares ETH/GBP and BTC/GBP with each other to determine if the ETH/BTC price matches.
From it you can predetermine whether the value of the asset you are watching is overpriced or underpriced and therefore predict the candle to follow.
When watching ETH:
If the value is high, the value of BTC is too high and ETH should raise to match in the next bar and vice versa.
When watching BTC:
If the value is high, the value of BTC is too high and should drop on the next bar and vice versa.
The Upper and Lowers are set at double the percentage fees on the exchange you use. This just helps in recognising beneficial trades.