Multi-Timeframe TrendBelow is a PineScript that calculates the trend for multiple timeframes (5 minutes, 15 minutes, 1 hour, 4 hours, and daily) using the Relative Strength Index (RSI) and Moving Averages (MA) to determine bullish, bearish, or neutral trends. The script displays the trend information on the TradingView chart using a table.
Buscar en scripts para "恒生指数期货+cfd"
RSI Zones - Directional Entry Strict RSI Zones – Directional Entry Tool (Modified RSI)
This is a simple modification of the standard RSI indicator. I’ve added two custom horizontal lines at the 60–65 and 35–40 zones to help spot momentum shifts and potential reversal points.
60–65 zone: When RSI returns here from above 65, it often signals weakening bullish momentum — useful for spotting short opportunities.
35–40 zone: When RSI returns here from below 35, it can indicate momentum loss on the downside — good for potential long setups.
This version helps traders filter out weak signals and avoid chasing extreme moves.
It works best when combined with price action, structure, or divergence.
Only 2 lines were added to the default RSI for better zone awareness. Everything else remains unchanged.

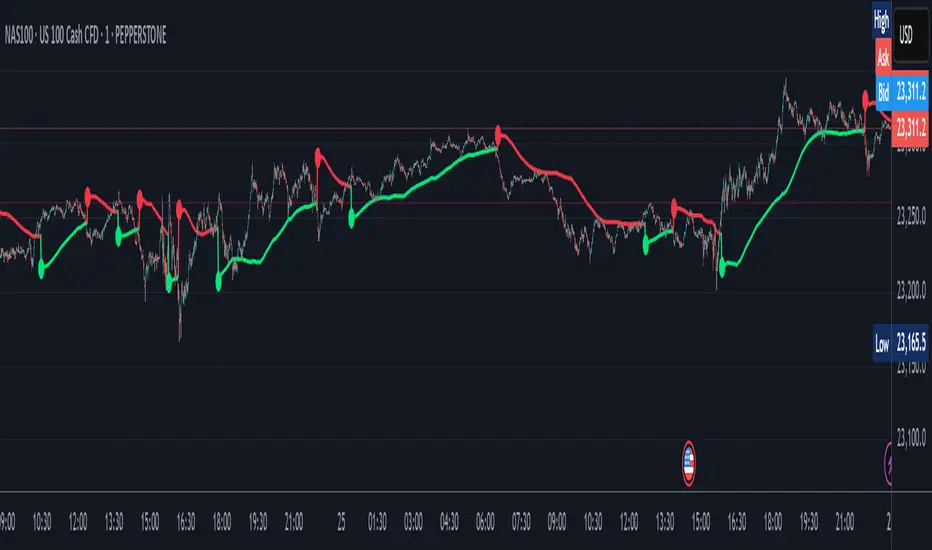
Corys Buy and SellThe Cory’s Buy and Sell indicator is an advanced, all-in-one trading toolkit that combines dynamic trend detection, volatility breakout alerts, and visual EMA strength to help traders confidently identify high-probability buy and sell opportunities.
🔍 Key Features:
Adaptive Supertrend Engine
Powered by a modified Keltner Channel, this trend-following algorithm generates timely BUY 🚀 and SELL 😡 signals based on market momentum and volatility, with adjustable sensitivity and factor settings for full control.
EMA Energy Bands (Optional)
A cascade of 15 EMAs (from 9 to 51 periods) visually maps market energy. Colours shift from green (bullish) to red (bearish), showing short- to medium-term trend strength at a glance.
Trend Catcher Overlay
Highlights major shifts in trend using a fast/slow EMA crossover (10 vs 20 EMA). Bars are coloured to reflect bullish reversals for added confidence.
Pullback Signal Detection
Identifies bullish pullback opportunities when price reclaims key EMA levels after a crossover, marked with a green triangle for entry timing.
Built-in Range Detection System
Automatically highlights price consolidation zones using ATR-based logic. When price breaks above or below the detected range, the zone changes colour (green for breakout up, red for breakdown), helping traders spot breakout opportunities.
Smart Labels & Alerts
Instant BUY/SELL labels on the chart and built-in alert conditions make this indicator suitable for both discretionary and automated trading strategies.
⚙️ Customisable Inputs:
Sensitivity (for trend signals)
EMA Energy toggle
Keltner & ATR Lengths
Range Detection parameters and styling
Best For: Trend traders, breakout traders, and swing traders looking for a clean, powerful overlay that combines momentum, structure, and volatility in one tool.

JHW Volume Based Buy and Sell MomentumThe JHW Volume-Based Buy and Sell Momentum indicator is a custom momentum oscillator designed to capture market sentiment based on volume dynamics and price rate of change (ROC). It aims to identify bullish or bearish momentum by analyzing how price reacts to increasing or decreasing trading volume.
Core Logic:
The indicator calculates the Rate of Change (ROC) of the closing price.
It then accumulates this ROC separately based on whether the current volume is lower or higher than the previous bar:
If volume decreases, the ROC is added to a "negative volume index" accumulator.
If volume increases, the ROC is added to a "positive volume index" accumulator.
These two accumulators are combined to form a net momentum line.
Smoothing:
A Simple Moving Average (SMA) is applied to both accumulators over a user-defined period (default: 25 bars).
The sum of these smoothed values forms the signal line.
Visualization:
The indicator plots:
The net momentum line (yellow).
The smoothed signal line (blue).
The area between the two lines is filled with color:
Yellow when momentum is above the signal (bullish).
Blue when momentum is below the signal (bearish).
Bar colors are also adjusted to reflect the current momentum state.
Use Case:
This indicator helps traders:
Detect volume-driven momentum shifts.
Identify potential buy or sell zones based on volume behavior.
Confirm trends or spot early reversals.

多维度市场分析指标 v2 (区间框选)使用大周期MACD的能量柱作为背景用于识别趋势并且搭配上伦敦和纽约交易session
we are using a high time frame macd momentum as chart background to analysis a trend and using london and newyork session to help you trade better

Trigonometric StochasticTrigonometric Stochastic - Mathematical Smoothing Oscillator
Overview
A revolutionary approach to stochastic oscillation using sine wave mathematical smoothing. This indicator transforms traditional stochastic calculations through trigonometric functions, creating an ultra-smooth oscillator that reduces noise while maintaining sensitivity to price changes.
Mathematical Foundation
Unlike standard stochastic oscillators, this version applies sine wave smoothing:
• Raw Stochastic: (close - lowest_low) / (highest_high - lowest_low) × 100
• Trigonometric Smoothing: 50 + 50 × sin(2π × raw_stochastic / 100)
• Result: Naturally smooth oscillator with mathematical precision
Key Features
Advanced Smoothing Technology
• Sine Wave Filter: Eliminates choppy movements while preserving signal integrity
• Natural Boundaries: Mathematically constrained between 0-100
• Reduced False Signals: Trigonometric smoothing filters market noise effectively
Traditional Stochastic Levels
• Overbought Zone: 80 level (dashed line)
• Oversold Zone: 20 level (dashed line)
• Midline: 50 level (dotted line) - equilibrium point
• Visual Clarity: Clean oscillator panel with clear level markings
Smart Signal Generation
• Anti-Repaint Logic: Uses confirmed previous bar values
• Buy Signals: Generated when crossing above 30 from oversold territory
• Sell Signals: Generated when crossing below 70 from overbought territory
• Crossover Detection: Precise entry/exit timing
Professional Presentation
• Separate Panel: Dedicated oscillator window (overlay=false)
• Price Format: Formatted as price indicator with 2-decimal precision
• Theme Adaptive: Automatically matches your chart color scheme
Parameters
• Cycle Length (5-200): Period for highest/lowest calculations
- Shorter periods = more sensitive, more signals
- Longer periods = smoother, fewer but stronger signals
Trading Applications
Momentum Analysis
• Overbought/Oversold: Clear visual identification of extreme levels
• Momentum Shifts: Early detection of momentum changes
• Trend Strength: Monitor oscillator position relative to midline
Signal Trading
• Long Entries: Buy when crossing above 30 (oversold bounce)
• Short Entries: Sell when crossing below 70 (overbought rejection)
• Confirmation Tool: Use with trend indicators for higher probability trades
Divergence Detection
• Bullish Divergence: Price makes lower lows, oscillator makes higher lows
• Bearish Divergence: Price makes higher highs, oscillator makes lower highs
• Early Warning: Spot potential trend reversals before they occur
Trading Strategies
Scalping (5-15min timeframes)
• Use cycle length 10-14 for quick signals
• Focus on 20/80 level bounces
• Combine with price action confirmation
Swing Trading (1H-4H timeframes)
• Use cycle length 20-30 for reliable signals
• Wait for clear crossovers with momentum
• Monitor divergences for reversal setups
Position Trading (Daily+ timeframes)
• Use cycle length 50+ for major signals
• Focus on extreme readings (below 10, above 90)
• Combine with fundamental analysis
Advantages Over Standard Stochastic
1. Smoother Action: Sine wave smoothing reduces whipsaws
2. Mathematical Precision: Trigonometric functions provide consistent behavior
3. Maintained Sensitivity: Smoothing doesn't compromise signal quality
4. Reduced Noise: Cleaner signals in volatile markets
5. Visual Appeal: More aesthetically pleasing oscillator movement
Best Practices
• Market Context: Consider overall trend direction
• Multiple Timeframe: Confirm signals on higher timeframes
• Risk Management: Always use proper position sizing
• Backtesting: Test parameters on your preferred instruments
• Combination: Works excellently with trend-following indicators
Built-in Alerts
• Buy Alert: Trigonometric stochastic oversold crossover
• Sell Alert: Trigonometric stochastic overbought crossunder
Technical Specifications
• Pine Script Version: v6
• Panel: Separate oscillator window
• Format: Price indicator with 2-decimal precision
• Performance: Optimized for all timeframes
• Compatibility: Works with all instruments
Free and open-source indicator. Modify, improve, and share with the community!
Educational Value: Perfect for traders wanting to understand how mathematical smoothing improves oscillators and trigonometric applications in technical analysis.

Trigonometric Sine Cosine WavesTrigonometric Sine Cosine Waves - Advanced Cyclical Analysis
Overview
This innovative indicator applies trigonometric mathematics to market analysis, generating dynamic sine and cosine waves that adapt to price movement and volatility. Unlike traditional oscillators, this tool visualizes market cycles directly on your chart using mathematical wave functions.
How It Works
The indicator calculates phase-based waves using:
• Phase Calculation: 2π × bar_index / cycle_length
• Adaptive Amplitude: EMA-based price + ATR volatility scaling
• Sine Wave: avgPrice + volatility × sin(phase)
• Cosine Wave: avgPrice + volatility × cos(phase)
Key Features
Dynamic Wave Generation
• Sine Wave: Primary cycle indicator with smooth transitions
• Cosine Wave: Leading indicator (90° phase difference from sine)
• Adaptive Amplitude: Automatically adjusts to market volatility using ATR
Turning Point Detection
• Anti-Repaint Signals: Uses confirmed values from previous bars
• Sine Bottom: Potential buy zones when wave transitions from down to up
• Sine Top: Potential sell zones when wave transitions from up to down
Advanced Analytics
• Price Correlation Angle: Shows relationship between price movement and cycle
• Phase Information: Current position in the mathematical cycle
• Real-time Values: Live sine/cosine values and phase degrees
Visual Enhancement
• Background Coloring: Changes based on sine wave position (above/below zero)
• Clean Overlay: Waves plot directly on price chart without cluttering
Parameters
• Cycle Length (5-200): Controls wave frequency - shorter = more sensitive
• Amplitude Multiplier (0.1-5.0): Adjusts wave height relative to volatility
• Display Options : Toggle sine wave, cosine wave, and correlation table
• Show Correlation : Optional table showing mathematical values
Trading Applications
Cycle Analysis
• Identify market rhythm and timing
• Spot potential reversal zones
• Understand price-to-cycle relationships
Entry/Exit Timing
• Buy Signals: Sine wave bottoms (cycle lows)
• Sell Signals: Sine wave tops (cycle highs)
• Confirmation: Use with other indicators for higher probability setups
Market Structure
• Visualize underlying market cycles
• Identify periods of high/low cyclical activity
• Track phase relationships between price and mathematical cycles
Pro Tips
1. Longer cycles (50-100) work better for swing trading
2. Shorter cycles (10-20) suitable for scalping
3. Combine with volume for stronger signal confirmation
4. Monitor correlation angle for trend strength assessment
5. Use background color as quick visual cycle reference
Important Notes
• Signals are anti-repaint using confirmed previous bar values
• Best used in trending or cyclical markets
• Consider market context when interpreting signals
• Mathematical approach - not based on traditional TA concepts
Alerts Included
• Sine Wave Buy Signal: Triggered on wave bottom detection
• Sine Wave Sell Signal: Triggered on wave top detection
Technical Requirements
• Pine Script v6
• Works on all timeframes
• No external dependencies
• Optimized for performance
This is a free, open-source indicator. Feel free to modify and improve according to your trading needs!
Educational Value: Perfect for understanding how mathematical functions can be applied to market analysis and cycle detection.

Zig Zag with HHLLThis powerful tool calculates and displays two Zig Zag patterns simultaneously while dynamically identifying key market structure points—Higher Highs (HH), Lower Lows (LL), Higher Lows (HL), and Lower Highs (LH).
Because the script is dynamic, the most recent HH, HL, LL, or LH can update in real-time as price action evolves. For example, if the price continues to rise, a previously marked HL may be reclassified as an LL. Likewise, a falling LH may later turn into a HH if the market reverses.
This script is versatile and can be applied to various trading strategies, including trend analysis, support and resistance identification, breakout setups, and more.
Added a new input parameter decimals that allows you to control the decimal precision:
Set to -1 (default) for automatic detection based on the symbol's minimum tick size
Set to 0-8 for a specific number of decimal places.
How it works:
Auto mode (decimals = -1): The script automatically determines how many decimal places to show based on the instrument's minimum tick size. For example:
Forex pairs (0.00001) → 5 decimals
Stocks ($0.01) → 2 decimals
Crypto (0.00000001) → 8 decimals
Manual mode (decimals = 0-8): You can force a specific number of decimal places if needed


ORB Scalp setup by UnenbatDescription
ORB Scalp Setup by Unenbat is a precise breakout scalping tool that identifies short-term price ranges at the transition between hourly sessions.
📌 Core Features:
Draws a dynamic box using the price range from the last 3 minutes of the previous hour and the first 3 minutes of the new hour (total 5m59s range).
Automatically plots:
Box representing the selected range.
Opening Price Line at the start of the hour.
TP Lines (Take Profit) above and below the box at customizable distances.
BE Lines (Break-Even) above and below the box at customizable distances.
Box and line lengths are user-defined (default: 60 minutes).
Works across historical data (up to the last 100 days).
Fully customizable visuals (colors, offsets, visibility toggles).
🎯 How to Use:
Ideal for scalp traders using breakout strategies.
Enter trades when price breaks above or below the box range.
Use TP and BE lines as clear reference levels for exits or trailing stop logic.
⚙️ Custom Settings:
Enable/disable each component (box, open line, TP line, BE line).
Set your own offset in pips for TP/BE lines.
Adjust the box duration to match your trading style.
Modify start and end times of the range as needed.

Asian & London Session Two-Color Candlesthis script use to find the asian and london session with different candle colours.

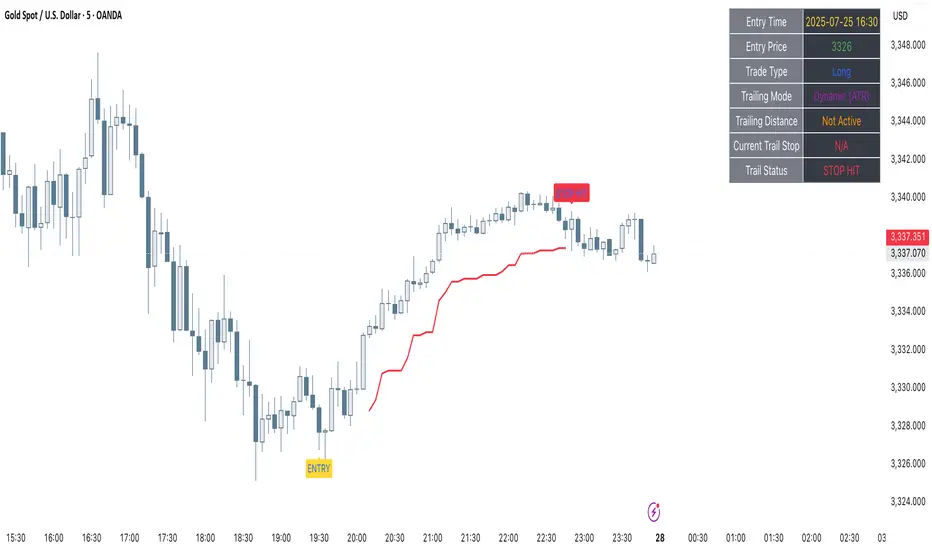
Clarix Trailing MasterClarix Trailing Master
Advanced Manual Entry Trailing Stop Strategy
Purpose :
Clarix Trailing Master is designed to give traders precise control over trade exits with a customizable trailing stop system. It combines manual entry inputs with dynamic and static trailing stop options, empowering users to protect profits while minimizing premature stop-outs.
How It Works:
You manually input your trade entry price and specify the trade direction (Long or Short).
The strategy activates the trailing stop only after the price moves favorably by a configurable profit threshold. This helps avoid early stop losses during initial market noise.
You can choose between a dynamic trailing stop based on Average True Range (ATR) or a fixed static trailing distance. The ATR can also be computed on a higher timeframe for enhanced stability.
Once active, the trailing stop updates live with price movements, ensuring your gains are locked in progressively.
If the price crosses the trailing stop, a clear alert triggers, and the stop-hit status displays visually on the chart.
Key Features:
Manual entry with exact price and timestamp input for precise trade tracking.
Supports both Long and Short trades.
Choice between dynamic ATR-based trailing or static trailing stops.
Configurable profit threshold before trailing stop activation to avoid early exits.
Visual markers for entry and stop-hit points (yellow and red respectively).
Live dashboard displaying entry details, trade status, trailing mode, and current stop level.
Works on all asset classes and timeframes, adaptable to various trading styles.
Built-in audio alert notifies you immediately when the trailing stop is hit.
Usage Tips:
Adjust the profit threshold and ATR settings based on your asset’s volatility and timeframe. For example, use higher ATR multipliers for more volatile markets like crypto.
Consider using higher timeframe ATR values for smoother trailing stops in fast-moving markets.
Ideal for swing trading or position trading where precise stop management is crucial.
Always backtest and paper trade before applying to live markets.
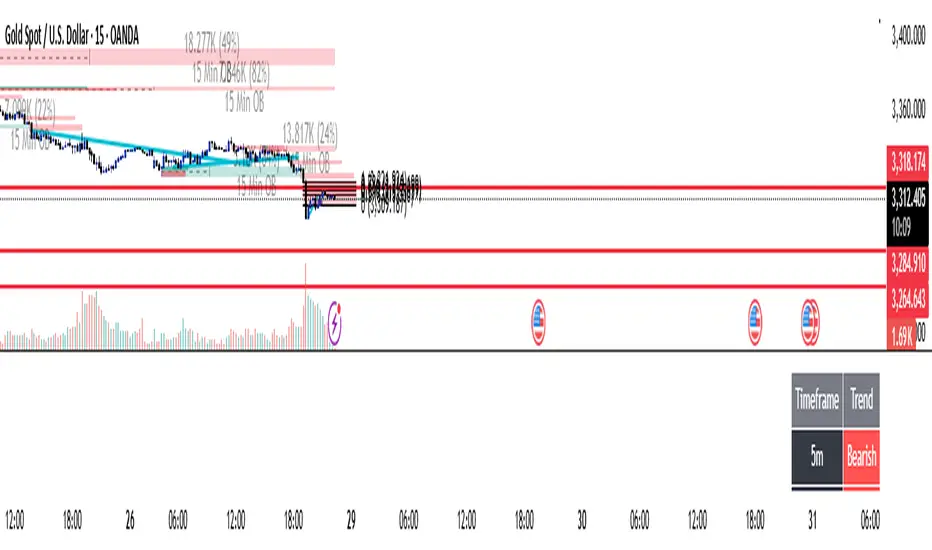
SMC XAU/USD Pro✅ Structure filter: Only BUY if the price is above the last bullish BOS, and SELL if it is below the last bearish BOS.
✅ Significant candle body: At least 40% of the range to avoid weak signals.
✅ Boxes limited to 3 per type (old ones automatically cleared).
✅ Visual display of Take Profit and Stop Loss with green and red dashed lines.
✅ Clear BUY/SELL signals with visible labels.

Volume Weighted Average Pricehelps my strategy and allows my trades to hit tp allowing me to gain profit

Refined MA + Engulfing (Strategy-Equivalent Trigger)I would like to start by saying that this indicator was put together using ChatGPT, some past trades from myself and some backtested trades, and from my time as a student in Wallstreet Academy under Cue Banks.
I am not profitable yet. I am too jumpy and blow accounts. I'm hoping this indicator (and it's strategy twin), with the help of some alerts, can help me spend less time on the charts, so that I'm not tempted to press buttons as much.
It does fire quite a bit. It can be adjusted, I believe, to trigger more or less (open the script, cooldown bars(x) <== change the X to whatever. 5 minute intervals so 1 is 5.
With that being said, there are times that this indicator has shown to trigger and I ask, "Why?".
I just want to help myself and others, and maybe make some decent\cool stuff along the way. Enjoy
KR
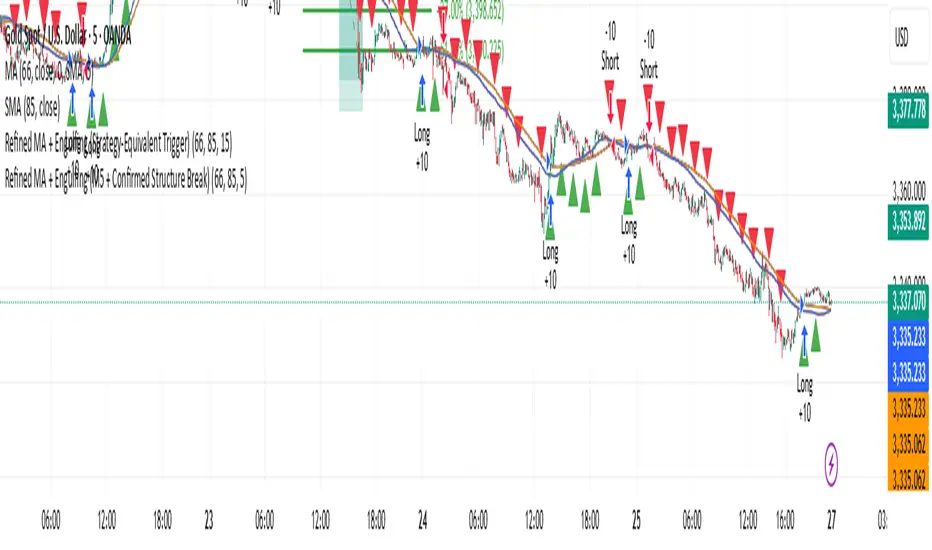
Refined MA + Engulfing (M5 + Confirmed Structure Break)I would like to start by saying that this strategy was put together using ChatGPT, some past trades from myself and some backtested trades, and from my time as a student in Wallstreet Academy under Cue Banks.
I am not profitable yet. I am too jumpy and blow accounts. I'm hoping this strategy (and it's indicator twin) can help me spend less time on the charts, so that I'm not tempted to press buttons as much.
It does fire quite a bit. But, the Strategy Tester tab shows a 30% win rate with our wins being significant to our losses. So, in theory, if you followed the rules of this strategy STRICTLY, you COULD BE profitable.
With that being said, there are times that this strategy has shown to trigger and I ask, "Why?".
I just want to help myself and others, and maybe make some decent\cool stuff along the way. Enjoy
KR

Time Range Marker By BCB ElevateThe Time Range Marker is a simple yet powerful visual tool for traders who want to focus on specific time intervals within the trading day. This indicator highlights a custom time range on your chart using a background color, helping you visually isolate key trading sessions or event windows such as:
Market open/close hours
News release periods
High-volatility trading zones
Personal strategy testing windows
⚙️ Key Features:
Customizable start and end time (hour & minute)
Works across all intraday timeframes
Adjustable highlight color to match your chart theme
Built using Pine Script v5 for speed and flexibility
🔧 Settings:
Start Hour / Minute – Set the beginning of the time range (in 24-hour format)
End Hour / Minute – Define when the range ends
Highlight Color – Choose the background color for better visibility
🕒 Timezone Note:
The indicator uses UTC time by default to ensure accuracy across markets. If your broker uses a different timezone (like EST, IST, etc.), the script can be adjusted to reflect your local market hours.
✅ How to Use the Time Range Marker Indicator
This indicator is used to visually highlight a specific time window each trading day, such as:
Market open or close sessions (e.g., NYSE, London, Tokyo)
High-impact news release periods
Custom time slots for strategy testing or scalping
🛠️ Installation Steps
Open TradingView and go to any chart.
Click on Pine Editor at the bottom of the screen.
Copy and paste the full Pine Script (shared above) into the editor.
Click the “Add to Chart” ▶️ button.
The indicator will appear on the chart with a highlighted background during the time range you set.
⚙️ How to Customize the Time Range
After adding the indicator:
Click the gear icon ⚙️ next to the indicator’s name on the chart.
Adjust the following settings:
Start Hour / Start Minute: The beginning of your time range (in 24-hour format).
End Hour / End Minute: When the highlight should stop.
Highlight Color: Pick a color and transparency for visual clarity.
Click OK to apply changes.
🕒 Timezone Consideration
By default, the indicator uses UTC (Coordinated Universal Time).
To match your broker’s timezone (e.g., EST, IST, etc.), you'll need to adjust the script by changing:
sessStart = timestamp("Etc/UTC", ...)
sessEnd = timestamp("Etc/UTC", ...)
to your correct timezone, like "Asia/Kolkata" for IST or "America/New_York" for EST.
Let me know your broker or local timezone, and I’ll update it for you.
📈 Tips for Traders
Combine this with volume, price action, or breakout indicators to focus your strategy on high-probability time windows.
Use multiple versions of this script if you want to highlight more than one time range in a day.

Sessions with timeframe filter🕒 Smart Timeframe Filtering
This session indicator includes an automatic filter that disables all session boxes when the chart timeframe is greater than the user-defined input. This helps keep higher-timeframe charts clean and focused by hiding intraday sessions when they’re no longer relevant — especially helpful for multi-timeframe traders.
🔍 Features:
📦 Draws up to 3 customizable session boxes with dynamic high/low tracking.
⏱️ Auto-disables on higher timeframes (Smart Timeframe Filter).
🌍 Fully customizable session times, box colors, and time zone (GMT-based).
⚡ Optimized for performance using lightweight, non-overlapping box logic.
👨🍳 UI is organized like a chef’s kitchen: clean, intuitive, and easy to navigate. Settings are grouped and filtered to avoid clutter.
✅ Best Use:
This indicator is most useful for intraday traders on 1m–15m charts.
It’s designed to keep your workspace clean on 30m+ charts or whatever threshold you define.

Step-OMA with SignalsThe Step-OMA with Signals is a sophisticated trend-following indicator that combines Loxx's Optimized Moving Average (OMA) algorithm with an advanced step function to create a highly responsive yet smooth trend detection system. This indicator excels at identifying trend changes early while minimizing false signals through its adaptive filtering mechanism.
Core Algorithm Components
1. Optimized Moving Average (OMA) Foundation
Based on Loxx's advanced OMA implementation
Uses a 6-stage exponential smoothing process
Incorporates adaptive period calculation based on market noise
Employs Jurik-style smoothing techniques for superior signal quality
2. Step Function Integration
Implements a step-based trend detection mechanism
Uses ATR-based dynamic threshold calculation
Maintains trend consistency through threshold memory
Provides clear trend change identification
3. Adaptive Noise Filtering
Automatically adjusts to market volatility
Calculates optimal averaging periods based on price noise
Reduces false signals in choppy market conditions
Speed (Default: 3.0, Range: -1.5 to unlimited)
This is the most critical parameter affecting indicator behavior:
Positive Speed Values (0 to 10.0+):
Creates faster, more responsive signals
Higher values increase sensitivity to recent price action
Negative Speed Values (-1.5 to -0.1):
Produces smoother, more conservative signals
Reduces noise and false breakouts
Creates delayed but more reliable trend confirmations
Adaptive (Default: True)
When enabled: Automatically adjusts averaging period based on market noise
When disabled: Uses fixed length parameter
Recommendation: Keep enabled for most market conditions
Sensitivity Factor (Default: 3.0)
Controls the threshold distance for trend change detection
Lower values: More frequent signals, higher sensitivity
Higher values: Fewer but more reliable signals
Optimal range: 2.0-5.0 depending on market volatility
Step Size Period (Default: 50)
Determines the ATR calculation period for dynamic thresholds
Affects the indicator's adaptation to volatility changes
Lower values: More reactive to recent volatility
Higher values: More stable threshold calculation
For a trading application, Step-OMA is a suitable base filter to complement other types of signaling indicators (oscillators, momentum indicators).
Disclaimer: This indicator is a technical analysis tool and should be used in conjunction with proper risk management and comprehensive market analysis. Past performance does not guarantee future results.
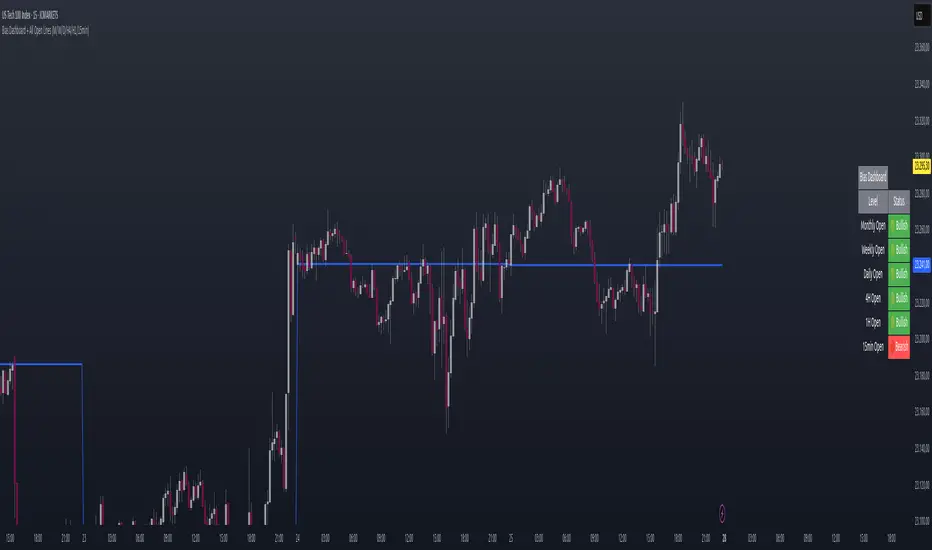
Bias Dashboard + All Open Lines (M/W/D/H4/H1/15min)What does the script do?
This script displays a dashboard that shows the current market bias relative to the open prices of multiple timeframes:
Monthly
Weekly
Daily
4H
1H
15min
Additionally, it plots horizontal lines at each of these open levels on the chart.
How it works
Fetch Open Prices:
The script uses request.security() to get the open prices for each timeframe.
Determine Bias:
Compares the current close price to each open:
If close > open, then "Bullish"
If close < open, then "Bearish"
Display Dashboard:
A visual dashboard shows:
The timeframe label
Whether the current price is above (bullish) or below (bearish) that level
Plot Lines:
Colored horizontal lines are drawn on the chart to indicate each timeframe’s open level.
S&R Zones MTF (TechnoBlooms)S&R Zones MTF – Multi-Timeframe Support & Resistance Boxes
🔍 Overview
S&R Zones MTF is a professional-grade yet beginner-friendly indicator that dynamically plots Support & Resistance zones across multiple timeframes, helping traders recognize high-probability reversal areas, entry confirmations, and price reaction points.
This tool visualizes structured zones as colored boxes, allowing both new and experienced traders to analyze multi-timeframe confluence with ease and clarity.
🧠 What Is This Indicator?
S&R Zones MTF automatically detects the most significant support and resistance levels from up to four custom timeframes, using a configurable lookback period. These zones are displayed as colored horizontal boxes directly on the chart, making it easy to:
Spot where price has historically reacted
Identify potential reversal or breakout zones
Confirm entries with institutional-style precision
🛠️ Key Features
✅ Multi-Timeframe Zone Detection (up to 4 timeframes)
📦 Auto Plotted Boxes for Support (Blue) & Resistance (Pink)
🧱 Dynamic Height based on average price range or fixed input
🏷️ Timeframe Labels to instantly identify zone origin
🎛️ Customizable inputs: Lookback length, box color, height style
🔁 Real-time updates as price structure changes
🎓 Educational & Easy to Use
Whether you’re a new trader learning about price structure, or a professional applying institutional concepts, this tool offers an educational layout to understand:
How price respects historic zones
Why multi-timeframe zones offer stronger confluence
How to use zones for entry, exit, or risk placement
📈 How to Use (Multi-Timeframe Strategy)
Select Your Timeframes – Customize up to 4 higher timeframes (e.g., 1m, 5m, 15m, 1h).
Observe Overlapping Zones – When multiple timeframes agree, those zones are more significant.
Entry Confirmation – Wait for price to reach a zone, then look for reversal patterns (engulfing candle, pin bar, etc.)
Combine with Other Tools – Use alongside indicators like RSI, MACD, or Order Blocks for added confidence.
💡 Pro Tips
Zones from higher timeframes (1H, 4H) are often more powerful and reliable.
Confluence matters: If a 15m support zone aligns with a 1H support zone — that's a high-probability reaction area.
Use break-and-retest strategies with zone rejections for sniper entries.
Enable "Auto Height" for a more adaptive, volatility-based zone display.
🌟 Summary
S&R Zones MTF blends precision, clarity, and professional analysis into a visual structure that’s easy to understand. Whether you're learning support & resistance or optimizing your MTF edge — this tool will bring clarity to your charts and confidence to your trades.

Squeeze Pro Momentum BAR color - KLTDescription:
The Squeeze Pro Momentum indicator is a powerful tool designed to detect volatility compression ("squeeze" zones) and visualize momentum shifts using a refined color-based system. This script blends the well-known concepts of Bollinger Bands and Keltner Channels with an optimized momentum engine that uses dynamic color gradients to reflect trend strength, direction, and volatility.
It’s built for traders who want early warning of potential breakouts and clearer insight into underlying market momentum.
🔍 How It Works:
📉 Squeeze Detection:
This indicator identifies "squeeze" conditions by comparing Bollinger Bands and Keltner Channels:
When Bollinger Bands are inside Keltner Channels → Squeeze is ON
When Bollinger Bands expand outside Keltner Channels → Squeeze is OFF
You’ll see squeeze zones classified as:
Wide
Normal
Narrow
Each represents varying levels of compression and breakout potential.
⚡ Momentum Engine:
Momentum is calculated using linear regression of the price's deviation from a dynamic average of highs, lows, and closes. This gives a more accurate representation of directional pressure in the market.
🧠 Smart Candle Coloring (Optimized):
The momentum color logic is inspired by machine learning principles (no hardcoded thresholds):
EMA smoothing and rate of change (ROC) are used to detect momentum acceleration.
ATR-based filters help remove noise and false signals.
Colors are dynamically assigned based on both direction and trend strength.
🧪 How to Use It:
Look for Squeeze Conditions — especially narrow squeezes, which tend to precede high-momentum breakouts.
Confirm with Momentum Color — strong colors often indicate trend continuation; fading colors may signal exhaustion.
Combine with Price Action — use this tool with support/resistance or patterns for higher probability setups.
Recommended For:
Trend Traders
Breakout Traders
Volatility Strategy Users
Anyone who wants visual clarity on trend strength
📌 Tip: This indicator works great when layered with volume and price action patterns. It is fully non-repainting and supports overlay on price charts.

KEY MARKET SESSION EU/US RANGE LEVELS - KLT🔹 KEY MARKET SESSION EU/US RANGE LEVELS - KLT
This indicator highlights critical trading levels during the European and U.S. sessions, with Overbought (OB) and Oversold (OS) markers derived from each session's price range.
It’s designed to support traders in identifying key zones of interest and historical price reactions across sessions.
✳️ Features
🕒 Session Recognition
European Session (EU): 08:00 to 14:00 UTC
United States Session (US): 14:30 to 21:00 UTC
The indicator automatically detects the current session and updates levels in real time.
📈 Overbought / Oversold (OB/OS) Levels
Helps identify potential reversal or reaction zones.
🔁 Previous Session OB/OS Crosses
OB/OS levels from the previous session are plotted as white crosses during the opposite session:
EU OB/OS shown during the US session
US OB/OS shown during the EU session
These levels act as potential price targets or reaction areas based on prior session behavior.
🎨 Session-Based Color Coding
EU Session
High/Low: Orange / Fuchsia
OB/OS: Orange / Lime
Previous OB/OS: White crosses during the US session
US Session
High/Low: Aqua / Teal
OB/OS: Aqua / Lime
Previous OB/OS: White crosses during the EU session
🧠 How to Use
Use the OB/OS levels to gauge potential turning points or extended moves.
Watch for previous session crosses to spot historically relevant zones that may attract price.
Monitor extended High/Low lines as potential magnets for price continuation.
🛠 Additional Notes
No repainting; levels are session-locked and tracked in real time.
Optimized for intraday strategies, scalping, and session-based planning.
Works best on assets with clear session behavior (e.g., forex, indices, major commodities).
