MACD + Stochastic + RSI (Long + Short)My strategy uses a combination of three indicators MACD Stochastic RSI .
The Idea is to GO LONG when ( MACD > Signal and RSI > 50 and Stochastic > 50) occures at the same time
and GO SHORT when ( MACD < Signal and RSI < 50 and Stochastic < 50)
This strategy works well on futures and stocks especially during market breaking up after consolidation
The best results are on Daily charts , so its NOT a scalping strategy. But it can work also on 1H charts.
The strategy does not have any stops and profit targets, so we can take all the market can give us at the moment.
The exit point only when MACD goes under/over Signal line
Its Preformance is quite stable.
So, use it, trade it.
If it will help you to imprive your trading results, please donate me
BTC: 12kd1F8buWisUBdq27BBwRkUvzW7Ey3og5
Buscar en scripts para "北证50+股票+新浪财经"

Trend Lines and MoreMulti-Indicator consisting of several useful indicators in a single package.
TREND LINES
-By default the 20 SMA and 50 SMA are shown.
-Use "MOVING AVERAGE TYPE" to select SMA, EMA, Double-EMA, Triple-EMA, or Hull.
-Use "50 MA TREND COLOR" to have the 50 turn green/red for uptrend/downtrend.
-Use "DAILY SOURCE ONLY" to always show daily averages regardless of timeframe.
-Use "SHOW LONG MA" to also include 100, 150, and 200 moving averages.
-Use "SHOW MARKERS" to show a small colored marker identifying which line is which.
OTHER INDICATORS
-You can show Bollinger Bands and Parabolic SAR.
-You can highlight key reversal times (9:50-10:10 and 14:40-15:00).
-You can show price offset markers, where was the price "n" periods ago.
That last one is useful to show the level of prices which are about to "fall off" the moving average
and be replaced with current price. So for example, if current price is significantly below the
200-days-ago price, you can gauge the difficulty for the 200 MA to start climbing again.

Multi SMA EMA WMA HMA BB (4x3 MAs Bollinger Bands) Pro MTF - RRBMulti SMA EMA WMA HMA 4x3 Moving Averages with Bollinger Bands Pro MTF by RagingRocketBull 2018
Version 1.0
This indicator shows multiple MAs of any type SMA EMA WMA HMA etc with BB and MTF support, can show MAs as dynamically moving levels.
There are 4 MA groups + 1 BB group. You can assign any type/timeframe combo to a group, for example:
- EMAs 50,100,200 x H1, H4, D1, W1 (4 TFs x 3 MAs x 1 type)
- EMAs 8,13,21,55,100,200 x M15, H1 (2 TFs x 6 MAs x 1 type)
- D1 EMAs and SMAs 12,26,50,100,200,400 (1 TF x 6 MAs x 2 types)
- H1 WMAs 7,77,231; H4 HMAs 50,100,200; D1 EMAs 144,169,233; W1 SMAs 50,100,200 (4 TFs x 3 MAs x 4 types)
- +1 extra MA type/timeframe for BB
compile time: 25-30 sec
full redraw time after parameter change in UI: 3 sec
There are several versions: Simple, MTF, Pro MTF, Advanced MTF and Ultimate MTF. This is the Pro MTF version. The Differences are listed below. All versions have BB
- Simple: you have 2 groups of MAs that can be assigned any type (5+5)
- MTF: +2 custom Timeframes for each group (2x5 MTF)
- Pro MTF: +4 custom Timeframes for each group (4x3 MTF), MA levels and show max bars back options
- Advanced MTF: +2 extra MAs/group (4x5 MTF), custom Ticker/Symbol, backreferences for type, TF and MA lengths in UI
- Ultimate MTF: +individual settings for each MA, custom Ticker/Symbols
Features:
- 4x3 = 12 MAs of any type including Hull Moving Average (HMA)
- 4x MTF groups with step line smoothing
- BB +1 extra TF/type for BB MAs
- 12 MA levels with adjustable group offsets, indents and shift
- show max bars back
- you can show/hide both groups of MAs/levels and individual MAs
Notes:
1. based on 3EmaBB, uses plot*, barssince and security functions
2. you can't set certain constants from input due to Pinescript limitations - change the code as needed, recompile and use as a private version
3. Levels = trackprice implementation
4. Show Max Bars Back = show_last implementation
5. uses timeframe textbox instead of input resolution to allow for 120 240 and other custom TFs. Also supports TFs in hours: 2H or H2
6. swma has a fixed length = 4, alma and linreg have additional offset and smoothing params
7. Smoothing is applied by default for visual aesthetics on MTF. To use exact ma mtf values (lines with stair stepping) - disable it
MTF Notes:
- uses simple timeframe textbox instead of input resolution dropdown to allow for 120, 240 and other custom TFs, also supports timeframes in H: 2H, H2
- Groups that are not assigned a Custom TF will use Current Timeframe (0).
- MTF will work for any MA type assigned to the group
- MTF works both ways: you can display a higher TF MA/BB on a lower TF or a lower TF MA/BB on a higher TF.
- MTF MA values are normally aligned at the boundary of their native timeframe. This produces stair stepping when a higher TF MA is viewed on a lower TF.
Therefore X Y Point Density/Smoothing is applied by default on MA MTF for visual aesthetics. Set both to 0 to disable and see exact ma mtf values (lines with stair stepping and original mtf alignment).
- Smoothing is disabled for BB MTF bands because fill doesn't work with smoothed MAs after duplicate values are replaced with na.
- MTF MA Value fluctuation is possible on the current bar due to default security lookahead
Smoothing:
- X,Y == 0 - X,Y smoothing disabled (stair stepping on high TFs)
- X == 0, Y > 0 - X,Y smoothing applied to all TFs
- Y == 0, X > 0 - X smoothing applied to all TFs < deltaX_max_tf, Y smoothing disabled
- X > 0, Y > 0 - Y smoothing applied to all TFs, then X smoothing applied to all TFs < deltaX_max_tf
X Smoothing with Y == 0 - shows only every deltaX-th point starting from the first bar.
X Smoothing with Y > 0 - shows only every deltaX-th point starting from the last shown Y point, essentially filling huge gaps remaining after Y Smoothing with points and preserving the curve's general shape
X Smoothing on high TFs with already scarce points produces weird curve shapes, it works best only on high density lower TFs
Y Smoothing reduces points on all TFs, removes adjacent points with prices within deltaY, while preserving the smaller curve details.
A combination of X,Y produces the most accurate smoothing. Higher delta value - larger range, more points removed.
Show Max Bars Back:
- can't set plot show_last from input -> implemented using a timenow based range check
- you can't delete/modify history once plotted, so essentially it just sets a start point for plotting (from num_bars bars back) that works only in realtime mode (not in replay)
Levels:
You can plot current MA value using plot trackprice=true or by checking Show Price Line in Style. Problem is:
- you can only change color (not the dashed line style, width), have both ma + price line (not just the line), and it's full screen wide
- you can't set plot trackprice from input => implemented using plotshape/plotchar with fixed text labels serving as levels
- there's no other way of creating a dynamic level: hline, plot, offset - nothing else works.
- you can't plot a text var - all text strings must be constants, so you can't change the style, width and text labels without recompiling.
- from input you can only adjust offset, indent and shift for each level group, and change color
- the dot below each level line is the exact MA value. If you want just the line swap plotshape with plotchar, recompile and save as your private version, adjust Y shift.
To speed up redraw times: reduce last_bars to ~2000, recompile and use as your own private version
Pinescript is a rudimentary language (should be called Painscript instead) that can basically only plot data. You can't do much else. Please see the code for tips and hints.
Certain things just can't be done or require shady workarounds and weeks of testing trying to resolve weird node.js compiler errors.
Feel free to learn from/reuse/change the code as needed and use as your own private version. See comments in code. Good Luck!

Simple_longshort_signalsLong Entry
Criteria:
1) Green candle close above 50MA
2) Green candle close above 20MA
3) MA of RSI(14) is cross upward 50
Result: displays green up arrow
Long Exit
Criteria:
1) Three red candles in a row
2) Any candle close bellow 20MA
3) MA of RSI(14) cross downward 50
Result: displays green diamond
Short Entry
1) Red candle close bellow 50MA
2) Red candle close bellow 20MA
3) MA of RSI(14) is cross downward 50
Result: displays red down arrow
Short Exit
Criteria
1) Three green candles in a row
2) Any candle close above 20MA
3) MA of RSI(14) is cross upward 50
Result: displays red diamond

Noro's Double RSI Strategy 1.0Strategy uses only 2 RSI indicators. Slow and fast.
If slow RSI > 50 and fast RSI < 50 - to open a long-position
If slow RSI < 50 and fast RSI > 50 - to open a short-position
If the long-position is open and a candle green - to close a long-position
if the short-position is open and a candle red - to close a short-position

GoldenCross by PuffyThis is a simple trading strategy that seeks the Golden Cross and Death Cross on the 4HR chart. The fast moving indicator in this strategy is the EMA 50 and the slow moving indicator is the EMA 200. When the EMA 50 crosses over the EMA 200 the strategy indicates a buy. When the EMA 50 crosses below the EMA 200 the strategy indicates a sell. This strategy averages trades in the 40 - 50 day range and as such should not be used with heavy leverage.

Exponential Moving Average (Set of 3) [Krypt] + 13/34 EMAsI took Krypt's script and essentially added on to it.
the 20/50/100/200 EMAs should be used together as support and resistance as normal.
Wait for price to break 200 EMA
Wait for 50 EMA to cross 200 EMA
Wait for pullback to 50 EMA to open position
20 and 100 EMAs are for extra information about moving support and resistance
and 13/34 EMAs should be used in conjunction
When 13 EMA crosses 34 EMA, open position
When price gets far from 13/34, close position (because price will attempt to revert back to mean)
This is better for scalping and swing trades than the 20/50/100/200 setup.
Twitter: @AzorAhai06

MTF EMAExponential Moving Average indicator that can be configured to display different timeframe EMA's.
Timeframe is set in minutes. Max timeframe currently is the daily (1440 minutes). Any value higher than 1440 will result in no plot.
Examples:
Daily 50 EMA plotted on 4H chart
4H 50 EMA and Daily 50 EMA plotted on 1H chart
Can also work in reverse if needed.
Example, Daily 50 EMA plotted on Weekly Chart

Price vs VolImproved version of OBV/price (this one actually works)
Both lines show where price is going relative to volume metrics (one line uses OBV, the other uses accumulation/distribution).
Green and above 50 means price is rising faster then buying volume
Red and below 50 means price is falling faster then selling volume
you can add smoothing in the controls and color will go according to raw (even if smoothing goes above/below 50)
under the hood: changes price, OBV and AD to RSI for comparability, calculates the difference between price and the others, then an RSI on the result to create an <50< style indicator.
this script replaces the previouse from:

MTC – Multi-Timeframe Trend Confirmator V2MTC – Multi-Timeframe Trend Confirmator V2
A comprehensive trend analysis indicator that systematically combines six technical indicators across three customizable timeframes, using a weighted scoring system to identify high-probability trend conditions.
ORIGINALITY AND CONCEPT
This indicator is original in its approach to multi-timeframe trend confirmation. Rather than relying on a single indicator or timeframe, it creates a composite score by evaluating six different technical conditions simultaneously across three timeframes. The scoring system weighs certain indicators more heavily based on their reliability in trend identification. The visual gauge provides an at-a-glance view of trend alignment across timeframes, making it easier to identify when multiple timeframes agree - a condition that typically produces stronger, more reliable trends.
HOW IT WORKS - DETAILED SCORING METHODOLOGY
The indicator evaluates six technical conditions on each timeframe. Each condition contributes to a composite score:
EMA 200 (Weight: 1 point)
Bullish: Price closes above EMA 200 (+1)
Bearish: Price closes below EMA 200 (-1)
Rationale: Long-term trend direction
SMA 50/200 Crossover (Weight: 1 point)
Bullish: SMA 50 above SMA 200 (+1)
Bearish: SMA 50 below SMA 200 (-1)
Rationale: Golden/Death cross confirmation
RSI 14 (Weight: 1 point)
Bullish: RSI above 55 (+1)
Bearish: RSI below 45 (-1)
Neutral: RSI between 45-55 (0)
Rationale: Momentum filter with buffer zone to avoid chop
MACD (12,26,9) (Weight: 1 point)
Bullish: MACD line above signal line (+1)
Bearish: MACD line below signal line (-1)
Rationale: Trend momentum confirmation
ADX 14 (Weight: 2 points - DOUBLE WEIGHTED)
Requires ADX above 25 to activate
Bullish: DI+ above DI- and ADX > 25 (+2)
Bearish: DI- above DI+ and ADX > 25 (-2)
Neutral: ADX below 25 (0)
Rationale: Trend strength filter - only counts when a strong trend exists. Double weighted because ADX is specifically designed to measure trend strength, making it more reliable than oscillators.
Supertrend (Factor: 3.0, ATR Period: 10) (Weight: 2 points - DOUBLE WEIGHTED)
Bullish: Direction indicator = -1 (+2)
Bearish: Direction indicator = +1 (-2)
Rationale: Dynamic support/resistance that adapts to volatility. Double weighted because Supertrend provides clear, objective trend signals with built-in stop-loss levels.
COMPOSITE SCORE CALCULATION:
Total possible score range: -10 to +10 points
Score interpretation:
Score > 2: UPTREND (majority of indicators bullish, especially weighted ones)
Score < -2: DOWNTREND (majority of indicators bearish, especially weighted ones)
Score between -2 and +2: NEUTRAL/RANGING (mixed signals or weak trend)
The threshold of +/- 2 was chosen because it requires more than just basic agreement - it typically means at least 3-4 indicators align, or that the heavily-weighted indicators (ADX, Supertrend) confirm the direction.
MULTI-TIMEFRAME LOGIC:
The indicator calculates the composite score independently for three timeframes:
Higher Timeframe (default: 4H) - Major trend direction
Mid Timeframe (default: 1H) - Intermediate trend
Lower Timeframe (default: 15min) - Entry timing
Main Trend Confirmation Rule:
The indicator only signals a confirmed trend when BOTH the higher timeframe AND mid timeframe scores agree (both > 2 for uptrend, or both < -2 for downtrend). This dual-timeframe confirmation significantly reduces false signals during choppy or ranging markets.
HOW TO USE IT
Setup:
Add indicator to chart
Customize timeframes based on your trading style:
Scalpers: 15min, 5min, 1min
Day traders: 4H, 1H, 15min (default)
Swing traders: Daily, 4H, 1H
Toggle individual indicators on/off based on your preference
Adjust Supertrend parameters if needed for your instrument's volatility
Reading the Gauge (Top Right Corner):
Each row shows one timeframe
Left column: Timeframe label
Middle column: Visual strength bars (10 bars = maximum score)
Green bars = Bullish score
Red bars = Bearish score
Yellow bars = Neutral/ranging
More filled bars = stronger trend
Right column: Numerical score
Trading Signals:
Entry Signals:
Long Entry: Wait for upward triangle arrow (appears when higher + mid TF both bullish)
Confirm gauge shows green bars on higher and mid timeframes
Lower timeframe should ideally turn green for entry timing
Chart background tints light green
Short Entry: Wait for downward triangle arrow (appears when higher + mid TF both bearish)
Confirm gauge shows red bars on higher and mid timeframes
Lower timeframe should ideally turn red for entry timing
Chart background tints light red
Position Management:
Stay in position while higher and mid timeframes remain aligned
Consider reducing position size when mid timeframe score weakens
Exit when higher timeframe trend reverses (daily label changes)
Avoiding False Signals:
Ignore signals when gauge shows mixed colors across timeframes
Avoid trading when scores are close to threshold (+/- 2 to +/- 4 range)
Best trades occur when all three timeframes align (all green or all red in gauge)
Use the numerical scores: higher absolute values (7-10) indicate stronger, more reliable trends
Practical Examples:
Example 1 - Strong Uptrend Entry:
Higher TF: +8 (strong green bars)
Mid TF: +6 (strong green bars)
Lower TF: +4 (moderate green bars)
Action: Look for long entries on lower timeframe pullbacks
Background is tinted green, upward arrow appears
Example 2 - Ranging Market (Avoid):
Higher TF: +3 (weak green)
Mid TF: -1 (weak red)
Lower TF: +2 (neutral yellow)
Action: Stay out, wait for alignment
Example 3 - Trend Reversal Warning:
Higher TF: +7 (still green)
Mid TF: -3 (turned red)
Lower TF: -5 (strong red)
Action: Consider exiting longs, prepare for potential higher TF reversal
Customization Options:
Timeframes: Adjust all three to match your trading horizon
Indicator Toggles: Disable indicators that don't suit your instrument:
Disable RSI for highly volatile crypto markets
Disable SMA crossover for range-bound instruments
Keep ADX and Supertrend enabled for trending markets
Visual Preferences:
Arrow size: 5 options from Tiny to Huge
Gauge size: Small/Medium/Large for different screen sizes
Toggle arrows on/off if you only want the gauge
Alert Setup:
Right-click chart, "Add Alert"
Condition: MTC v6 - UPTREND or DOWNTREND
Get notified when multi-timeframe confirmation occurs
Best Practices:
Use with Price Action: The indicator works best when combined with support/resistance levels, chart patterns, and volume analysis
Risk Management: Even with multi-timeframe confirmation, always use stop losses
Market Context: Works best in trending markets; less reliable in strong consolidation
Backtesting: Test the default settings on your specific instrument and timeframe before live trading
Patience: Wait for full multi-timeframe alignment rather than taking premature signals
Technical Notes:
All calculations use Pine Script's security function to fetch data from multiple timeframes
Prevents repainting by using confirmed bar data
Gauge updates in real-time on the last bar
Daily labels mark at the open of each new daily candle
Works on all instruments and timeframes
This indicator is ideal for traders who want objective, systematic trend identification without the complexity of analyzing multiple indicators manually across different timeframes.
-NATANTIA

DeepFlow Zones SNIPER# DeepFlow Zones SNIPER - Documentation & Cheatsheet
## 🎯 DeepFlow Zones - SNIPER Edition
**Horizontal Limit Order Zones | Institutional FVG + Single Prints**
> **Philosophy:** *Only mark the zones where institutions MUST have orders. Everything else is noise.*
---
## ⚡ QUICK CHEATSHEET
```
┌─────────────────────────────────────────────────────────────────────────────┐
│ DEEPFLOW ZONES SNIPER - QUICK REFERENCE │
├─────────────────────────────────────────────────────────────────────────────┤
│ │
│ 🎯 ZONE CREATION REQUIREMENTS (ALL MUST BE TRUE): │
│ ══════════════════════════════════════════════════ │
│ ✓ FVG exists → Gap between candle low and 2-bar-ago high │
│ ✓ Gap Size → At least 30% of ATR (significant gap) │
│ ✓ Impulse Candle → 1.8x average range + 65% body ratio │
│ ✓ Volume → 2.0x+ average on impulse candle │
│ ✓ Direction → Middle candle confirms gap direction │
│ │
├─────────────────────────────────────────────────────────────────────────────┤
│ │
│ 📊 ZONE TYPES: │
│ ══════════════ │
│ 🟢 BULLISH ZONE → Green box BELOW price (buy zone) │
│ 🔴 BEARISH ZONE → Red box ABOVE price (sell zone) │
│ ⚫ TESTED ZONE → Gray box (CE level touched) │
│ ⬛ BROKEN ZONE → Dark gray (price closed through) │
│ │
├─────────────────────────────────────────────────────────────────────────────┤
│ │
│ ⭐ SINGLE PRINT LINES: │
│ ══════════════════════ │
│ Requirements: │
│ • Range 1.8x+ average │
│ • Body 65%+ of range │
│ • Volume 2.0x+ average │
│ • Delta 60%+ confirms direction │
│ │
│ Usage: │
│ • Gold lines at HIGH and LOW of impulse candle │
│ • Price often returns to these levels │
│ • Use as support/resistance for entries │
│ │
├─────────────────────────────────────────────────────────────────────────────┤
│ │
│ 🚨 ENTRY SIGNALS: │
│ ═══════════════════ │
│ BUY🎯 appears when: │
│ • Price is inside BULLISH zone │
│ • Delta shows 60%+ buy dominance │
│ • Volume is 1.5x+ average │
│ │
│ SELL🎯 appears when: │
│ • Price is inside BEARISH zone │
│ • Delta shows 60%+ sell dominance │
│ • Volume is 1.5x+ average │
│ │
├─────────────────────────────────────────────────────────────────────────────┤
│ │
│ 📐 ZONE ANATOMY: │
│ ═════════════════ │
│ │
│ BULLISH FVG ZONE: BEARISH FVG ZONE: │
│ │
│ Current Low ───────────────── ───────────────── 2-bar-ago Low │
│ ┌─────────────────────────┐ ┌─────────────────────────┐ │
│ │ █████ ZONE █████████████│ │ █████ ZONE █████████████│ │
│ │- - - CE (50%) - - - - - │ │- - - CE (50%) - - - - - │ │
│ │ ████████████████████████│ │ ████████████████████████│ │
│ └─────────────────────────┘ └─────────────────────────┘ │
│ 2-bar-ago High ────────────── ───────────────── Current High │
│ │
│ Entry: At or near CE line Entry: At or near CE line │
│ Stop: Below zone bottom Stop: Above zone top │
│ Target: 1:1 or 2:1 R:R Target: 1:1 or 2:1 R:R │
│ │
├─────────────────────────────────────────────────────────────────────────────┤
│ │
│ ⛔ ZONE IS INVALID WHEN: │
│ ═════════════════════════ │
│ ✗ Gap size < 30% of ATR (too small) │
│ ✗ No impulse candle (weak move) │
│ ✗ Volume < 2x average (retail move) │
│ ✗ Zone age > 50 bars (stale) │
│ ✗ Price already closed through zone │
│ │
└─────────────────────────────────────────────────────────────────────────────┘
```
---
## 📋 DETAILED DOCUMENTATION
### What Makes SNIPER Zones Different?
Standard FVG indicators create zones everywhere. SNIPER zones only appear when there's **institutional footprint**:
| Filter | Standard FVG | SNIPER Zones | Why It Matters |
|--------|-------------|--------------|----------------|
| Gap Size | Any gap | **≥30% ATR** | Significant imbalance |
| Volume | Optional | **2.0x+ avg** | Institutional volume |
| Impulse | None | **1.8x range** | Real momentum |
| Body | None | **65%+ ratio** | Conviction candle |
| Max Zones | 20-50 | **10 max** | Only the best |
| Zone Life | 100 bars | **50 bars** | Fresh zones only |
---
### How Zones Are Created
```
BULLISH FVG FORMATION:
═══════════════════════
Bar 0 (2 bars ago): Bar 1 (Impulse): Bar 2 (Current):
┌─────┐ ┌─────┐ ┌─────┐
│ │ │█████│ │ │
│ │ HIGH ────── │█████│ │ │
│ │ │ │█████│ │ │
└─────┘ │ │█████│ │ │── LOW
│ └─────┘ └─────┘
│ │
└──────── GAP ────────────────┘
(FVG ZONE)
Requirements Met:
✓ Current LOW > 2-bar-ago HIGH (gap exists)
✓ Gap ≥ 30% of ATR (significant)
✓ Bar 1 range ≥ 1.8x average (impulse)
✓ Bar 1 body ≥ 65% of range (conviction)
✓ Bar 1 volume ≥ 2x average (institutional)
✓ Bar 1 was bullish (direction confirms)
RESULT: VALID SNIPER BULLISH ZONE CREATED
```
---
### Single Print Lines Explained
Single Prints mark **institutional impulse candles** where price moved so fast that no orders were filled at those levels. These levels often act as magnets for price.
```
SINGLE PRINT CANDLE:
════════════════════
HIGH ═══════════════════════════════ (Gold Line)
│
┌─────────────────┤
│█████████████████│ ← Large body (65%+)
│█████████████████│ ← Strong volume (2x+)
│█████████████████│ ← Clear delta (60%+)
│█████████████████│
└─────────────────┤
│
LOW ═══════════════════════════════ (Gold Line)
These horizontal lines extend 500 bars into the future.
Price often returns to test these levels.
```
---
### Entry Strategy
#### Zone Entry Checklist
```
□ Zone is active (green/red, not gray)
□ Price enters zone from outside
□ Wait for entry signal (BUY🎯 or SELL🎯)
□ Verify: Delta + Volume confirming
□ Enter at CE line (dotted white line)
□ Stop below/above zone
□ Target: Opposite side of zone (1:1) or 2:1
```
#### Single Print Entry
```
□ Price returns to single print level
□ Look for reaction (rejection candle)
□ Combine with GRA signal if possible
□ Enter on confirmation candle
□ Stop beyond the single print line
```
---
### Table Legend
| Field | Reading | Color Meaning |
|-------|---------|---------------|
| **Delta** | Buy/Sell % | 🟢 Buy dom, 🔴 Sell dom, ⚪ Neutral |
| **Vol** | Volume ratio | 🟢 ≥2x, ⚪ <2x |
| **Buy ⬚** | Active buy zones | Count of bullish zones |
| **Sell ⬚** | Active sell zones | Count of bearish zones |
| **Zone** | Current position | AT BUY / AT SELL / --- |
| **Impulse** | Current bar status | 🟡 Yes (impulse), ⚫ No |
---
### Zone States
| State | Visual | Meaning | Action |
|-------|--------|---------|--------|
| **Fresh** | Bright color | Never tested | Best entries |
| **Tested** | Gray | CE touched | Still valid, less reliable |
| **Broken** | Dark gray | Price closed through | Invalid, ignore |
---
### Integration with GRA v5
The magic happens when you combine both indicators:
```
HIGHEST PROBABILITY SETUP:
══════════════════════════
1. DeepFlow shows active zone (green/red box)
2. Price enters the zone
3. GRA5 fires a signal INSIDE the zone
4. Delta confirms on both indicators
5. Volume confirms on both indicators
This is your SNIPER entry. Take it.
Example:
┌─────────────────────────────────────────┐
│ Price enters BULLISH zone │
│ GRA5 shows: A🎯 LONG │
│ DFZ shows: BUY🎯 │
│ Table: Vol 2.1x, Delta 67%B │
│ │
│ ACTION: Full size LONG at CE │
│ STOP: Below zone bottom │
│ TARGET: 2:1 R:R │
└─────────────────────────────────────────┘
```
---
### Settings by Instrument
| Instrument | Vol Mult | Gap ATR | Impulse | Max Zones |
|------------|----------|---------|---------|-----------|
| **NQ/ES** | 2.0x | 30% | 1.8x | 10 |
| **YM** | 2.0x | 30% | 1.8x | 10 |
| **GC** | 2.5x | 40% | 2.0x | 8 |
| **BTC** | 2.0x | 25% | 1.5x | 10 |
---
### Common Mistakes
| Mistake | Why It's Bad | Solution |
|---------|-------------|----------|
| Trading every zone | Most zones fail | Wait for entry signal |
| Entering at zone edge | Wrong R:R | Enter at CE (middle) |
| Ignoring broken zones | Already invalidated | Gray = don't trade |
| No delta confirmation | Could be false zone | BUY🎯/SELL🎯 required |
| Too many zones | Chart noise | Max 10 zones |
---
### Alert Configuration
| Alert | Priority | Action |
|-------|----------|--------|
| 🎯 BUY/SELL ZONE ENTRY | 🔴 High | Check chart immediately |
| NEW BULL/BEAR ZONE | 🟠 Medium | Note new zone location |
| 🎯 SINGLE PRINT | 🟢 Low | Mark potential S/R |
---
### Pine Script v6 Notes
This indicator uses Pine Script v6 features:
- Array-based zone management
- `request.security_lower_tf()` for delta
- Dynamic zone state tracking
- Efficient garbage collection
**Minimum TradingView Plan:** Pro (for intrabar data)
---
## 🏆 Golden Rules
1. **Fewer zones = Better zones.** If you see more than 5 active zones, your settings are too loose.
2. **Fresh zones > Tested zones.** The first touch is always the best.
3. **CE is king.** The middle of the zone (50% level) is your entry point.
4. **Zone + GRA signal = Sniper entry.** This confluence is what we're hunting for.
5. **Gray zones don't exist.** Once broken, pretend the zone was never there.
---
*© Alexandro Disla - DeepFlow Zones SNIPER*
*Pine Script v6 | TradingView*

Adaptive Trend Mapper-ATM (Arjo)Adaptive Trend Mapper (ATM) is a multi-factor trend, momentum, and compression-analysis tool designed to help traders visually map the strength and direction of market pressure.
Instead of simply combining existing indicators, ATM creates a new composite framework that blends momentum imbalance, directional strength, volatility contraction, and adaptive smoothing into a single, unified model.
Originality and usefulness
Adaptive Trend Mapper (ATM) does not replicate any one indicator.
It generates two custom indices— Bull Pressure Index and Bear Pressure Index —derived from a mathematical combination of RSI, inverse-RSI, and ADX. These indices behave differently from traditional oscillators:
They represent directional pressure on a 0–100 scale , not momentum.
They are designed to converge/diverge, forming a basis for the built-in Squeeze Detection Engine.
They can be optionally step-compressed , making the movement easier to read on fast or small charts.
The script also integrates a custom SuperSmoother trend model (not TradingView’s built-in function), which acts as an adaptive trend curve on the chart.
All calculations are combined intentionally—not as a mashup—to create a framework that allows traders to understand trend strength, compression phases, and micro-trend shifts in one place.
How the Indicator Works
1. Bull & Bear Pressure Indices:
These indices measure directional imbalance:
Bull Index = ADX strength weighted against inverse-RSI
Bear Index = ADX strength weighted against normal RSI
This produces two opposing pressure curves that rise or fall depending on whether buyers or sellers dominate.
You can optionally smooth these using:
SMA / EMA / WMA / RMA via the “Smoothing Settings” panel.
2. Squeeze & Compression Detection:
A squeeze is detected when:
ADX stays below a user-defined threshold
Bull–Bear Index difference shrinks
Average difference is falling (convergence)
This is a volatility-contraction model inspired by squeeze logic but applied to directional pressure, not Bollinger Bands/Keltner Channels .
3. Adaptive Trend Curve (SuperSmoother Engine)
The indicator applies a two-pole SuperSmoother filter to the price, then smooths it again using EMA.
The slope color flips between bullish and bearish and is displayed using:
A thin SuperSmoother curve
A thicker band for visual context
4. EMA-50 Trend Context:
An optional EMA-50 helps identify broad directional bias .
5. Step-Based Scaling
You can quantize the Bull/Bear indices using custom step intervals.
This makes the indicator easier to read on noisy intraday charts.
How to Use the Indicator
1. Trend Analysis
A rising Bull Index shows strengthening upward pressure
A rising Bear Index shows strengthening downward pressure
Wide divergence between the indices signals a strong trend
2. Compression / Squeeze Analysis
Yellow background = volatility compression + pressure convergence
Breakouts from this zone often precede directional expansion
3. Trendline Reading
SuperSmoother line color flip = micro trend shift
EMA-50 slope gives macro-trend direction
Perfect for combining trend and momentum maps on the same chart
4. Visual Interpretation
Cyan/teal → strong bullish pressure
Purple/red/orange → various levels of bearish control
Neutral/teal background → weak ADX
Yellow background → squeeze zone
Open-Source Notes
This script uses:
TradingView built-in RSI, ADX/DMI, and smoothing functions
A SuperSmoother implementation based on known DSP filter coefficients
All remaining logic, signal methods, composite indices, and compression model are original developments by ARJO .
The script is published open-source to comply with TradingView’s reuse policy.
Disclaimer
This tool is for educational and analytical purposes only.
It does not generate buy or sell signals.
Always use proper risk management.
Happy Trading (ARJO)

DarkPool's RSi DarkPool's RSi is an enhanced momentum oscillator designed to automatically detect structural discrepancies between price action and the Relative Strength Index. While retaining the standard RSI visualization, this script overlays advanced divergence recognition logic to identify potential trend reversals.
The tool identifies pivot points in real-time and compares recent peaks and valleys against historical data. When the momentum of the RSI contradicts the direction of price action, the indicator highlights these events using dynamic trendlines, shape markers, and background coloring. A built-in dashboard table provides an immediate status check of active divergence signals.
Key Features
Automated Divergence Detection: Automatically spots both Regular Bullish and Regular Bearish divergences based on pivot lookback settings.
Dynamic Visuals: Draws physical lines connecting RSI peaks or troughs to visualize the divergence angle, alongside triangle markers indicating the signal direction.
Active Status Dashboard: A data table located on the chart monitors the current state of the market, flagging signals as "Active" when detected.
Standard RSI Overlay: Includes standard Overbought (70) and Oversold (30) reference lines for traditional momentum trading.
How to Use
1. Reading the Standard RSI The black line represents the Relative Strength Index.
Overbought (Above 70): Suggests the asset may be overvalued and due for a pullback.
Oversold (Below 30): Suggests the asset may be undervalued and due for a bounce.
Midline (50): Acts as a trend filter; values above 50 indicate bullish momentum, while values below 50 indicate bearish momentum.
2. Trading Divergences The primary function of this tool is to identify reversal setups.
Bullish Divergence (Green Triangle/Line): Occurs when Price makes a Lower Low, but the RSI makes a Higher Low. This indicates that selling momentum is exhausting and a price increase may follow.
Bearish Divergence (Red Triangle/Line): Occurs when Price makes a Higher High, but the RSI makes a Lower High. This indicates that buying momentum is fading and a price decrease may follow.
3. Visual Aids
Lines: The script draws solid lines directly on the RSI pane connecting the relevant pivot points to confirm the divergence slope.
Background Color: When a divergence is detected, the background of the indicator pane will highlight briefly (Green for Bullish, Red for Bearish) to draw attention to the new signal.
4. The Dashboard A small table in the bottom right corner tracks the status of the signals.
Status: ACTIVE: A divergence has been detected within the last 10 bars.
Status: None: No recent divergence patterns have been identified.
Disclaimer This indicator is provided for educational and informational purposes only. It does not constitute financial advice, investment recommendations, or a guarantee of future results. Trading cryptocurrencies and financial markets involves a high level of risk. Always perform your own due diligence before making any trading decisions.

💀 DarkPool's Moving Averages 💀DarkPool's Moving Averages is a consolidated trend analysis tool that allows traders to plot up to five distinct moving averages (MAs) within a single indicator pane. This script is designed to declutter trading charts by replacing multiple individual indicator instances with one comprehensive solution.
Beyond standard plotting, the indicator features Multi-Timeframe (MTF) capabilities, allowing users to overlay higher-timeframe trends (e.g., Daily or Weekly averages) onto lower-timeframe charts (e.g., 5-minute or 1-hour). It also utilizes dynamic color-coding to visually indicate instantaneous trend direction based on the slope of the moving average.
Key Features
5-in-1 Architecture: Configure and toggle up to five independent moving averages simultaneously.
Multi-Timeframe (MTF) Support: Calculate moving averages based on timeframes different from the current chart (e.g., view a 200-day EMA while trading on a 15-minute chart).
Dynamic Trend Coloring: Lines automatically change color based on their slope (rising vs. falling) to provide immediate visual trend confirmation.
Versatile Calculation Models: Supports major averaging methods including SMA, EMA, WMA, RMA, VWMA, and HMA.
How to Use
1. Trend Identification The primary use of this tool is to identify the market trend direction at a glance.
Bullish Trend: When the Moving Average line is colored in the "Bullish Color" (default: dark/green tones) and sloping upward.
Bearish Trend: When the Moving Average line is colored in the "Bearish Color" (default: light/red tones) and sloping downward.
2. Dynamic Support and Resistance Traders can use specific lengths (e.g., 50, 100, 200) to identify dynamic support and resistance levels.
Entry: In an uptrend, price retracing to a rising MA often presents a buying opportunity.
Exit: In a downtrend, price rallying to a falling MA often presents a selling opportunity.
3. The "Ribbon" Effect By enabling multiple MAs with sequential lengths (e.g., 10, 20, 50, 100, 200), traders can visualize the strength of the trend.
Expansion: When the lines spread apart, the trend is strengthening.
Contraction/Crossover: When the lines converge or cross, the trend is weakening or consolidating.
4. Multi-Timeframe Analysis Use the "Timeframe" input in the General Settings to lock the calculations to a specific period.
Example: Set the Timeframe to "D" (Daily) and the Length to 200. You can now drop down to a 5-minute chart, and the indicator will still display the significant 200-Day Moving Average, acting as a major anchor for intraday price action.
Configuration Guide
General Settings
Timeframe: Determines the data source for all MAs. Leave at default to use the current chart's timeframe, or select a specific higher timeframe for macro analysis.
Price Source: Selects the data point used for calculation (Close, Open, High, Low, etc.).
Moving Average Configurations (MA1 - MA5) Each of the five slots allows for individual customization:
Enable: Toggle the visibility of the specific MA.
Type: Select the calculation method.
SMA: Simple Moving Average (Standard).
EMA: Exponential Moving Average (Weight on recent data).
HMA: Hull Moving Average (Reduced lag).
VWMA: Volume Weighted Moving Average.
WMA/RMA: Weighted and Rolling Moving Averages.
Note: While many types are listed, the script explicitly calculates the types listed above; others may default to standard SMA behavior.
Length: The lookback period (e.g., 20, 50, 200).
Colors (Bull/Bear): Customize the colors used when the line is rising versus falling.
Line Style: Choose between Solid, Dashed, or Dotted lines to differentiate between the five MAs.
Disclaimer: This indicator is provided for educational and informational purposes only. It does not constitute financial advice, investment recommendations, or a guarantee of future results.

Pivot Move Ranges█ OVERVIEW
“Pivot Move Ranges” is an indicator that displays only the historical price ranges of moves that match the direction of the current swing.
It measures the price range of each individual swing and draws them as horizontal Δ-boxes positioned at the level of the most recently detected pivot.
The indicator operates with a delay equal to the set pivot detection length – after each new Pivot High, only red Δ-boxes appear showing the sizes of previous downward moves; after each new Pivot Low, only green Δ-boxes appear showing the sizes of previous upward moves. When the swing direction changes, the displayed set of levels instantly switches to the opposite direction.
█ CONCEPTS
The indicator was created to instantly provide the trader with objective, real historical price ranges – perfectly reinforcing classic tools such as Fibonacci extension/retracement, daily/weekly pivots, moving averages, order blocks, or Volume Profile.
It detects classic Pivot High and Pivot Low points:
- New Pivot High → only previous downward moves are shown (red Δ-boxes)
- New Pivot Low → only previous upward moves are shown (green Δ-boxes)
This ensures that at any moment you see only the historical ranges that match the current market direction. Price moves very often repeat themselves – the indicator makes these recurring levels immediately visible and ready to serve as natural reinforcement for other technical analysis tools.
█ FEATURES
- Pivot High / Pivot Low detection with adjustable length (default 12)
- Δ-boxes – thin horizontal lines showing the exact size of previous moves that match the current swing
- Automatic switching of the Δ-box set whenever a new opposite pivot appears
- Memory of the last N moves (default 6, max. 50) – oldest are automatically removed
- Labels showing move size (Δ) and start date/time
- Full color customization (separate for up and down), border and text transparency
- Choice of date format (DD.MM.YYYY or MM/DD/YYYY)
- Small circles marking the exact pivot locations
█ HOW TO USE
Add the indicator to your TradingView chart → paste the code → Add to Chart.
Settings:
- Pivot Length – higher values = fewer but more significant pivots (detected with a delay equal to this length)
- Max Corrections to Keep – how many previous matching moves are displayed at once
- Upward / Downward Box Color – colors of the Δ-boxes
- Box Border Transparency (%) – 0 = solid lines, 50–70 = subtle
- Show Δ Text + Move Start Date – turn labels on/off
Interpretation:
At any given moment the chart shows only the historical ranges of moves in the current direction:
- after a Pivot High → red Δ-boxes = “how far the market previously fell”
- after a Pivot Low → green Δ-boxes = “how far the market previously rose”
█ APPLICATIONS
- Instant reinforcement of technical levels – historical moves matching the current swing direction often coincide with Fibonacci levels, daily/weekly pivots, moving averages, or order blocks
- Fast cluster detection – set a high Max Corrections value (30–50) to see where the largest number of similarly sized moves cluster, then reduce to 6–10 and focus only on the most recent levels
█ NOTES
- On very strong trends, Δ-boxes can be extremely long – this is normal and correct behavior
- Always use as a supporting layer alongside other technical analysis tools

Pivot Reversal Signals - Multi ConfirmationPivot Reversal Signals - Multi-Confirmation System
Overview
A comprehensive reversal detection indicator designed for daytraders that combines six independent technical signals to identify high-probability pivot points. The indicator uses a scoring system to classify signal strength as Weak, Medium, or Strong based on the number of confirmations present.
How It Works
The indicator monitors six key reversal signals simultaneously:
1. RSI Divergence - Detects when price makes new highs/lows but RSI shows weakening momentum
2. MACD Divergence - Identifies divergence between price action and MACD histogram
3. Key Level Touch - Confirms price is at significant support/resistance (previous day high/low, premarket high/low, VWAP, 50 SMA)
4. Reversal Candlestick Patterns - Recognizes bullish/bearish engulfing, hammers, and shooting stars
5. Moving Average Confluence - Validates bounces/rejections at stacked moving averages (9/20/50)
6. Volume Spike - Confirms increased participation (default: 1.5x average volume)
Signal Strength Classification
• Weak (3/6 confirmations) - Small circles for situational awareness only
• Medium (4/6 confirmations) - Regular triangles, viable entry signals
• Strong (5-6/6 confirmations) - Large triangles with background highlight, highest probability setups
Visual Features
• Entry Signals: Green triangles (up) for long entries, red triangles (down) for short entries
• Exit Warnings: Orange X markers when opposing signals appear
• Signal Labels: Show confirmation score (e.g., "5/6") and strength level
• Key Levels Displayed:
o Previous Day High/Low - Solid green/red lines (uses actual daily data)
o Premarket High/Low - Blue/orange circles (4:00 AM - 9:30 AM EST)
o VWAP - Purple line
o Moving Averages - 9 EMA (blue), 20 EMA (orange), 50 SMA (red)
• Background Tinting: Subtle color on strongest reversal zones
Key Level Detection
The indicator uses request.security() to accurately fetch previous day's high/low from daily timeframe data, ensuring precise level placement. Premarket high/low levels are dynamically tracked during premarket sessions (4:00 AM - 9:30 AM EST) and plotted throughout the trading day, providing critical support/resistance zones that often influence price action during regular hours.
Customizable Parameters
• Signal strength thresholds (adjust required confirmations)
• RSI settings (length, overbought/oversold levels)
• MACD parameters (fast/slow/signal lengths)
• Moving average periods
• Volume spike multiplier
• Toggle individual display elements (levels, MAs, labels)
Best Practices
• Use on 5-minute charts for entries, confirm on 15-minute for direction
• Focus on Medium and Strong signals; Weak signals provide context only
• Strong signals (5-6 confirmations) have the highest win rate
• Pay special attention to reversals at premarket high/low - these levels frequently hold
• Previous day high/low often acts as major support/resistance
• Always use proper risk management and stop losses
• Works best in moderately trending markets
Alert Capabilities
Set custom alerts for:
• Strong long/short signals
• All entry signals (medium + strong)
• Exit warnings for open positions
Ideal For
• Daytraders and scalpers (especially SPY, QQQ, and liquid equities)
• Swing traders seeking precise entries
• Traders who prefer confirmation-based systems
• Anyone looking to reduce false signals with multi-factor validation
• Traders who utilize premarket levels in their strategy
Technical Notes
• Uses Pine Script v6
• Premarket hours: 4:00 AM - 9:30 AM EST
• Previous day levels pulled from daily timeframe for accuracy
• Maximum 500 labels to maintain chart performance
• All key levels update dynamically in real-time
________________________________________
Note: This indicator provides signal analysis only and should be used as part of a complete trading strategy. Past performance does not guarantee future results. Always practice proper risk management.

Ultimate Multi-Asset Correlation System by able eiei Ultimate Multi-Asset Correlation System - User Guide
Overview
This advanced TradingView indicator combines WaveTrend oscillator analysis with comprehensive multi-asset correlation tracking. It helps traders understand market relationships, identify regime changes, and spot high-probability trading opportunities across different asset classes.
Key Features
1. WaveTrend Oscillator
Main Signal Lines: WT1 (blue) and WT2 (red) plot momentum and its moving average
Overbought/Oversold Zones: Default levels at +60/-60
Cross Signals:
🟢 Bullish: WT1 crosses above WT2 in oversold territory
🔴 Bearish: WT1 crosses below WT2 in overbought territory
Higher Timeframe (HTF) Analysis: Shows WT1 from 4H, Daily, and Weekly timeframes for trend confirmation
2. Multi-Asset Correlation Tracking
Monitors relationships between:
Major Assets: Gold (XAUUSD), Dollar Index (DXY), US 10-Year Yield, S&P 500
Crypto Assets: Bitcoin, Ethereum, Solana, BNB
Cross-Asset Analysis: Correlation between traditional markets and crypto
3. Market Regime Detection
Automatically identifies market conditions:
Risk-On: High correlation + positive sentiment (🟢 Green background)
Risk-Off: High correlation + negative sentiment (🔴 Red background)
Crypto-Risk-On: Strong crypto correlations (🟠 Orange background)
Low-Correlation: Divergent market behavior (⚪ Gray background)
Neutral: Mixed signals (🟡 Yellow background)
How to Use
Basic Setup
Add to Chart: Apply the indicator to any chart (works on all timeframes)
Choose Display Mode (Display Options):
All: Shows everything (recommended for comprehensive analysis)
WaveTrend Only: Focus on momentum signals
Correlation Only: View market relationships
Heatmap Only: Simplified correlation view
Enable Asset Groups:
✅ Major Assets: Traditional markets (stocks, bonds, commodities)
✅ Crypto Assets: Digital currencies
Mix and match based on your trading focus
Reading the Charts
WaveTrend Section (Bottom Panel)
Above 0 = Bullish momentum
Below 0 = Bearish momentum
Above +60 = Overbought (potential reversal)
Below -60 = Oversold (potential bounce)
Lighter lines = Higher timeframe trends
Correlation Histogram (Colored Bars)
Blue bars: Major asset correlations
Orange bars: Crypto correlations
Purple bars: Cross-asset correlations
Bar height: Correlation strength (-50 to +50 scale)
Background Color
Intensity reflects correlation strength
Color shows market regime
Dashboard Elements
🎯 Market Regime Analysis (Top Left)
Current Regime: Overall market condition
Average Correlation: Strength of relationships (0-1 scale)
Risk Sentiment: -100% (risk-off) to +100% (risk-on)
HTF Alignment: Multi-timeframe trend agreement
Signal Quality: Confidence level for current signals
📊 Correlation Matrix (Top Right)
Shows correlation values between asset pairs:
1.00: Perfect positive correlation
0.75+: Strong correlation (🟢 Green)
0.50+: Medium correlation (🟡 Yellow)
0.25+: Weak correlation (🟠 Orange)
Below 0.25: Negative/no correlation (🔴 Red)
🔥 Correlation Heatmap (Bottom Right)
Visual matrix showing:
Gold vs. DXY, BTC, ETH
DXY vs. BTC, ETH
BTC vs. ETH
Color-coded strength
📈 Performance Tracker (Bottom Left)
Tracks individual asset momentum:
WT1 Values: Current momentum reading
Status: OB (overbought) / OS (oversold) / Normal
Trading Strategies
1. High-Probability Trend Following
✅ Entry Conditions:
WaveTrend bullish/bearish cross
HTF Alignment matches signal direction
Signal Quality > 70%
Correlation supports direction
2. Regime Change Trading
🎯 Watch for regime shifts:
Risk-Off → Risk-On = Consider long positions
High correlation → Low correlation = Reduce position size
Crypto-Risk-On = Focus on crypto longs
3. Divergence Trading
🔍 Look for:
Strong correlation breakdown = Potential volatility
Cross-asset correlation surge = Follow the leader
Volume-price correlation extremes = Trend confirmation
4. Overbought/Oversold Reversals
⚡ Trade reversals when:
WT crosses in extreme zones (-60/+60)
HTF alignment shows opposite trend weakening
Correlation confirms mean reversion setup
Customization Tips
Fine-Tuning Parameters
WaveTrend Core:
Channel Length (10): Lower = more sensitive, Higher = smoother
Average Length (21): Adjust for your timeframe
Correlation Settings:
Length (50): Longer = more stable, Shorter = more responsive
Smoothing (5): Reduce noise in correlation readings
Market Regime:
Risk-On Threshold (0.6): Lower = earlier regime signals
High Correlation Threshold (0.75): Adjust sensitivity
Custom Asset Selection
Replace default symbols with your preferred markets:
Major Assets: Any forex, indices, bonds
Crypto: Any digital currencies
Must use correct exchange prefix (e.g., BINANCE:BTCUSDT)
Alert System
Enable "Advanced Alerts" to receive notifications for:
✅ Market regime changes
✅ Correlation breakdowns/surges
✅ Strong signals with high correlation
✅ Extreme volume-price correlation
✅ Complete HTF alignment
Correlation Interpretation Guide
ValueMeaningTrading Implication+0.75 to +1.0Strong positiveAssets move together+0.5 to +0.75Moderate positiveGenerally aligned+0.25 to +0.5Weak positiveLoose relationship-0.25 to +0.25No correlationIndependent movements-0.5 to -0.25Weak negativeSlight inverse relationship-0.75 to -0.5Moderate negativeTend to move opposite-1.0 to -0.75Strong negativeStrongly inversely correlated
Best Practices
Use Multiple Timeframes: Check HTF alignment before trading
Confirm with Correlation: Strong signals work best with supportive correlations
Watch Regime Changes: Adjust strategy based on market conditions
Volume Matters: Enable volume-price correlation for confirmation
Quality Over Quantity: Trade only high-quality setups (>70% signal quality)
Common Patterns to Watch
🔵 Risk-On Environment:
Gold-BTC positive correlation
DXY negative correlation with risk assets
High crypto correlations
🔴 Risk-Off Environment:
Flight to safety (Gold up, stocks down)
DXY strength
Correlation breakdowns
🟡 Transition Periods:
Low correlation across assets
Mixed HTF signals
Use caution, reduce position sizes
Technical Notes
Calculation Period: Uses HLC3 (average of high, low, close)
Correlation Window: Rolling correlation over specified length
HTF Data: Accurately calculated using security() function
Performance: Optimized for real-time calculation on all timeframes
Support
For optimal performance:
Use on 15-minute to daily timeframes
Enable only needed asset groups
Adjust correlation length based on trading style
Combine with your existing strategy for confirmation
Enjoy comprehensive multi-asset analysis! 🚀

Smoothed Heikin Ashi + MA MTF📊 MTF Smoothed Heikin Ashi + MA Cross (SHA_MA)This indicator combines a double-smoothed Heikin Ashi (SHA) with the popular 50 and 200 Simple Moving Averages (SMAs), all wrapped in a robust Multi-Timeframe (MTF) engine.This tool is designed to help traders identify and confirm trend direction across multiple timeframes, providing cleaner signals than standard Heikin Ashi candles.
Key Features and BenefitsDouble-Smoothed Heikin Ashi (SHA):SHA candles are created by applying an Exponential Moving Average (EMA) twice to the standard Heikin Ashi calculation.This significantly filters out market noise and choppy price action, making trend reversals and continuations clearer and more reliable.Color Logic: Candles are colored green (lime) when the SHA Close is above the SHA Open (Bullish) and red when the Close is below the Open (Bearish).Multi-Timeframe (MTF) Capability:You can set the SHA candles, MA50, and MA200 to calculate on a higher timeframe (e.g., 4-Hour) while viewing your main chart on a lower timeframe (e.g., 15-Minute).This is crucial for ensuring your trades are aligned with the overall larger trend direction (top-down analysis).Self-Correction: The script automatically prevents errors by reverting the indicator to the chart's native timeframe if a timeframe lower than the chart's is mistakenly selected.Key Moving Averages:Includes the industry-standard 50 SMA (Fast) and 200 SMA (Slow).The crossover between the two MAs (Golden/Death Cross) acts as a powerful confirmation signal for the SHA trend.
⚙️ How to Use ItTrend Confirmation: Use the SHA candle color (Green/Red) to confirm the short-term trend.Long-Term Bias: Use the MA200 as the primary filter. Only look for long entries when price is above the MA200, and short entries when price is below it.MTF Alignment: Set the "Indicator Timeframe" input to a higher level (e.g., 4H or 1D) to ensure your entry timeframe is trading in the direction of the macro trend.CustomizationSettingDefault ValuePurposeIndicator TimeframeChartSet to a higher TF (e.g., 1h, 4h) for MTF analysis.SHA EMA Length 1 & 210Controls the level of smoothing applied to the candles. Higher values mean less noise but more lag.MA 50 & 200 Length50 & 200Standard Moving Average periods.\

Average Directional Index infoAverage Directional Index (ADX) is a technical indicator created by J. Welles Wilder that measures trend strength (not direction!). Values range from 0 to 100.
This indicator is a supplementary tool for assessing whether trend strategies are worthwhile, monitoring changes in trend strength and avoiding weak, choppy movements
Value Interpretation:
0-25: Weak trend or sideways market
25-50: Moderate to strong trend
50-75: Very strong trend
75-100: Extremely strong trend (rare)
Important: ADX does not indicate trend direction (up/down), only its strength!
This script indicator includes additional features:
1. ADX Plot (purple line)
Basic ADX value showing current trend strength.
2. ADX Trend Analysis (arrows)
The script compares current ADX with its 10-period moving average with ±5% tolerance:
↑ (green): ADX rising → trend strengthening
↓ (red): ADX falling → trend weakening
⮆ (gray): ADX stable → trend strength unchanged
3. Information Table
Displays current ADX value with trend arrow in the top-right corner.
Parameters to Configure
Smoothing (default: 14) - Indicator smoothing period
Lower values (e.g., 7): more sensitive, more signals
Higher values (e.g., 21): more stable, less noise
Indicator Length (default: 14) - Period for calculating directional movement (+DI/-DI)
Wilder's standard value is 14
Trend Length (default: 10) - Period for moving average to analyze ADX dynamics
Determines how quickly changes in trend strength are detected
Practical Application
✅ Strategy 1: Trend Strength Filter
1. ADX > 25 → look for positions aligned with the trend
2. ADX < 25 → avoid trend strategies, consider oscillators
✅ Strategy 2: Entries on Strengthening Trend
1. ADX crosses above 25 + arrow ↑ → trend gaining momentum
2. Combine with other indicators (e.g., EMA) for direction confirmation
✅ Strategy 3: Exhaustion Warning
1. ADX > 50 + arrow ↓ → strong trend may be exhausting
2. Consider profit protection or trailing stop

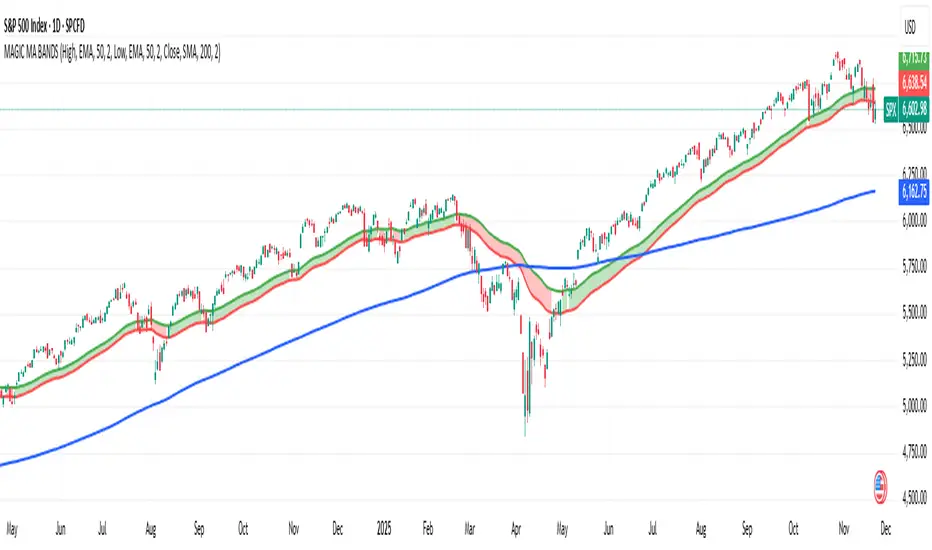
MAGIC MA BANDSMagic MA Bands — Dynamic Trend Zones Instead of Lines
Magic MA Bands help traders visualize dynamic support and resistance zones rather than relying on a single moving average line. Instead of treating the MA as an exact reaction level, this tool creates a band or zone where price is statistically more likely to react, reverse, or continue trending.
🧠 How It Works
The script plots:
Upper Band (default: 50 EMA using High values)
Lower Band (default: 50 EMA using Low values)
Optional Midline MA (default: 200 SMA for long-term trend)
The area between the upper and lower bands becomes a trend cushion, helping traders identify:
Dynamic support/resistance zones
Trend strength and continuation probability
Ideal pullback entry regions
🎯 Trend Interpretation Guide
Use Case Recommended Setting
Short-Term Trend 20/21 EMA or SMA
Medium-Term Trend 50 EMA / SMA
Long-Term Trend 200 SMA / EMA (Midline Optional)
All parameters are fully customisable so the user can define their preferred structure based on their trading style, asset volatility, or timeframe.
✔️ Best For:
Trend traders
Swing trading
Pullback-based entries
Institutional-style zone analysis
GBPUSD Weekly Cross LinesThis indicator tracks 20/50 EMA crossovers on GBPUSD (Weekly timeframe) and displays the crossover points across all symbols and timeframes, allowing traders to visually align current price action with key historical turning points in GBPUSD.
The script works by detecting bullish (20 EMA crossing above 50 EMA) and bearish (20 EMA crossing below 50 EMA) signals since 2010, using request.security() to source data from GBPUSD weekly candles, even if the indicator is applied to AAPL, EURJPY, BTCUSD, or any other asset.
Each crossover is marked with a vertical line that persists across all charts, offering a powerful way to:
Compare current market context with GBPUSD’s historical trend shifts
Observe intermarket correlations
Align trading timing across multiple assets
Spot macro trend transitions that ripple across global markets

Advanced Triple Strategy ScalperHere are the three scalping strategies presented in the video "3 Scalping Strategies That Work Every Day (Backtested & Proven)" by Asia Forex Mentor – Ezekiel Chew:
### Scalper’s Trend Filter (Triple EMA)
This strategy uses three EMAs (25, 50, 100) on the 5-minute chart to filter high-probability trades aligned with momentum .
- Only trade when all three EMAs are angled in the same direction and clearly separated (no crossing or tangling) .
- Enter when price pulls back toward the 25 or 50 EMA and then bounces back toward the 25 EMA, but do not enter if price closes below the 100 EMA .
- Set stop-loss just below the 50 EMA or swing low and aim for a risk-to-reward ratio of 1:1.5 .
### Flip Zone Trap (Reversal Catching)
This method identifies precise reversal moments where market structure shifts from weakness to strength .
- Use the 15-min chart to locate key support or resistance zones where price previously reacted .
- Wait for price to stop making lower lows and begin making higher highs (or vice versa for shorts); confirm with a trendline break AND follow-through (higher lows & highs within 5-7 candles) .
- Use confirmation candles (bullish engulfing, pin bar rejection) at the zone before entry .
### Liquidity Shift Trigger (Smart Money Trap)
This system leverages institutional stop hunts and liquidity sweeps at key zones for sniper entries .
- Start with a 15-min chart to identify structure breaks and points of interest (order blocks, flip zones, demand zones) .
- Drop to 1-min chart and wait for price to enter the refined zone and sweep liquidity (sharp wick/spike below/above key level) .
- Once liquidity is swept, wait for a clean structure shift (break of most recent internal high or low) within 5–6 candles—if confirmed, refine entry to the candle that caused the break and enter when price returns to that candle with a strong reaction .
***
### Practical Application
- These strategies are systematic, rule-based, and designed to cut out fake moves, avoid early stop-outs, and align entries with momentum and institutional activity .
- Perfect for short timeframes and volatile pairs like XAUUSD, especially if paired with additional confirmation from other technical analysis tools .
All three strategies emphasize filtering noise, waiting for momentum/trend confirmation, and avoiding impulsive entries—key principles for consistent scalping success

Kripto Fema ind/ This Pine Script™ code is subject to the terms of the Mozilla Public License 2.0 at mozilla.org
// © Femayakup
//@version=5
indicator(title = "Kripto Fema ind", shorttitle="Kripto Fema ind", overlay=true, format=format.price, precision=2,max_lines_count = 500, max_labels_count = 500, max_bars_back=500)
showEma200 = input(true, title="EMA 200")
showPmax = input(true, title="Pmax")
showLinreg = input(true, title="Linreg")
showMavilim = input(true, title="Mavilim")
showNadaray = input(true, title="Nadaraya Watson")
ma(source, length, type) =>
switch type
"SMA" => ta.sma(source, length)
"EMA" => ta.ema(source, length)
"SMMA (RMA)" => ta.rma(source, length)
"WMA" => ta.wma(source, length)
"VWMA" => ta.vwma(source, length)
//Ema200
timeFrame = input.timeframe(defval = '240',title= 'EMA200 TimeFrame',group = 'EMA200 Settings')
len200 = input.int(200, minval=1, title="Length",group = 'EMA200 Settings')
src200 = input(close, title="Source",group = 'EMA200 Settings')
offset200 = input.int(title="Offset", defval=0, minval=-500, maxval=500,group = 'EMA200 Settings')
out200 = ta.ema(src200, len200)
higherTimeFrame = request.security(syminfo.tickerid,timeFrame,out200 ,barmerge.gaps_on,barmerge.lookahead_on)
ema200Plot = showEma200 ? higherTimeFrame : na
plot(ema200Plot, title="EMA200", offset=offset200)
//Linreq
group1 = "Linreg Settings"
lengthInput = input.int(100, title="Length", minval = 1, maxval = 5000,group = group1)
sourceInput = input.source(close, title="Source")
useUpperDevInput = input.bool(true, title="Upper Deviation", inline = "Upper Deviation", group = group1)
upperMultInput = input.float(2.0, title="", inline = "Upper Deviation", group = group1)
useLowerDevInput = input.bool(true, title="Lower Deviation", inline = "Lower Deviation", group = group1)
lowerMultInput = input.float(2.0, title="", inline = "Lower Deviation", group = group1)
group2 = "Linreg Display Settings"
showPearsonInput = input.bool(true, "Show Pearson's R", group = group2)
extendLeftInput = input.bool(false, "Extend Lines Left", group = group2)
extendRightInput = input.bool(true, "Extend Lines Right", group = group2)
extendStyle = switch
extendLeftInput and extendRightInput => extend.both
extendLeftInput => extend.left
extendRightInput => extend.right
=> extend.none
group3 = "Linreg Color Settings"
colorUpper = input.color(color.new(color.blue, 85), "Linreg Renk", inline = group3, group = group3)
colorLower = input.color(color.new(color.red, 85), "", inline = group3, group = group3)
calcSlope(source, length) =>
max_bars_back(source, 5000)
if not barstate.islast or length <= 1
else
sumX = 0.0
sumY = 0.0
sumXSqr = 0.0
sumXY = 0.0
for i = 0 to length - 1 by 1
val = source
per = i + 1.0
sumX += per
sumY += val
sumXSqr += per * per
sumXY += val * per
slope = (length * sumXY - sumX * sumY) / (length * sumXSqr - sumX * sumX)
average = sumY / length
intercept = average - slope * sumX / length + slope
= calcSlope(sourceInput, lengthInput)
startPrice = i + s * (lengthInput - 1)
endPrice = i
var line baseLine = na
if na(baseLine) and not na(startPrice) and showLinreg
baseLine := line.new(bar_index - lengthInput + 1, startPrice, bar_index, endPrice, width=1, extend=extendStyle, color=color.new(colorLower, 0))
else
line.set_xy1(baseLine, bar_index - lengthInput + 1, startPrice)
line.set_xy2(baseLine, bar_index, endPrice)
na
calcDev(source, length, slope, average, intercept) =>
upDev = 0.0
dnDev = 0.0
stdDevAcc = 0.0
dsxx = 0.0
dsyy = 0.0
dsxy = 0.0
periods = length - 1
daY = intercept + slope * periods / 2
val = intercept
for j = 0 to periods by 1
price = high - val
if price > upDev
upDev := price
price := val - low
if price > dnDev
dnDev := price
price := source
dxt = price - average
dyt = val - daY
price -= val
stdDevAcc += price * price
dsxx += dxt * dxt
dsyy += dyt * dyt
dsxy += dxt * dyt
val += slope
stdDev = math.sqrt(stdDevAcc / (periods == 0 ? 1 : periods))
pearsonR = dsxx == 0 or dsyy == 0 ? 0 : dsxy / math.sqrt(dsxx * dsyy)
= calcDev(sourceInput, lengthInput, s, a, i)
upperStartPrice = startPrice + (useUpperDevInput ? upperMultInput * stdDev : upDev)
upperEndPrice = endPrice + (useUpperDevInput ? upperMultInput * stdDev : upDev)
var line upper = na
lowerStartPrice = startPrice + (useLowerDevInput ? -lowerMultInput * stdDev : -dnDev)
lowerEndPrice = endPrice + (useLowerDevInput ? -lowerMultInput * stdDev : -dnDev)
var line lower = na
if na(upper) and not na(upperStartPrice) and showLinreg
upper := line.new(bar_index - lengthInput + 1, upperStartPrice, bar_index, upperEndPrice, width=1, extend=extendStyle, color=color.new(colorUpper, 0))
else
line.set_xy1(upper, bar_index - lengthInput + 1, upperStartPrice)
line.set_xy2(upper, bar_index, upperEndPrice)
na
if na(lower) and not na(lowerStartPrice) and showLinreg
lower := line.new(bar_index - lengthInput + 1, lowerStartPrice, bar_index, lowerEndPrice, width=1, extend=extendStyle, color=color.new(colorUpper, 0))
else
line.set_xy1(lower, bar_index - lengthInput + 1, lowerStartPrice)
line.set_xy2(lower, bar_index, lowerEndPrice)
na
showLinregPlotUpper = showLinreg ? upper : na
showLinregPlotLower = showLinreg ? lower : na
showLinregPlotBaseLine = showLinreg ? baseLine : na
linefill.new(showLinregPlotUpper, showLinregPlotBaseLine, color = colorUpper)
linefill.new(showLinregPlotBaseLine, showLinregPlotLower, color = colorLower)
// Pearson's R
var label r = na
label.delete(r )
if showPearsonInput and not na(pearsonR) and showLinreg
r := label.new(bar_index - lengthInput + 1, lowerStartPrice, str.tostring(pearsonR, "#.################"), color = color.new(color.white, 100), textcolor=color.new(colorUpper, 0), size=size.normal, style=label.style_label_up)
//Mavilim
group4 = "Mavilim Settings"
mavilimold = input(false, title="Show Previous Version of MavilimW?",group=group4)
fmal=input(3,"First Moving Average length",group = group4)
smal=input(5,"Second Moving Average length",group = group4)
tmal=fmal+smal
Fmal=smal+tmal
Ftmal=tmal+Fmal
Smal=Fmal+Ftmal
M1= ta.wma(close, fmal)
M2= ta.wma(M1, smal)
M3= ta.wma(M2, tmal)
M4= ta.wma(M3, Fmal)
M5= ta.wma(M4, Ftmal)
MAVW= ta.wma(M5, Smal)
col1= MAVW>MAVW
col3= MAVWpmaxsrc ? pmaxsrc-pmaxsrc : 0
vdd1=pmaxsrc
ma = 0.0
if mav == "SMA"
ma := ta.sma(pmaxsrc, length)
ma
if mav == "EMA"
ma := ta.ema(pmaxsrc, length)
ma
if mav == "WMA"
ma := ta.wma(pmaxsrc, length)
ma
if mav == "TMA"
ma := ta.sma(ta.sma(pmaxsrc, math.ceil(length / 2)), math.floor(length / 2) + 1)
ma
if mav == "VAR"
ma := VAR
ma
if mav == "WWMA"
ma := WWMA
ma
if mav == "ZLEMA"
ma := ZLEMA
ma
if mav == "TSF"
ma := TSF
ma
ma
MAvg=getMA(pmaxsrc, length)
longStop = Normalize ? MAvg - Multiplier*atr/close : MAvg - Multiplier*atr
longStopPrev = nz(longStop , longStop)
longStop := MAvg > longStopPrev ? math.max(longStop, longStopPrev) : longStop
shortStop = Normalize ? MAvg + Multiplier*atr/close : MAvg + Multiplier*atr
shortStopPrev = nz(shortStop , shortStop)
shortStop := MAvg < shortStopPrev ? math.min(shortStop, shortStopPrev) : shortStop
dir = 1
dir := nz(dir , dir)
dir := dir == -1 and MAvg > shortStopPrev ? 1 : dir == 1 and MAvg < longStopPrev ? -1 : dir
PMax = dir==1 ? longStop: shortStop
plot(showsupport ? MAvg : na, color=#fbff04, linewidth=2, title="EMA9")
pALL=plot(PMax, color=color.new(color.red, transp = 0), linewidth=2, title="PMax")
alertcondition(ta.cross(MAvg, PMax), title="Cross Alert", message="PMax - Moving Avg Crossing!")
alertcondition(ta.crossover(MAvg, PMax), title="Crossover Alarm", message="Moving Avg BUY SIGNAL!")
alertcondition(ta.crossunder(MAvg, PMax), title="Crossunder Alarm", message="Moving Avg SELL SIGNAL!")
alertcondition(ta.cross(pmaxsrc, PMax), title="Price Cross Alert", message="PMax - Price Crossing!")
alertcondition(ta.crossover(pmaxsrc, PMax), title="Price Crossover Alarm", message="PRICE OVER PMax - BUY SIGNAL!")
alertcondition(ta.crossunder(pmaxsrc, PMax), title="Price Crossunder Alarm", message="PRICE UNDER PMax - SELL SIGNAL!")
buySignalk = ta.crossover(MAvg, PMax)
plotshape(buySignalk and showsignalsk ? PMax*0.995 : na, title="Buy", text="Buy", location=location.absolute, style=shape.labelup, size=size.tiny, color=color.new(color.green, transp = 0), textcolor=color.white)
sellSignallk = ta.crossunder(MAvg, PMax)
plotshape(sellSignallk and showsignalsk ? PMax*1.005 : na, title="Sell", text="Sell", location=location.absolute, style=shape.labeldown, size=size.tiny, color=color.new(color.red, transp = 0), textcolor=color.white)
// buySignalc = ta.crossover(pmaxsrc, PMax)
// plotshape(buySignalc and showsignalsc ? PMax*0.995 : na, title="Buy", text="Buy", location=location.absolute, style=shape.labelup, size=size.tiny, color=#0F18BF, textcolor=color.white)
// sellSignallc = ta.crossunder(pmaxsrc, PMax)
// plotshape(sellSignallc and showsignalsc ? PMax*1.005 : na, title="Sell", text="Sell", location=location.absolute, style=shape.labeldown, size=size.tiny, color=#0F18BF, textcolor=color.white)
// mPlot = plot(ohlc4, title="", style=plot.style_circles, linewidth=0,display=display.none)
longFillColor = highlighting ? (MAvg>PMax ? color.new(color.green, transp = 90) : na) : na
shortFillColor = highlighting ? (MAvg math.exp(-(math.pow(x, 2)/(h * h * 2)))
//-----------------------------------------------------------------------------}
//Append lines
//-----------------------------------------------------------------------------{
n = bar_index
var ln = array.new_line(0)
if barstate.isfirst and repaint
for i = 0 to 499
array.push(ln,line.new(na,na,na,na))
//-----------------------------------------------------------------------------}
//End point method
//-----------------------------------------------------------------------------{
var coefs = array.new_float(0)
var den = 0.
if barstate.isfirst and not repaint
for i = 0 to 499
w = gauss(i, h)
coefs.push(w)
den := coefs.sum()
out = 0.
if not repaint
for i = 0 to 499
out += src * coefs.get(i)
out /= den
mae = ta.sma(math.abs(src - out), 499) * mult
upperN = out + mae
lowerN = out - mae
//-----------------------------------------------------------------------------}
//Compute and display NWE
//-----------------------------------------------------------------------------{
float y2 = na
float y1 = na
nwe = array.new(0)
if barstate.islast and repaint
sae = 0.
//Compute and set NWE point
for i = 0 to math.min(499,n - 1)
sum = 0.
sumw = 0.
//Compute weighted mean
for j = 0 to math.min(499,n - 1)
w = gauss(i - j, h)
sum += src * w
sumw += w
y2 := sum / sumw
sae += math.abs(src - y2)
nwe.push(y2)
sae := sae / math.min(499,n - 1) * mult
for i = 0 to math.min(499,n - 1)
if i%2 and showNadaray
line.new(n-i+1, y1 + sae, n-i, nwe.get(i) + sae, color = upCss)
line.new(n-i+1, y1 - sae, n-i, nwe.get(i) - sae, color = dnCss)
if src > nwe.get(i) + sae and src < nwe.get(i) + sae and showNadaray
label.new(n-i, src , '▼', color = color(na), style = label.style_label_down, textcolor = dnCss, textalign = text.align_center)
if src < nwe.get(i) - sae and src > nwe.get(i) - sae and showNadaray
label.new(n-i, src , '▲', color = color(na), style = label.style_label_up, textcolor = upCss, textalign = text.align_center)
y1 := nwe.get(i)
//-----------------------------------------------------------------------------}
//Dashboard
//-----------------------------------------------------------------------------{
var tb = table.new(position.top_right, 1, 1
, bgcolor = #1e222d
, border_color = #373a46
, border_width = 1
, frame_color = #373a46
, frame_width = 1)
if repaint
tb.cell(0, 0, 'Repainting Mode Enabled', text_color = color.white, text_size = size.small)
//-----------------------------------------------------------------------------}
//Plot
//-----------------------------------------------------------------------------}
// plot(repaint ? na : out + mae, 'Upper', upCss)
// plot(repaint ? na : out - mae, 'Lower', dnCss)
//Crossing Arrows
// plotshape(ta.crossunder(close, out - mae) ? low : na, "Crossunder", shape.labelup, location.absolute, color(na), 0 , text = '▲', textcolor = upCss, size = size.tiny)
// plotshape(ta.crossover(close, out + mae) ? high : na, "Crossover", shape.labeldown, location.absolute, color(na), 0 , text = '▼', textcolor = dnCss, size = size.tiny)
//-----------------------------------------------------------------------------}
//////////////////////////////////////////////////////////////////////////////////
enableD = input (true, "DIVERGANCE ON/OFF" , group="INDICATORS ON/OFF")
//DIVERGANCE
prd1 = input.int (defval=5 , title='PIVOT PERIOD' , minval=1, maxval=50 , group="DIVERGANCE")
source = input.string(defval='HIGH/LOW' , title='SOURCE FOR PIVOT POINTS' , options= , group="DIVERGANCE")
searchdiv = input.string(defval='REGULAR/HIDDEN', title='DIVERGANCE TYPE' , options= , group="DIVERGANCE")
showindis = input.string(defval='FULL' , title='SHOW INDICATORS NAME' , options= , group="DIVERGANCE")
showlimit = input.int(1 , title='MINIMUM NUMBER OF DIVERGANCES', minval=1, maxval=11 , group="DIVERGANCE")
maxpp = input.int (defval=20 , title='MAXIMUM PIVOT POINTS TO CHECK', minval=1, maxval=20 , group="DIVERGANCE")
maxbars = input.int (defval=200 , title='MAXIMUM BARS TO CHECK' , minval=30, maxval=200 , group="DIVERGANCE")
showlast = input (defval=false , title='SHOW ONLY LAST DIVERGANCE' , group="DIVERGANCE")
dontconfirm = input (defval=false , title="DON'T WAIT FOR CONFORMATION" , group="DIVERGANCE")
showlines = input (defval=false , title='SHOW DIVERGANCE LINES' , group="DIVERGANCE")
showpivot = input (defval=false , title='SHOW PIVOT POINTS' , group="DIVERGANCE")
calcmacd = input (defval=true , title='MACD' , group="DIVERGANCE")
calcmacda = input (defval=true , title='MACD HISTOGRAM' , group="DIVERGANCE")
calcrsi = input (defval=true , title='RSI' , group="DIVERGANCE")
calcstoc = input (defval=true , title='STOCHASTIC' , group="DIVERGANCE")
calccci = input (defval=true , title='CCI' , group="DIVERGANCE")
calcmom = input (defval=true , title='MOMENTUM' , group="DIVERGANCE")
calcobv = input (defval=true , title='OBV' , group="DIVERGANCE")
calcvwmacd = input (true , title='VWMACD' , group="DIVERGANCE")
calccmf = input (true , title='CHAIKIN MONEY FLOW' , group="DIVERGANCE")
calcmfi = input (true , title='MONEY FLOW INDEX' , group="DIVERGANCE")
calcext = input (false , title='CHECK EXTERNAL INDICATOR' , group="DIVERGANCE")
externalindi = input (defval=close , title='EXTERNAL INDICATOR' , group="DIVERGANCE")
pos_reg_div_col = input (defval=#ffffff , title='POSITIVE REGULAR DIVERGANCE' , group="DIVERGANCE")
neg_reg_div_col = input (defval=#00def6 , title='NEGATIVE REGULAR DIVERGANCE' , group="DIVERGANCE")
pos_hid_div_col = input (defval=#00ff0a , title='POSITIVE HIDDEN DIVERGANCE' , group="DIVERGANCE")
neg_hid_div_col = input (defval=#ff0015 , title='NEGATIVE HIDDEN DIVERGANCE' , group="DIVERGANCE")
reg_div_l_style_ = input.string(defval='SOLID' , title='REGULAR DIVERGANCE LINESTYLE' , options= , group="DIVERGANCE")
hid_div_l_style_ = input.string(defval='SOLID' , title='HIDDEN DIVERGANCE LINESTYLE' , options= , group="DIVERGANCE")
reg_div_l_width = input.int (defval=2 , title='REGULAR DIVERGANCE LINEWIDTH' , minval=1, maxval=5 , group="DIVERGANCE")
hid_div_l_width = input.int (defval=2 , title='HIDDEN DIVERGANCE LINEWIDTH' , minval=1, maxval=5 , group="DIVERGANCE")
showmas = input.bool (defval=false , title='SHOW MOVING AVERAGES (50 & 200)', inline='MA' , group="DIVERGANCE")
cma1col = input.color (defval=#ffffff , title='' , inline='MA' , group="DIVERGANCE")
cma2col = input.color (defval=#00def6 , title='' , inline='MA' , group="DIVERGANCE")
//PLOTS
plot(showmas ? ta.sma(close, 50) : na, color=showmas ? cma1col : na)
plot(showmas ? ta.sma(close, 200) : na, color=showmas ? cma2col : na)
var reg_div_l_style = reg_div_l_style_ == 'SOLID' ? line.style_solid : reg_div_l_style_ == 'DASHED' ? line.style_dashed : line.style_dotted
var hid_div_l_style = hid_div_l_style_ == 'SOLID' ? line.style_solid : hid_div_l_style_ == 'DASHED' ? line.style_dashed : line.style_dotted
rsi = ta.rsi(close, 14)
= ta.macd(close, 12, 26, 9)
moment = ta.mom(close, 10)
cci = ta.cci(close, 10)
Obv = ta.obv
stk = ta.sma(ta.stoch(close, high, low, 14), 3)
maFast = ta.vwma(close, 12)
maSlow = ta.vwma(close, 26)
vwmacd = maFast - maSlow
Cmfm = (close - low - (high - close)) / (high - low)
Cmfv = Cmfm * volume
cmf = ta.sma(Cmfv, 21) / ta.sma(volume, 21)
Mfi = ta.mfi(close, 14)
var indicators_name = array.new_string(11)
var div_colors = array.new_color(4)
if barstate.isfirst and enableD
array.set(indicators_name, 0, showindis == "DON'T SHOW" ? '' : '')
array.set(indicators_name, 1, showindis == "DON'T SHOW" ? '' : '')
array.set(indicators_name, 2, showindis == "DON'T SHOW" ? '' : '')
array.set(indicators_name, 3, showindis == "DON'T SHOW" ? '' : '')
array.set(indicators_name, 4, showindis == "DON'T SHOW" ? '' : '')
array.set(indicators_name, 5, showindis == "DON'T SHOW" ? '' : '')
array.set(indicators_name, 6, showindis == "DON'T SHOW" ? '' : '')
array.set(indicators_name, 7, showindis == "DON'T SHOW" ? '' : '')
array.set(indicators_name, 8, showindis == "DON'T SHOW" ? '' : '')
array.set(indicators_name, 9, showindis == "DON'T SHOW" ? '' : '')
array.set(indicators_name, 10, showindis == "DON'T SHOW" ? '' : '')
array.set(div_colors, 0, pos_reg_div_col)
array.set(div_colors, 1, neg_reg_div_col)
array.set(div_colors, 2, pos_hid_div_col)
array.set(div_colors, 3, neg_hid_div_col)
float ph1 = ta.pivothigh(source == 'CLOSE' ? close : high, prd1, prd1)
float pl1 = ta.pivotlow(source == 'CLOSE' ? close : low, prd1, prd1)
plotshape(ph1 and showpivot, text='H', style=shape.labeldown, color=color.new(color.white, 100), textcolor=#00def6, location=location.abovebar, offset=-prd1)
plotshape(pl1 and showpivot, text='L', style=shape.labelup, color=color.new(color.white, 100), textcolor=#ffffff, location=location.belowbar, offset=-prd1)
var int maxarraysize = 20
var ph_positions = array.new_int(maxarraysize, 0)
var pl_positions = array.new_int(maxarraysize, 0)
var ph_vals = array.new_float(maxarraysize, 0.)
var pl_vals = array.new_float(maxarraysize, 0.)
if ph1
array.unshift(ph_positions, bar_index)
array.unshift(ph_vals, ph1)
if array.size(ph_positions) > maxarraysize
array.pop(ph_positions)
array.pop(ph_vals)
if pl1
array.unshift(pl_positions, bar_index)
array.unshift(pl_vals, pl1)
if array.size(pl_positions) > maxarraysize
array.pop(pl_positions)
array.pop(pl_vals)
positive_regular_positive_hidden_divergence(src, cond) =>
divlen = 0
prsc = source == 'CLOSE' ? close : low
if dontconfirm or src > src or close > close
startpoint = dontconfirm ? 0 : 1
for x = 0 to maxpp - 1 by 1
len = bar_index - array.get(pl_positions, x) + prd1
if array.get(pl_positions, x) == 0 or len > maxbars
break
if len > 5 and (cond == 1 and src > src and prsc < nz(array.get(pl_vals, x)) or cond == 2 and src < src and prsc > nz(array.get(pl_vals, x)))
slope1 = (src - src ) / (len - startpoint)
virtual_line1 = src - slope1
slope2 = (close - close ) / (len - startpoint)
virtual_line2 = close - slope2
arrived = true
for y = 1 + startpoint to len - 1 by 1
if src < virtual_line1 or nz(close ) < virtual_line2
arrived := false
break
virtual_line1 -= slope1
virtual_line2 -= slope2
virtual_line2
if arrived
divlen := len
break
divlen
negative_regular_negative_hidden_divergence(src, cond) =>
divlen = 0
prsc = source == 'CLOSE' ? close : high
if dontconfirm or src < src or close < close
startpoint = dontconfirm ? 0 : 1
for x = 0 to maxpp - 1 by 1
len = bar_index - array.get(ph_positions, x) + prd1
if array.get(ph_positions, x) == 0 or len > maxbars
break
if len > 5 and (cond == 1 and src < src and prsc > nz(array.get(ph_vals, x)) or cond == 2 and src > src and prsc < nz(array.get(ph_vals, x)))
slope1 = (src - src ) / (len - startpoint)
virtual_line1 = src - slope1
slope2 = (close - nz(close )) / (len - startpoint)
virtual_line2 = close - slope2
arrived = true
for y = 1 + startpoint to len - 1 by 1
if src > virtual_line1 or nz(close ) > virtual_line2
arrived := false
break
virtual_line1 -= slope1
virtual_line2 -= slope2
virtual_line2
if arrived
divlen := len
break
divlen
//CALCULATIONS
calculate_divs(cond, indicator_1) =>
divs = array.new_int(4, 0)
array.set(divs, 0, cond and (searchdiv == 'REGULAR' or searchdiv == 'REGULAR/HIDDEN') ? positive_regular_positive_hidden_divergence(indicator_1, 1) : 0)
array.set(divs, 1, cond and (searchdiv == 'REGULAR' or searchdiv == 'REGULAR/HIDDEN') ? negative_regular_negative_hidden_divergence(indicator_1, 1) : 0)
array.set(divs, 2, cond and (searchdiv == 'HIDDEN' or searchdiv == 'REGULAR/HIDDEN') ? positive_regular_positive_hidden_divergence(indicator_1, 2) : 0)
array.set(divs, 3, cond and (searchdiv == 'HIDDEN' or searchdiv == 'REGULAR/HIDDEN') ? negative_regular_negative_hidden_divergence(indicator_1, 2) : 0)
divs
var all_divergences = array.new_int(44)
array_set_divs(div_pointer, index) =>
for x = 0 to 3 by 1
array.set(all_divergences, index * 4 + x, array.get(div_pointer, x))
array_set_divs(calculate_divs(calcmacd , macd) , 0)
array_set_divs(calculate_divs(calcmacda , deltamacd) , 1)
array_set_divs(calculate_divs(calcrsi , rsi) , 2)
array_set_divs(calculate_divs(calcstoc , stk) , 3)
array_set_divs(calculate_divs(calccci , cci) , 4)
array_set_divs(calculate_divs(calcmom , moment) , 5)
array_set_divs(calculate_divs(calcobv , Obv) , 6)
array_set_divs(calculate_divs(calcvwmacd, vwmacd) , 7)
array_set_divs(calculate_divs(calccmf , cmf) , 8)
array_set_divs(calculate_divs(calcmfi , Mfi) , 9)
array_set_divs(calculate_divs(calcext , externalindi), 10)
total_div = 0
for x = 0 to array.size(all_divergences) - 1 by 1
total_div += math.round(math.sign(array.get(all_divergences, x)))
total_div
if total_div < showlimit
array.fill(all_divergences, 0)
var pos_div_lines = array.new_line(0)
var neg_div_lines = array.new_line(0)
var pos_div_labels = array.new_label(0)
var neg_div_labels = array.new_label(0)
delete_old_pos_div_lines() =>
if array.size(pos_div_lines) > 0
for j = 0 to array.size(pos_div_lines) - 1 by 1
line.delete(array.get(pos_div_lines, j))
array.clear(pos_div_lines)
delete_old_neg_div_lines() =>
if array.size(neg_div_lines) > 0
for j = 0 to array.size(neg_div_lines) - 1 by 1
line.delete(array.get(neg_div_lines, j))
array.clear(neg_div_lines)
delete_old_pos_div_labels() =>
if array.size(pos_div_labels) > 0
for j = 0 to array.size(pos_div_labels) - 1 by 1
label.delete(array.get(pos_div_labels, j))
array.clear(pos_div_labels)
delete_old_neg_div_labels() =>
if array.size(neg_div_labels) > 0
for j = 0 to array.size(neg_div_labels) - 1 by 1
label.delete(array.get(neg_div_labels, j))
array.clear(neg_div_labels)
delete_last_pos_div_lines_label(n) =>
if n > 0 and array.size(pos_div_lines) >= n
asz = array.size(pos_div_lines)
for j = 1 to n by 1
line.delete(array.get(pos_div_lines, asz - j))
array.pop(pos_div_lines)
if array.size(pos_div_labels) > 0
label.delete(array.get(pos_div_labels, array.size(pos_div_labels) - 1))
array.pop(pos_div_labels)
delete_last_neg_div_lines_label(n) =>
if n > 0 and array.size(neg_div_lines) >= n
asz = array.size(neg_div_lines)
for j = 1 to n by 1
line.delete(array.get(neg_div_lines, asz - j))
array.pop(neg_div_lines)
if array.size(neg_div_labels) > 0
label.delete(array.get(neg_div_labels, array.size(neg_div_labels) - 1))
array.pop(neg_div_labels)
pos_reg_div_detected = false
neg_reg_div_detected = false
pos_hid_div_detected = false
neg_hid_div_detected = false
var last_pos_div_lines = 0
var last_neg_div_lines = 0
var remove_last_pos_divs = false
var remove_last_neg_divs = false
if pl1
remove_last_pos_divs := false
last_pos_div_lines := 0
last_pos_div_lines
if ph1
remove_last_neg_divs := false
last_neg_div_lines := 0
last_neg_div_lines
divergence_text_top = ''
divergence_text_bottom = ''
distances = array.new_int(0)
dnumdiv_top = 0
dnumdiv_bottom = 0
top_label_col = color.white
bottom_label_col = color.white
old_pos_divs_can_be_removed = true
old_neg_divs_can_be_removed = true
startpoint = dontconfirm ? 0 : 1
for x = 0 to 10 by 1
div_type = -1
for y = 0 to 3 by 1
if array.get(all_divergences, x * 4 + y) > 0
div_type := y
if y % 2 == 1
dnumdiv_top += 1
top_label_col := array.get(div_colors, y)
top_label_col
if y % 2 == 0
dnumdiv_bottom += 1
bottom_label_col := array.get(div_colors, y)
bottom_label_col
if not array.includes(distances, array.get(all_divergences, x * 4 + y))
array.push(distances, array.get(all_divergences, x * 4 + y))
new_line = showlines ? line.new(x1=bar_index - array.get(all_divergences, x * 4 + y), y1=source == 'CLOSE' ? close : y % 2 == 0 ? low : high , x2=bar_index - startpoint, y2=source == 'CLOSE' ? close : y % 2 == 0 ? low : high , color=array.get(div_colors, y), style=y < 2 ? reg_div_l_style : hid_div_l_style, width=y < 2 ? reg_div_l_width : hid_div_l_width) : na
if y % 2 == 0
if old_pos_divs_can_be_removed
old_pos_divs_can_be_removed := false
if not showlast and remove_last_pos_divs
delete_last_pos_div_lines_label(last_pos_div_lines)
last_pos_div_lines := 0
last_pos_div_lines
if showlast
delete_old_pos_div_lines()
array.push(pos_div_lines, new_line)
last_pos_div_lines += 1
remove_last_pos_divs := true
remove_last_pos_divs
if y % 2 == 1
if old_neg_divs_can_be_removed
old_neg_divs_can_be_removed := false
if not showlast and remove_last_neg_divs
delete_last_neg_div_lines_label(last_neg_div_lines)
last_neg_div_lines := 0
last_neg_div_lines
if showlast
delete_old_neg_div_lines()
array.push(neg_div_lines, new_line)
last_neg_div_lines += 1
remove_last_neg_divs := true
remove_last_neg_divs
if y == 0
pos_reg_div_detected := true
pos_reg_div_detected
if y == 1
neg_reg_div_detected := true
neg_reg_div_detected
if y == 2
pos_hid_div_detected := true
pos_hid_div_detected
if y == 3
neg_hid_div_detected := true
neg_hid_div_detected
if div_type >= 0
divergence_text_top += (div_type % 2 == 1 ? showindis != "DON'T SHOW" ? array.get(indicators_name, x) + '\n' : '' : '')
divergence_text_bottom += (div_type % 2 == 0 ? showindis != "DON'T SHOW" ? array.get(indicators_name, x) + '\n' : '' : '')
divergence_text_bottom
if showindis != "DON'T SHOW"
if dnumdiv_top > 0
divergence_text_top += str.tostring(dnumdiv_top)
divergence_text_top
if dnumdiv_bottom > 0
divergence_text_bottom += str.tostring(dnumdiv_bottom)
divergence_text_bottom
if divergence_text_top != ''
if showlast
delete_old_neg_div_labels()
array.push(neg_div_labels, label.new(x=bar_index, y=math.max(high, high ), color=top_label_col, style=label.style_diamond, size = size.auto))
if divergence_text_bottom != ''
if showlast
delete_old_pos_div_labels()
array.push(pos_div_labels, label.new(x=bar_index, y=math.min(low, low ), color=bottom_label_col, style=label.style_diamond, size = size.auto))
// POSITION AND SIZE
PosTable = input.string(defval="Bottom Right", title="Position", options= , group="Table Location & Size", inline="1")
SizTable = input.string(defval="Auto", title="Size", options= , group="Table Location & Size", inline="1")
Pos1Table = PosTable == "Top Right" ? position.top_right : PosTable == "Middle Right" ? position.middle_right : PosTable == "Bottom Right" ? position.bottom_right : PosTable == "Top Center" ? position.top_center : PosTable == "Middle Center" ? position.middle_center : PosTable == "Bottom Center" ? position.bottom_center : PosTable == "Top Left" ? position.top_left : PosTable == "Middle Left" ? position.middle_left : position.bottom_left
Siz1Table = SizTable == "Auto" ? size.auto : SizTable == "Huge" ? size.huge : SizTable == "Large" ? size.large : SizTable == "Normal" ? size.normal : SizTable == "Small" ? size.small : size.tiny
tbl = table.new(Pos1Table, 21, 16, border_width = 1, border_color = color.gray, frame_color = color.gray, frame_width = 1)
// Kullanıcı tarafından belirlenecek yeşil ve kırmızı zaman dilimi sayısı
greenThreshold = input.int(5, minval=1, maxval=10, title="Yeşil Zaman Dilimi Sayısı", group="Alarm Ayarları")
redThreshold = input.int(5, minval=1, maxval=10, title="Kırmızı Zaman Dilimi Sayısı", group="Alarm Ayarları")
// TIMEFRAMES OPTIONS
box01 = input.bool(true, "TF ", inline = "01", group="Select Timeframe")
tf01 = input.timeframe("1", "", inline = "01", group="Select Timeframe")
box02 = input.bool(false, "TF ", inline = "02", group="Select Timeframe")
tf02 = input.timeframe("3", "", inline = "02", group="Select Timeframe")
box03 = input.bool(true, "TF ", inline = "03", group="Select Timeframe")
tf03 = input.timeframe("5", "", inline = "03", group="Select Timeframe")
box04 = input.bool(true, "TF ", inline = "04", group="Select Timeframe")
tf04 = input.timeframe("15", "", inline = "04", group="Select Timeframe")
box05 = input.bool(false, "TF ", inline = "05", group="Select Timeframe")
tf05 = input.timeframe("30", "", inline = "05", group="Select Timeframe")
box06 = input.bool(true, "TF ", inline = "01", group="Select Timeframe")
tf06 = input.timeframe("60", "", inline = "01", group="Select Timeframe")
box07 = input.bool(false, "TF ", inline = "02", group="Select Timeframe")
tf07 = input.timeframe("120", "", inline = "02", group="Select Timeframe")
box08 = input.bool(false, "TF ", inline = "03", group="Select Timeframe")
tf08 = input.timeframe("180", "", inline = "03", group="Select Timeframe")
box09 = input.bool(true, "TF ", inline = "04", group="Select Timeframe")
tf09 = input.timeframe("240", "", inline = "04", group="Select Timeframe")
box10 = input.bool(false, "TF ", inline = "05", group="Select Timeframe")
tf10 = input.timeframe("D", "", inline = "05", group="Select Timeframe")
// indicator('Tillson FEMA', overlay=true)
length1 = input(1, 'FEMA Length')
a1 = input(0.7, 'Volume Factor')
e1 = ta.ema((high + low + 2 * close) / 4, length1)
e2 = ta.ema(e1, length1)
e3 = ta.ema(e2, length1)
e4 = ta.ema(e3, length1)
e5 = ta.ema(e4, length1)
e6 = ta.ema(e5, length1)
c1 = -a1 * a1 * a1
c2 = 3 * a1 * a1 + 3 * a1 * a1 * a1
c3 = -6 * a1 * a1 - 3 * a1 - 3 * a1 * a1 * a1
c4 = 1 + 3 * a1 + a1 * a1 * a1 + 3 * a1 * a1
FEMA = c1 * e6 + c2 * e5 + c3 * e4 + c4 * e3
tablocol1 = FEMA > FEMA
tablocol3 = FEMA < FEMA
color_1 = col1 ? color.rgb(149, 219, 35): col3 ? color.rgb(238, 11, 11) : color.yellow
plot(FEMA, color=color_1, linewidth=3, title='FEMA')
tilson1 = FEMA
tilson1a =FEMA
// DEFINITION OF VALUES
symbol = ticker.modify(syminfo.tickerid, syminfo.session)
tfArr = array.new(na)
tilson1Arr = array.new(na)
tilson1aArr = array.new(na)
// DEFINITIONS OF RSI & CCI FUNCTIONS APPENDED IN THE TIMEFRAME OPTIONS
cciNcciFun(tf, flg) =>
= request.security(symbol, tf, )
if flg and (barstate.isrealtime ? true : timeframe.in_seconds(timeframe.period) <= timeframe.in_seconds(tf))
array.push(tfArr, na(tf) ? timeframe.period : tf)
array.push(tilson1Arr, tilson_)
array.push(tilson1aArr, tilson1a_)
cciNcciFun(tf01, box01), cciNcciFun(tf02, box02), cciNcciFun(tf03, box03), cciNcciFun(tf04, box04),
cciNcciFun(tf05, box05), cciNcciFun(tf06, box06), cciNcciFun(tf07, box07), cciNcciFun(tf08, box08),
cciNcciFun(tf09, box09), cciNcciFun(tf10, box10)
// TABLE AND CELLS CONFIG
// Post Timeframe in format
tfTxt(x)=>
out = x
if not str.contains(x, "S") and not str.contains(x, "M") and
not str.contains(x, "W") and not str.contains(x, "D")
if str.tonumber(x)%60 == 0
out := str.tostring(str.tonumber(x)/60)+"H"
else
out := x + "m"
out
if barstate.islast
table.clear(tbl, 0, 0, 20, 15)
// TITLES
table.cell(tbl, 0, 0, "⏱", text_color=color.white, text_size=Siz1Table, bgcolor=#000000)
table.cell(tbl, 1, 0, "FEMA("+str.tostring(length1)+")", text_color=#FFFFFF, text_size=Siz1Table, bgcolor=#000000)
j = 1
greenCounter = 0 // Yeşil zaman dilimlerini saymak için bir sayaç
redCounter = 0
if array.size(tilson1Arr) > 0
for i = 0 to array.size(tilson1Arr) - 1
if not na(array.get(tilson1Arr, i))
//config values in the cells
TF_VALUE = array.get(tfArr,i)
tilson1VALUE = array.get(tilson1Arr, i)
tilson1aVALUE = array.get(tilson1aArr, i)
SIGNAL1 = tilson1VALUE >= tilson1aVALUE ? "▲" : tilson1VALUE <= tilson1aVALUE ? "▼" : na
// Yeşil oklar ve arka planı ayarla
greenArrowColor1 = SIGNAL1 == "▲" ? color.rgb(0, 255, 0) : color.rgb(255, 0, 0)
greenBgColor1 = SIGNAL1 == "▲" ? color.rgb(25, 70, 22) : color.rgb(93, 22, 22)
allGreen = tilson1VALUE >= tilson1aVALUE
allRed = tilson1VALUE <= tilson1aVALUE
// Determine background color for time text
timeBgColor = allGreen ? #194616 : (allRed ? #5D1616 : #000000)
txtColor = allGreen ? #00FF00 : (allRed ? #FF4500 : color.white)
if allGreen
greenCounter := greenCounter + 1
redCounter := 0
else if allRed
redCounter := redCounter + 1
greenCounter := 0
else
redCounter := 0
greenCounter := 0
// Dinamik pair değerini oluşturma
pair = "USDT_" + syminfo.basecurrency + "USDT"
// Bot ID için kullanıcı girişi
bot_id = input.int(12387976, title="Bot ID", minval=0,group ='3Comas Message', inline = '1') // Varsayılan değeri 12387976 olan bir tamsayı girişi alır
// E-posta tokenı için kullanıcı girişi
email_token = input("cd4111d4-549a-4759-a082-e8f45c91fa47", title="Email Token",group ='3Comas Message', inline = '1')
// USER INPUT FOR DELAY
delay_seconds = input.int(0, title="Delay Seconds", minval=0, maxval=86400,group ='3Comas Message', inline = '1')
// Dinamik mesajın oluşturulması
message = '{ "message_type": "bot", "bot_id": ' + str.tostring(bot_id) + ', "email_token": "' + email_token + '", "delay_seconds": ' + str.tostring(delay_seconds) + ', "pair": "' + pair + '"}'
// Kullanıcının belirlediği yeşil veya kırmızı zaman dilimi sayısına ulaşıldığında alarmı tetikle
if greenCounter >= greenThreshold
alert(message, alert.freq_once_per_bar_close)
// if redCounter >= redThreshold
// alert(message, alert.freq_once_per_bar_close)
// Kullanıcının belirlediği yeşil veya kırmızı zaman dilimi sayısına ulaşıldığında alarmı tetikle
// if greenCounter >= greenThreshold
// alert("Yeşil zaman dilimi sayısı " + str.tostring(greenThreshold) + " adede ulaştı", alert.freq_once_per_bar_close)
// if redCounter >= redThreshold
// alert("Kırmızı zaman dilimi sayısı " + str.tostring(redThreshold) + " adede ulaştı", alert.freq_once_per_bar_close)
table.cell(tbl, 0, j, tfTxt(TF_VALUE), text_color=txtColor, text_halign=text.align_left, text_size=Siz1Table, bgcolor=timeBgColor)
table.cell(tbl, 1, j, str.tostring(tilson1VALUE, "#.#######")+SIGNAL1, text_color=greenArrowColor1, text_halign=text.align_right, text_size=Siz1Table, bgcolor=greenBgColor1)
j += 1
prd = input.int(defval=10, title='Pivot Period', minval=4, maxval=30, group='Setup')
ppsrc = input.string(defval='High/Low', title='Source', options= , group='Setup')
maxnumpp = input.int(defval=20, title=' Maximum Number of Pivot', minval=5, maxval=100, group='Setup')
ChannelW = input.int(defval=10, title='Maximum Channel Width %', minval=1, group='Setup')
maxnumsr = input.int(defval=5, title=' Maximum Number of S/R', minval=1, maxval=10, group='Setup')
min_strength = input.int(defval=2, title=' Minimum Strength', minval=1, maxval=10, group='Setup')
labelloc = input.int(defval=20, title='Label Location', group='Colors', tooltip='Positive numbers reference future bars, negative numbers reference histical bars')
linestyle = input.string(defval='Dashed', title='Line Style', options= , group='Colors')
linewidth = input.int(defval=2, title='Line Width', minval=1, maxval=4, group='Colors')
resistancecolor = input.color(defval=color.red, title='Resistance Color', group='Colors')
supportcolor = input.color(defval=color.lime, title='Support Color', group='Colors')
showpp = input(false, title='Show Point Points')
float src1 = ppsrc == 'High/Low' ? high : math.max(close, open)
float src2 = ppsrc == 'High/Low' ? low : math.min(close, open)
float ph = ta.pivothigh(src1, prd, prd)
float pl = ta.pivotlow(src2, prd, prd)
plotshape(ph and showpp, text='H', style=shape.labeldown, color=na, textcolor=color.new(color.red, 0), location=location.abovebar, offset=-prd)
plotshape(pl and showpp, text='L', style=shape.labelup, color=na, textcolor=color.new(color.lime, 0), location=location.belowbar, offset=-prd)
Lstyle = linestyle == 'Dashed' ? line.style_dashed : linestyle == 'Solid' ? line.style_solid : line.style_dotted
//calculate maximum S/R channel zone width
prdhighest = ta.highest(300)
prdlowest = ta.lowest(300)
cwidth = (prdhighest - prdlowest) * ChannelW / 100
var pivotvals = array.new_float(0)
if ph or pl
array.unshift(pivotvals, ph ? ph : pl)
if array.size(pivotvals) > maxnumpp // limit the array size
array.pop(pivotvals)
get_sr_vals(ind) =>
float lo = array.get(pivotvals, ind)
float hi = lo
int numpp = 0
for y = 0 to array.size(pivotvals) - 1 by 1
float cpp = array.get(pivotvals, y)
float wdth = cpp <= lo ? hi - cpp : cpp - lo
if wdth <= cwidth // fits the max channel width?
if cpp <= hi
lo := math.min(lo, cpp)
else
hi := math.max(hi, cpp)
numpp += 1
numpp
var sr_up_level = array.new_float(0)
var sr_dn_level = array.new_float(0)
sr_strength = array.new_float(0)
find_loc(strength) =>
ret = array.size(sr_strength)
for i = ret > 0 ? array.size(sr_strength) - 1 : na to 0 by 1
if strength <= array.get(sr_strength, i)
break
ret := i
ret
ret
check_sr(hi, lo, strength) =>
ret = true
for i = 0 to array.size(sr_up_level) > 0 ? array.size(sr_up_level) - 1 : na by 1
//included?
if array.get(sr_up_level, i) >= lo and array.get(sr_up_level, i) <= hi or array.get(sr_dn_level, i) >= lo and array.get(sr_dn_level, i) <= hi
if strength >= array.get(sr_strength, i)
array.remove(sr_strength, i)
array.remove(sr_up_level, i)
array.remove(sr_dn_level, i)
ret
else
ret := false
ret
break
ret
var sr_lines = array.new_line(11, na)
var sr_labels = array.new_label(11, na)
for x = 1 to 10 by 1
rate = 100 * (label.get_y(array.get(sr_labels, x)) - close) / close
label.set_text(array.get(sr_labels, x), text=str.tostring(label.get_y(array.get(sr_labels, x))) + '(' + str.tostring(rate, '#.##') + '%)')
label.set_x(array.get(sr_labels, x), x=bar_index + labelloc)
label.set_color(array.get(sr_labels, x), color=label.get_y(array.get(sr_labels, x)) >= close ? color.red : color.lime)
label.set_textcolor(array.get(sr_labels, x), textcolor=label.get_y(array.get(sr_labels, x)) >= close ? color.white : color.black)
label.set_style(array.get(sr_labels, x), style=label.get_y(array.get(sr_labels, x)) >= close ? label.style_label_down : label.style_label_up)
line.set_color(array.get(sr_lines, x), color=line.get_y1(array.get(sr_lines, x)) >= close ? resistancecolor : supportcolor)
if ph or pl
//because of new calculation, remove old S/R levels
array.clear(sr_up_level)
array.clear(sr_dn_level)
array.clear(sr_strength)
//find S/R zones
for x = 0 to array.size(pivotvals) - 1 by 1
= get_sr_vals(x)
if check_sr(hi, lo, strength)
loc = find_loc(strength)
// if strength is in first maxnumsr sr then insert it to the arrays
if loc < maxnumsr and strength >= min_strength
array.insert(sr_strength, loc, strength)
array.insert(sr_up_level, loc, hi)
array.insert(sr_dn_level, loc, lo)
// keep size of the arrays = 5
if array.size(sr_strength) > maxnumsr
array.pop(sr_strength)
array.pop(sr_up_level)
array.pop(sr_dn_level)
for x = 1 to 10 by 1
line.delete(array.get(sr_lines, x))
label.delete(array.get(sr_labels, x))
for x = 0 to array.size(sr_up_level) > 0 ? array.size(sr_up_level) - 1 : na by 1
float mid = math.round_to_mintick((array.get(sr_up_level, x) + array.get(sr_dn_level, x)) / 2)
rate = 100 * (mid - close) / close
array.set(sr_labels, x + 1, label.new(x=bar_index + labelloc, y=mid, text=str.tostring(mid) + '(' + str.tostring(rate, '#.##') + '%)', color=mid >= close ? color.red : color.lime, textcolor=mid >= close ? color.white : color.black, style=mid >= close ? label.style_label_down : label.style_label_up))
array.set(sr_lines, x + 1, line.new(x1=bar_index, y1=mid, x2=bar_index - 1, y2=mid, extend=extend.both, color=mid >= close ? resistancecolor : supportcolor, style=Lstyle, width=linewidth))
f_crossed_over() =>
ret = false
for x = 0 to array.size(sr_up_level) > 0 ? array.size(sr_up_level) - 1 : na by 1
float mid = math.round_to_mintick((array.get(sr_up_level, x) + array.get(sr_dn_level, x)) / 2)
if close <= mid and close > mid
ret := true
ret
ret
f_crossed_under() =>
ret = false
for x = 0 to array.size(sr_up_level) > 0 ? array.size(sr_up_level) - 1 : na by 1
float mid = math.round_to_mintick((array.get(sr_up_level, x) + array.get(sr_dn_level, x)) / 2)
if close >= mid and close < mid
ret := true
ret
ret
alertcondition(f_crossed_over(), title='Resistance Broken', message='Resistance Broken')
alertcondition(f_crossed_under(), title='Support Broken', message='Support Broken')
