200-Week EMA % Difference200-Week EMA Percentage Difference Indicator – Understanding Market Stretch & Reversion
What This Indicator Does
Even if an individual stock is delivering strong earnings and solid fundamentals, it is still influenced by overall market sentiment. When the broader market begins reverting to its long-term mean, stocks—no matter how strong—are often pulled down along with it. Unrealized gains can erode if one ignores these macro movements.
The 200-Week EMA Percentage Difference indicator measures how far the price of an asset or index has moved away from its 200-week Exponential Moving Average (EMA) in percentage terms. This provides a reliable gauge of whether the market is overstretched (overbought) or pulling back to support (oversold) relative to a long-term trend.
How It Helps Investors
Identifying Market Extremes:
When the indicator moves into the 50-80% range, historical trends show that broad-based indices like BSE Smallcap, Nifty 500, Nifty Microcap, and Nifty Smallcap 250 have often experienced corrections.
This suggests that the market may be overextended, and investors should exercise caution.
Spotting Support Zones:
Past data indicates that when the percentage difference falls back to around 30%, the market often finds a new support level, leading to fresh buying opportunities.
This can help long-term investors identify favorable entry points.
Mean Reversion & Market Cycles:
The indicator essentially measures how far these indices have stretched from their long-term mean (200-week EMA).
Extreme deviations from the EMA often result in mean reversion, where prices eventually return to more sustainable levels.
How to Use It in Broad-Based Indices
Above 50-80% → Caution Zone: Historically associated with market tops or overheated conditions.
Around 30% → Support Zone: A potential level where corrections stabilize and new market uptrends begin.
By applying this indicator to indices like BSE Smallcap, Nifty 500, Nifty Microcap, and Nifty Smallcap 250, investors can gauge market strength, anticipate corrections, and position themselves strategically for long-term opportunities.
Buscar en scripts para "zone"

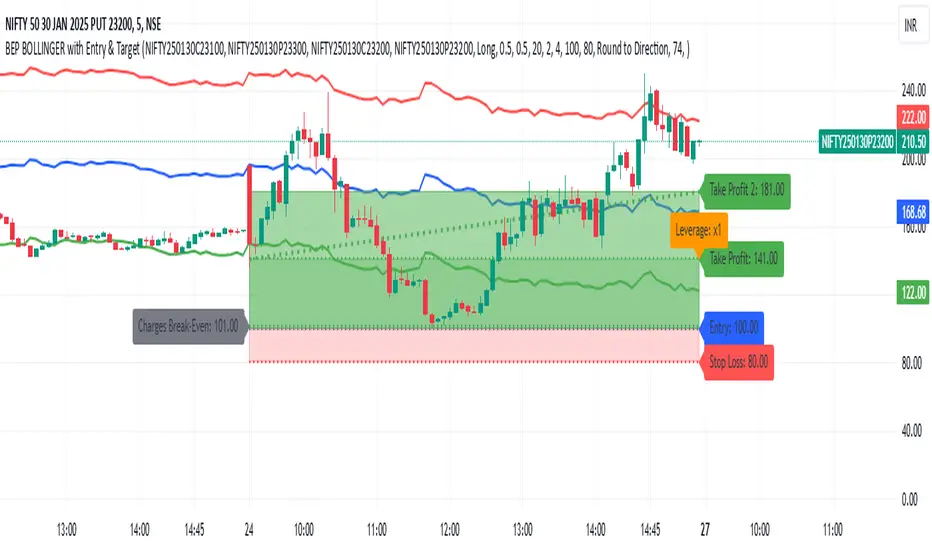
BEP BOLLINGER with Entry & TargetBEP BOLLINGER with Entry & Target Indicator
INPUT
ITM CE
ITM PE
ATM CE
ATM PE
This custom Pine Script indicator provides traders with a powerful tool to analyze options trading setups, specifically for Call and Put options (CE & PE). By integrating Bollinger Bands with a set of configurable parameters, it calculates key entry, stop loss, and take profit levels, while factoring in risk and reward for each trade. Ideal for options traders, this indicator supports precise risk management and enhances your ability to plan and execute trades based on calculated entry points and profit targets.
Key Features:
CE & PE Symbol Selection: Allows users to input two pairs of Call and Put option symbols for premium calculation.
Premium Calculation: Automatically calculates and plots the average premium for each pair of options.
Risk & Reward Zones: Visualizes risk zones and reward zones based on user-defined entry price, stop loss, and risk/reward ratio.
Leverage and Stop Loss Calculation: Computes the optimal leverage and adjusts stop loss based on acceptable loss percentage.
Break-Even Point: Identifies the break-even point considering trading fees and leverage.
Take Profit Levels: Calculates and visualizes multiple take profit levels with different risk/reward ratios.
Multi-Timeframe Analysis: Incorporates higher timeframe analysis to determine entry and stop loss levels for better decision-making.
Dynamic Alerts: Provides alerts when the price hits the stop loss, take profit levels, or reaches the break-even point.
Visual Tools: Draws lines and shaded areas for entry, stop loss, take profit, and risk/reward zones to aid in visual decision-making.
Customizable Settings:
Risk Management: Adjust stop loss, leverage, and risk/reward ratios to suit your trading strategy.
Trading Direction: Choose between Long or Short positions based on market outlook.
Fee Calculations: Input your buy and sell fees to accurately calculate break-even and profit zones.
Color Customization: Personalize the color of premium lines, offset levels, and risk/reward zones.
Alerts:
Alerts can be set for Stop Loss, Take Profit, and Break-Even, ensuring you're notified in real-time when important price levels are reached.
This tool is perfect for traders looking to integrate risk management and precise trade setup analysis into their options trading strategy.
NWOG with FVGThe New Week Opening Gap (NWOG) and Fair Value Gap (FVG) combined indicator is a trading tool designed to analyze price action and detect potential support, resistance, and trade entry opportunities based on two significant concepts:
New Week Opening Gap (NWOG): The price range between the high and low of the first candle of the new trading week.
Fair Value Gap (FVG): A price imbalance or gap between candlesticks, where price may retrace to fill the gap, indicating potential support or resistance zones.
When combined, these two concepts help traders identify key price levels (from the new week open) and price imbalances (from FVGs), which can act as powerful indicators for potential market reversals, retracements, or continuation trades.
1. New Week Opening Gap (NWOG):
Definition:
The New Week Opening Gap (NWOG) refers to the range between the high and low of the first candle in a new trading week (often, the Monday open in most markets).
Purpose:
NWOG serves as a significant reference point for market behavior throughout the week. Price action relative to this range helps traders identify:
Support and Resistance zones.
Bullish or Bearish sentiment depending on price’s relation to the opening gap levels.
Areas where the market may retrace or reverse before continuing in the primary trend.
How NWOG is Identified:
The high and low of the first candle of the new week are drawn on the chart, and these levels are used to assess the market's behavior relative to this range.
Trading Strategy Using NWOG:
Above the NWOG Range: If price is trading above the NWOG levels, it signals bullish sentiment.
Below the NWOG Range: If price is trading below the NWOG levels, it signals bearish sentiment.
Price Touching the NWOG Levels: If price approaches or breaks through the NWOG levels, it can indicate a potential retracement or reversal.
2. Fair Value Gap (FVG):
Definition:
A Fair Value Gap (FVG) occurs when there is a gap or imbalance between two consecutive candlesticks, where the high of one candle is lower than the low of the next candle (or vice versa), creating a zone that may act as a price imbalance.
Purpose:
FVGs represent an imbalance in price action, often indicating that the market moved too quickly and left behind a price region that was not fully traded.
FVGs can serve as areas where price is likely to retrace to fill the gap, as traders seek to correct the imbalance.
How FVG is Identified:
An FVG is detected if:
Bearish FVG: The high of one candle is less than the low of the next (gap up).
Bullish FVG: The low of one candle is greater than the high of the next (gap down).
The area between the gap is drawn as a shaded region, indicating the FVG zone.
Trading Strategy Using FVG:
Price Filling the FVG: Price is likely to retrace to fill the gap. A reversal candle in the FVG zone can indicate a trade setup.
Support and Resistance: FVG zones can act as support (in a bullish FVG) or resistance (in a bearish FVG) if the price retraces to them.
Combined Strategy: New Week Opening Gap (NWOG) and Fair Value Gap (FVG):
The combined use of NWOG and FVG helps traders pinpoint high-probability price action setups where:
The New Week Opening Gap (NWOG) acts as a major reference level for potential support or resistance.
Fair Value Gaps (FVG) represent market imbalances where price might retrace to, filling the gap before continuing its move.
Signal Logic:
Buy Signal:
Price touches or breaks above the NWOG range (indicating a bullish trend) and there is a bullish FVG present (gap indicating a support area).
Price retraces to fill the bullish FVG, offering a potential buy opportunity.
Sell Signal:
Price touches or breaks below the NWOG range (indicating a bearish trend) and there is a bearish FVG present (gap indicating a resistance area).
Price retraces to fill the bearish FVG, offering a potential sell opportunity.
Example:
Buy Setup:
Price breaks above the NWOG resistance level, and a bullish FVG (gap down) appears below. Traders can wait for price to pull back to fill the gap and then take a long position when confirmation occurs.
Sell Setup:
Price breaks below the NWOG support level, and a bearish FVG (gap up) appears above. Traders can wait for price to retrace and fill the gap before entering a short position.
Key Benefits of the Combined NWOG & FVG Indicator:
Combines Two Key Concepts:
NWOG provides context for the market's overall direction based on the start of the week.
FVG highlights areas where price imbalances exist and where price might retrace to, making it easier to spot entry points.
High-Probability Setups:
By combining these two strategies, the indicator helps traders spot high-probability trades based on major market levels (from NWOG) and price inefficiencies (from FVG).
Helps Identify Reversal and Continuation Opportunities:
FVGs act as potential support and resistance zones, and when combined with the context of the NWOG levels, it gives traders clearer guidance on where price might reverse or continue its trend.
Clear Visual Signals:
The indicator can plot the NWOG levels on the chart, and shade the FVG areas, providing a clean and easy-to-read chart with entry signals marked for buy and sell opportunities.
Conclusion:
The New Week Opening Gap (NWOG) and Fair Value Gap (FVG) combined indicator is a powerful tool for traders who use price action strategies. By incorporating the New Week's opening range and identifying gaps in price action, this indicator helps traders identify potential support and resistance zones, pinpoint entry opportunities, and increase the probability of successful trades.
This combined strategy enhances your analysis by adding layers of confirmation for trades based on significant market levels and price imbalances. Let me know if you'd like more details or modifications!

Visible and Anchored OTE chart [SYNC & TRADE]Thanks for the start @twingall
Visible and Anchored OTE chart
Indicator for visualizing price levels and optimal trading zones (OTE - Optimal Trading Entry) using Fibonacci levels.
Main features
Visualization of price ranges using two OTE zones:
OTE 70% (79-62 Fibonacci levels)
OTE 30% (21-38 Fibonacci levels)
Setting up time periods:
Ability to use a custom date range
Option to work with a higher time frame
Flexible display settings:
Choose between using candle bodies or the full range for binding
Customizable appearance of OTE boxes
Customizable text labels
Additional levels:
Middle line (50.5%)
Optional levels of 29.5%, 70.5% and 88%
Customizable Fibonacci extensions
Indicator settings
Main parameters
Use Custom Dates - enable a custom date range
Start Date/End Date - set a time range
Use Higher Timeframe - use a higher time frame
Higher Timeframe - select a higher timeframe
Setting up OTE zones
Show Fib Box - displaying OTE zones
Enable Fib Box 79-62 - enabling OTE zone 70%
Enable Fib Box 21-38 - enabling OTE zone 30%
Show Text - displaying text labels in zones
Visual design
Text Size - text size (tiny/small/medium/large)
Text Color - text color
Text Alignment - text alignment
Line Thickness - line thickness (1-4)
Line Style - line style (Solid/Dashed/Dotted)
Fibonacci levels
High/Low Lines - displaying extreme levels
Midline - displaying the middle line (50.5%)
Show 29.5 Line - additional level 29.5%
Show 70.5 Line - additional level 70.5%
Show 88 Line - additional level 88%
Extensions Fibonacci
There are 6 customizable extension levels available:
Ext#1 (default 1.0)
Ext#2 (default 1.27)
Ext#3 (default 1.62)
Ext#4 (default 2.0)
Ext#5 (default 2.62)
Ext#6 (default 3.62)
For each level, you can configure:
On/Off
Color
Meaning
Alerts
The indicator provides the following types of alerts:
Entering/Exiting OTE Zones:
Entering 70% OTE Zone
Exiting 70% OTE Zone
Entering 30% OTE Zone
Exiting 30% OTE Zone
Crossing Additional Levels:
Crossing 29.5% Level
Crossing 70.5% Level
Crossing 88% Level
Reaching Extension Levels Fibonacci:
Alerts for each configured extension level
Support for both positive and negative extensions
Usage
Add the indicator to the chart
Configure the required display parameters
Set alerts if necessary
Use OTE zones to identify potential entry points into the market
Notes
The indicator automatically updates when the visible area of the chart changes
When using a custom date range, make sure the selected period contains data
For correct operation with a higher time frame, make sure that historical data is available
Visible and Anchored OTE chart
Индикатор для визуализации ценовых уровней и зон оптимальной торговли (OTE - Optimal Trading Entry) с использованием уровней Фибоначчи.
Основные возможности
Визуализация ценовых диапазонов с помощью двух OTE зон:
OTE 70% (79-62 уровни Фибоначчи)
OTE 30% (21-38 уровни Фибоначчи)
Настройка временных периодов:
Возможность использования пользовательского диапазона дат
Опция работы с высшим таймфреймом
Гибкая настройка отображения:
Выбор между использованием тел свечей или полного диапазона для привязки
Настраиваемый внешний вид боксов OTE
Настраиваемые текстовые метки
Дополнительные уровни:
Средняя линия (50.5%)
Опциональные уровни 29.5%, 70.5% и 88%
Настраиваемые расширения Фибоначчи
Настройка индикатора
Основные параметры
Use Custom Dates - включение пользовательского диапазона дат
Start Date/End Date - установка временного диапазона
Use Higher Timeframe - использование высшего таймфрейма
Higher Timeframe - выбор высшего таймфрейма
Настройка OTE зон
Show Fib Box - отображение зон OTE
Enable Fib Box 79-62 - включение зоны OTE 70%
Enable Fib Box 21-38 - включение зоны OTE 30%
Show Text - отображение текстовых меток в зонах
Визуальное оформление
Text Size - размер текста (tiny/small/medium/large)
Text Color - цвет текста
Text Alignment - выравнивание текста
Line Thickness - толщина линий (1-4)
Line Style - стиль линий (Solid/Dashed/Dotted)
Уровни Фибоначчи
High/Low Lines - отображение крайних уровней
Midline - отображение средней линии (50.5%)
Show 29.5 Line - дополнительный уровень 29.5%
Show 70.5 Line - дополнительный уровень 70.5%
Show 88 Line - дополнительный уровень 88%
Расширения Фибоначчи
Доступно 6 настраиваемых уровней расширения:
Ext#1 (по умолчанию 1.0)
Ext#2 (по умолчанию 1.27)
Ext#3 (по умолчанию 1.62)
Ext#4 (по умолчанию 2.0)
Ext#5 (по умолчанию 2.62)
Ext#6 (по умолчанию 3.62)
Для каждого уровня можно настроить:
Включение/выключение
Цвет
Значение
Оповещения
Индикатор предоставляет следующие типы оповещений:
Вход/выход из зон OTE:
Вход в зону OTE 70%
Выход из зоны OTE 70%
Вход в зону OTE 30%
Выход из зоны OTE 30%
Пересечение дополнительных уровней:
Пересечение уровня 29.5%
Пересечение уровня 70.5%
Пересечение уровня 88%
Достижение уровней расширения Фибоначчи:
Оповещения для каждого настроенного уровня расширения
Поддержка как положительных, так и отрицательных расширений
Использование
Добавьте индикатор на график
Настройте необходимые параметры отображения
При необходимости установите оповещения
Используйте зоны OTE для определения потенциальных точек входа в рынок
Примечания
Индикатор автоматически обновляется при изменении видимой области графика
При использовании пользовательского диапазона дат убедитесь, что выбранный период содержит данные
Для корректной работы с высшим таймфреймом убедитесь в доступности исторических данных
Multi Timeframe Candle/Retracement (MTCR)This script provides a visual representation of candlestick and pivot point information from higher timeframes within a lower timeframe chart. It is ideal for traders looking to analyze price movements and identify potential support and resistance zones in the context of a broader timeframe.
Key Features :
Multi-Timeframe Candlestick Visualization:
Displays candlesticks of the selected higher timeframe.
Highlights bullish and bearish candles with distinct colors to identify trends.
Pivot Point Analysis:
Calculates and visualizes pivot points based on the standard or Fibonacci model.
Supports customizable step sizes (rounding pivot values).
Highlights resistance levels (R1, R2, R3), support zones (S1, S2, S3), and a central base line.
Medians and High/Low Zones:
Visualizes median lines between pivot levels.
Optionally displays high and low zones.
Dynamic Updates:
Automatically updates lines and boxes with new candles or pivot calculations.
Visually marks when the current price touches key levels.
Settings :
Timeframe Selection:
Choose a higher timeframe for candlestick and pivot point visualization.
Customizable Colors:
Adjust colors for bullish and bearish candles, as well as for pivot point zones.
Flexible Display Options:
Display only the desired elements, such as pivot lines, median lines, high/low zones, or the base line.
Use Cases :
Identify key support and resistance zones using pivot points.
Analyze price movements on higher timeframes while trading on lower ones.
Utilize median lines to find potential reversal zones or areas for risk/reward analysis.
Notes :
This script is designed for advanced users with a solid understanding of multi-timeframe analysis and pivot points.
It uses multiple drawing objects (lines, boxes), so ensure your chart does not hit its drawing object limit.
Good luck with your trading! 🚀

Ultra Supply & DemandThe "Ultra Supply & Demand" indicator is a sophisticated tool designed for traders looking to analyze market sentiment and potential price movements with a focus on supply and demand dynamics. It overlays on the chart to visually represent areas of supply and demand, providing insights into market liquidity levels and potential reversal points.
Dynamic Supply & Demand Zones: Automatically identifies and displays supply and demand zones based on trading volume and price action patterns. These zones are color-coded for easy identification and can be customized according to user preferences.
Volume-Based Analysis: Utilizes volume data to calculate supply and demand volumes, offering a deeper understanding of market strength behind these zones. Users can set a threshold for volume to filter out less significant signals.
Customizable Liquidation Levels: Offers three predefined liquidation level settings ("1st Touch," "Middle," "Fully") to help traders determine the depth of supply and demand zones. Users can also customize these settings to fit their trading strategy.
Real-time Updates: Continuously updates supply and demand zones as new bars form, ensuring that the information remains current and relevant throughout the trading session.
User-friendly Interface: Provides clear visual cues through color coding and labels, making it easier for traders to interpret the market conditions at a glance. Volume data can be displayed alongside the zones for added context.
Usage Instructions:
Add the Ultra Supply & Demand indicator to your chart.
Customize the indicator settings according to your trading style and preferences, including the display of volume, liquidation levels, and color schemes.
Observe the supply and demand zones on the chart. Look for divergences between price action and the indicator's zones as potential trade setups.
Combine the indicator with other technical analysis tools and indicators to confirm trade signals and enhance your decision-making process.

TrendzonesHi all!
This indicator plots trendlines. These lines are not plotted as traditional lines, but are instead zones. This is useful if you think that trend lines are more of an area of importance than a line.
It does so by finding pivots and connecting two of them if they have not been broken (more about that later) in-between the pivots.
These trend zones can be used as support/resistance that the price can react to.
• The first trendline is drawn between the high/low of the first and second pivot.
• The second trendline's first point is at the open/close of the pivot (either the first pivot or the second one) that has the smallest difference between the high/low and the nearest open/close. The same difference (between the high/low and the open/close) is then subtracted from the other pivot's high/low. This creates a point at the other pivot bar. A trendline is then drawn between the points.
This creates two trendlines and a zone between the two trendlines. This zone is the one kept and is shown by the script.
You can define the pivot lengths used to find trend zones (defaults to 3/3). You can also define the number of pivots to look back for, to find trend zones and the number of active zones, both of these defaults to 3. You can also choose to let the script create new zones based on time ("Oldest") or the zone that is furthest away in price, this defaults to be based on time but it can be useful for letting the script remove the one which is furthest away in price. Another useful setting is the one called "Cross source". This defines the price that has to cross the trend zone to make it invalid (broken). This defaults to "Close", i.e. the bar has to close on the "wrong side" of the trend zone.
The current zones are shown with an extension to the right, but you can also choose to keep the previous lines (without extension). Please note that kept zones are only the ones that are broken, not the replaced ones. I.e. the zones that are kept are the ones that are crossed by the user defined "cross source" (defaults to the closing/current price of the bar).
Hope this makes sense, let me know if you have any questions.
Best of trading luck!

Enhanced Forex IndicatorDescription of the "Enhanced Forex Indicator"
The "Enhanced Forex Indicator" is designed for traders who want a comprehensive technical analysis tool on the TradingView platform. This script integrates Exponential Moving Averages (EMAs), support and resistance zones, and candlestick pattern recognition to provide actionable trading signals, particularly useful for Forex and other financial markets. The script is suitable for intraday trading and swing trading.
Components of the Indicator
Exponential Moving Averages (EMAs):
Short EMA (Blue Line): Faster responding average, good for identifying recent trend changes.
Long EMA (Red Line): Slower moving average, helps in confirming longer-term trends.
Support and Resistance Zones:
Resistance Zone (Red): Area where potential selling pressure could overcome buying pressure, halting price increases temporarily or reversing them.
Support Zone (Green): Area where potential buying pressure could overcome selling pressure, supporting prices and preventing them from falling further.
Candlestick Patterns:
Bullish Engulfing Pattern (Green Triangle Up 'BE'): Suggests a potential upward reversal or start of a bullish trend.
Bearish Engulfing Pattern (Red Triangle Down 'BE'): Indicates a potential downward reversal or start of a bearish trend.
Buy/Sell Signals:
Buy Signal (Green Label 'BUY'): Triggered when the price is above both EMAs and a bullish engulfing pattern is detected.
Sell Signal (Red Label 'SELL'): Triggered when the price is below both EMAs and a bearish engulfing pattern is detected.
Trading Setup:
Entry: Consider entering a buy position when the 'BUY' signal appears, indicating bullish conditions. Enter a sell position when the 'SELL' signal appears, indicating bearish conditions.
Exit: Look for closing signals opposite your entry or use predefined take profit and stop loss levels. For instance, exit a buy position on a 'SELL' signal or when the price drops below the support zone.
Risk Management:
Set stop losses just below the support zone for buy orders and above the resistance zone for sell orders to protect against significant losses.
Adjust position sizes according to your risk tolerance and account balance.
Considerations:
Use this indicator in conjunction with other analysis tools and fundamental data to confirm signals and strengthen your trading strategy.
Periodically backtest the strategy based on this indicator to ensure its effectiveness in current market conditions.
Optimization:
Adjust the lengths of the EMAs and the buffer size of the support and resistance zones to better fit the asset's volatility and your trading timeframe.

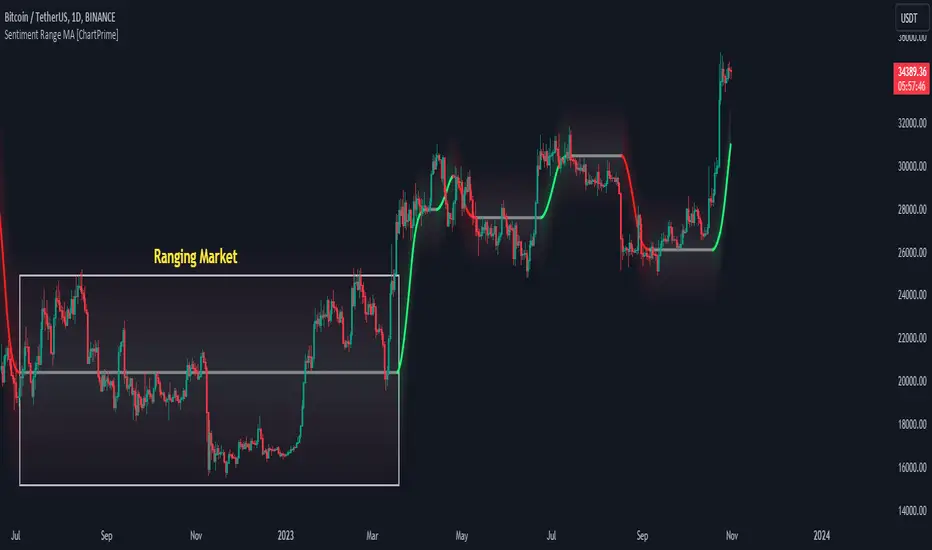
Sentiment Range MA [ChartPrime]The "Sentiment Range MA" provides traders with a dynamic perspective on market activity, emphasizing both stability in chop zones and quick adaptability outside of them.
Key Features:
Chop Zone Stability: In choppy markets, this indicator remains consistent, filtering out the noise to provide a clear view.
Quick Adaptability: Should the price break out of these zones, the indicator recalibrates promptly.
Dynamic Support and Resistance: Adapts based on the latest price action, serving as an evolving reference point.
Emphasis on Recent Levels: The tool factors in the latest notable market levels to stay relevant and timely.
Configurations:
Data Source: Choose your desired metric, though many default to the closing price.
Output Smoothing: Adjust the SR MA's response to market movements.
Trigger Smoothing: Refine boundary definitions based on your market insights.
ATR Period: Set the period for the ATR, influencing the surrounding boundary's width.
Range Multiplier: Control the ATR's effect on the range.
Range Switch: Flip between high-low and open-close values for range determination.
Visuals
Sentiment Range MA Line:
- This is the flowing line that transitions between green and red.
- When it's green, it indicates bullish momentum in the market. This suggests a prevailing upward trend and can be an entry cue for traders who trade with the trend.
- When it turns red, bearish sentiments dominate. It indicates the potential beginning of a downtrend or a continued downtrend. Traders might interpret this as a signal to be cautious, to short the market, or to exit long positions.
The Chop Zone:
- This is the space between the price candles and the Sentiment Range MA line. It represents a region where the price is considered to be moving sideways or without a clear direction. Price movements within the chop zone might not be substantial enough to warrant a trading decision. Only when the price breaks out of this zone do we see the Sentiment Range MA line change color, signaling a potential trading opportunity.
By interpreting these visuals, traders can make more informed decisions based on the prevailing market sentiment and trend. The chart becomes a tool, providing both an overview of the market condition and potential entry or exit points based on the Sentiment Range MA indicator's readings.
Detailed Settings Overview
Understanding the settings of the Sentiment Range MA Indicator can greatly enhance its utility in your trading strategy. Let's dive deeper into each:
Output Smoothing:
Purpose: It refines the SR MA to provide a clearer trend perspective.
Functionality:
- At `0`, it ensures the indicator responds immediately to price deviations from the chop zone.
- At higher values, it transforms the indicator into a volatility-adjusted moving average.
Filtering Modes:
- Single Filtering: Prioritizes speed.
- Double Filtering: Emphasizes stability.
Trigger Smoothing:
Purpose: Used for the range break detection.
Functionality: It dampens the indicator's sensitivity to sudden market volatility, preventing unnecessary triggers.
ATR Length:
Purpose: Governs the retrospective period for the chop zone.
Functionality:
- Higher values offer a more consistent and broad range size, capturing more historical data.
- Lower values allow for a more adaptive and responsive range.
Range Multiplier:
Purpose: Modifies the breadth of the range around the SR MA.
Functionality: Increasing the multiplier will extend the range, giving more leeway before triggering, while decreasing it will narrow the range, making the indicator more responsive to price changes.
Range Style:
Purpose: Decides which candlestick data is factored into the true range calculations.
Options:
- Body: Uses the open and close values.
- Wick: Accounts for the high and low values.
Functionality: Switching between styles lets you prioritize either the overall volatility (Wick) or just the concluded price action for a period (Body).
By fine-tuning these settings, traders can tailor the Sentiment Range MA Indicator to various market conditions and personal trading styles, ensuring optimal decision-making.
Quick Start
Based on the provided chart, here's a brief explanation of the default settings for the Sentiment Range MA Indicator:
Length: Set at ` 20 `.
- This determines the base moving average period. A standard setting, it calculates the average price over the last 20 periods, providing traders with a clear perspective of short-term trends.
ATR Length: Set at ` 200 `.
- This adjusts the lookback period for the Average True Range (ATR), which in turn influences the chop zone calculation. At a setting of 200, it offers a comprehensive view, considering a longer stretch of historical data.
Range Multiplier: Set at ` 6 `.
- This multiplies the ATR value, widening or narrowing the band around the SR MA. A setting of 6 means the range around the SR MA is determined by multiplying the ATR by 6, offering a broader fluctuation zone.
On the chart, the green line represents the bullish sentiment and the red represents the bearish sentiment. Price movements above and below these lines can be used as potential buy or sell signals respectively. Fine-tuning these settings can cater the Sentiment Range MA Indicator to your specific trading strategy and market condition preferences.
Alternative Settings
For traders looking to adapt to faster market conditions or prefer a more agile analysis, here's a brief description of the alternative settings for the Sentiment Range MA Indicator:
Length: Set at ` 3 `.
- This highly responsive setting calculates the average price over the last 3 periods. Ideal for quick market movements, it offers traders insights into very short-term price trends and potentially swift trade opportunities.
ATR Length: Set at ` 50 `.
- This shorter lookback period for the Average True Range (ATR) focuses on more recent market volatility, providing a tighter and more current chop zone calculation. It's suitable for those wanting to respond to recent market shifts.
Range Multiplier: Set at ` 4 `.
- Multiplying the ATR by 4 narrows down the buffer around the SR MA. This creates a tighter sentiment range, possibly resulting in more frequent crossovers and trading signals.
In the provided chart, the green line still denotes bullish momentum while the red symbolizes bearish sentiment. These alternative settings might generate more frequent signals, so traders should ensure their strategy is aligned with this heightened sensitivity.
Wrapping Up
The Sentiment Range MA melds stability and agility, making it a valuable tool in your trading toolkit. As always, before integrating new indicators, take the time to understand its nuances and potential impacts on your strategy.
Grospector DCA V.3This is system for DCA with strategy.
This has 5 zone Extreme high , high , normal , low , Extreme low. You can dynamic set min - max percent every zone.
Extreme zone is derivative short and long which It change Extreme zone to Normal zone all position will be closed.
Every Zone is splitted 10 channel. and this strategy calculate contribution.
and now can predict price in future.
Idea : Everything has average in its life. For bitcoin use 4 years for halving. I think it will be interesting price.
Default : I set MA is 365*4 days and average it again with 365 days.
Input :
len: This input represents the length of the moving average.
strongLen: This input represents the length of the moving average used to calculate the strong buy and strong sell zone.
shortMulti: This input represents the multiplier * moveing average used to calculate the short zone.
strongSellMulti: This input represents the multiplier used to calculate the strong sell signal.
sellMulti: This input represents the multiplier * moveing average used to calculate the sell zone.
strongBuyMulti: This input represents the multiplier used to calculate the strong sell signal.
longMulti: This input represents the multiplier * moveing average used to calculate the long zone.
*Diff sellMulti and strongBuyMulti which is normal zone.
useDerivative: This input is a boolean flag that determines whether to use the derivative display zone. If set to true, the derivative display zone will be used, otherwise it will be hidden.
zoneSwitch: This input determines where to display the channel signals. A value of 1 will display the signals in all zones, a value of 2 will display the signals in the chart pane, a value of 3 will display the signals in the data window, and a value of 4 will hide the signals.
price: Defines the price source used for the indicator calculations. The user can select from various options, with the default being the closing price.
labelSwitch: Defines whether to display assistive text on the chart. The user can select a boolean value (true/false), with the default being true.
zoneSwitch: Defines which areas of the chart to display assistive zones. The user can select from four options: 1 = all, 2 = chart only, 3 = data only, 4 = none. The default value is 2.
predictFuturePrice: Defines whether to display predicted future prices on the chart. The user can select a boolean value (true/false), with the default being true.
DCA: Defines the dollar amount to use for dollar-cost averaging (DCA) trades. The user can input an integer value, with a default value of 5.
WaitingDCA: Defines the amount of time to wait before executing a DCA trade. The user can input a float value, with a default value of 0.
Invested: Defines the amount of money invested in the asset. The user can input an integer value, with a default value of 0.
strategySwitch: Defines whether to turn on the trading strategy. The user can select a boolean value (true/false), with the default being true.
seperateDayOfMonth: Defines a specific day of the month on which to execute trades. The user can input an integer value from 1-31, with the default being 28.
useReserve: Defines whether to use a reserve amount for trading. The user can select a boolean value (true/false), with the default being true.
useDerivative: Defines whether to use derivative data for the indicator calculations. The user can select a boolean value (true/false), with the default being true.
useHalving: Defines whether to use halving data for the indicator calculations. The user can select a boolean value (true/false), with the default being true.
extendHalfOfHalving: Defines the amount of time to extend the halving date. The user can input an integer value, with the default being 200.
Every Zone : It calculate percent from top to bottom which every zone will be splited 10 step.
To effectively make the DCA plan, I recommend adopting a comprehensive strategy that takes into consideration your mindset as the best indicator of the optimal approach. By leveraging your mindset, the task can be made more manageable and adaptable to any market
Dollar-cost averaging (DCA) is a suitable investment strategy for sound money and growth assets which It is Bitcoin, as it allows for consistent and disciplined investment over time, minimizing the impact of market volatility and potential risks associated with market timing

Gaps + Imbalances + Wicks (MTF) - By LeviathanThis script will identify and draw price gaps, wicks and imbalances with customizable fill conditions, multi-timeframe function, zone size filtering, volume comparison, lookback filtering, as well as highly customizable appearance and settings.
I’ve made this indicator to combine the three similar but different elements that occur in price movements and serve as significant zones of interest or way of PA interpretation in various different strategies.
Imbalances (or Fair Value Gap/FVG/Inefficiency/whatever)
- The Imbalance “pattern” consists of 3 candles (1- candle before the sharp move, 2 - sharp move candle and 3- candle after the sharp move). When price makes a move downwards, the imbalance zone is defined as the area between the low of 1 and the high of 3 When price makes a move upwards, the imbalance zone is defined as the area between the high of 1 and the low of 3.
Gaps
A price gap is an area on a chart where no trading activity has taken place. A gap up means that the low of the current candle is higher than the high of the previous candle and a gap down means that the high of the current candle is lower than the low of the previous candle.
Wicks (or shadows/tails/whatever)
Wicks are used to indicate where the price has fluctuated relative to the opening and closing price of the candle. An upper wick is the zone between candle high and candle close/open (whichever is higher) and a lower wick is the zone between candle’s low and candle’s close/open (whichever is lower).
Settings Overview
“Zone Type” - This input lets you decide which zones should the script plot and on which timeframe. You should always pick a timeframe higher than your chat’s.
“Middle Line, Top Line, Bottom Line” - Show or hide the Middle Line (horizontal level in the middle of each zone), Show or hide Top Line (horizontal level at the top of the zone), Show or hide Bottom Line (horizontal level at the bottom of the zone)
“UP/DOWN Zones" - This input lets you show/hide UP Zones or DOWN Zones an pick their color, border color and label color.
”Fill Condition” - If turned ON, the zones will end drawing when your prefered Fill Condition is met (Full Filll = price mitigates the whole zone, Half Fill = zone is at least halfway mitigated and Touch = zone is touched by price). If turned OFF, the zones will only be plotted for the amount of bars defined it “Zone Length”.
”Lookback (D)” - This input lets you limit the amount of zones plotted on the chart by choosing how many days back in time should the script go to find and plot zones. For example, input 1 will only show you the zones of the past day, input 7 will only show you the zones of the past week.
”Hide Filled Zones” - If turned ON, the zones that have been filled will be removed from the chart.
”Show Boxes” - Show or hide the boxes that represent the zones. This is useful for those who want the zones to be visualized by just lines.
“Filter Type” - this input lets you create a filter that will make the script only show zones that are larger than ATR or larger than a certain percentage. You can choose the ATR Length and the multiplier (higher multiplier → larger zone required), as well as the Percentage (%) and its multiplier (higher percentage → larger zone required). If you choose “None”, the zones of all sizes will be plotted.
”Zone Labels” - this part of the settings lets you: show/hide labels, decide on the size of the labels and their positions, choose a custom name for each zone, choose the data that the labels present (Type of the zone/Timeframe/ Volume ).
”Other settings” - ‘Stop/Delete zone after X number of candles’ will force stop/delete the zone if it’s plotted for more than prefered number of bars. ‘Line Style’ lets you choose the style and the color of the lines, ‘Zone Length’ defines the length of the zone if Fill Condition is “None”.
More settings, modifications and improvements coming in future updates. This script is a bit old so I will clean up and optimize the code once I have more time.

SuperTrend Filtered with Dash| Gold | ProjectSyndicate📘 ProjectSyndicate Filtered Supertrend M30 GOLD
✅ User Guide Optimized Settings for XAUUSD on M30
Indicator: Supertrend Filtered Gold
Version: 1.0
Author: ProjectSyndicate
Pine Script: v6
________________________________________
1) 👋 Introduction
Welcome to ProjectSyndicate Filtered Supertrend, an upgraded, professional-grade Supertrend system built in Pine Script v6.
This version is designed specifically to help M30 GOLD (XAUUSD) traders reduce the most common Supertrend problem: false flips in chop / low volatility.
By adding 5 powerful filters (all optional + fully adjustable), this indicator aims to keep signals clean, selective, and trend-aligned — which is ideal for GOLD’s frequent fakeouts and liquidity sweeps. 🧠✨
________________________________________
2) ⭐ Key Features What Makes It “Filtered”
✅ Pine Script v6 for speed and stability
✅ 5 Advanced Filters to reduce noise and false signals
✅ Full Customization (each filter can be turned ON/OFF)
✅ On-Chart Filter Dashboard to see what’s blocking signals in real time 📊
✅ Built-In Alerts (Buy / Sell / Direction Change) 🔔
✅ Conservative Defaults (high-quality signals out of the box)
________________________________________
________________________________________
3) 🎛 Sensitivity Control Panel
This is where the magic happens. All enabled filters use AND logic meaning:
✅ A signal prints ONLY if every enabled filter passes.
If even one fails → signal is blocked 🚫
That’s why this system feels “smart” and selective (especially on GOLD M30).
________________________________________
4.1) 📈 Trend Filter
Purpose: Blocks signals when price is drifting sideways (flat momentum).
How it works:
It checks the slope of a short-term EMA. If the EMA slope is too flat, the market is likely ranging → signals get blocked.
Recommended (M30 GOLD Optimized):
• ✅ Enable Trend Filter: ON
• ⏱ Trend Filter Period: 10
• 📏 Trend Strength Threshold (%): 0.05%
Tip for GOLD:
If you’re not getting signals during London/NY trend days, slightly lower the threshold (example 0.04%) to catch more moves. ⚡
________________________________________
4.2) ✅ Signal Confirmation
Purpose: Stops “one-candle flips” and failed breakouts (very common on XAUUSD).
How it works:
It waits for the new trend direction to remain valid for X bars before confirming.
Recommended (M30 GOLD Optimized):
•✅ Enable Signal Confirmation: ON
•🧱 Confirmation Bars: 5
Behavior example:
• Confirmation = 5 → the signal prints on the 5th candle after trend changes
This reduces fakeouts, but signals appear later (more reliable, less early). 🎯
________________________________________
4.3) 🌪 Volatility Filter
Purpose: Avoids signals during “dead” volatility phases (choppy micro-ranges).
How it works:
Measures percentage price movement over a period.
If movement is too small → no signals.
Recommended (M30 GOLD Optimized):
•✅ Enable Volatility Filter: ON
•⏱ Volatility Period: 20
•📉 Minimum Volatility Threshold: 0.25%
Tip:
If you trade only during active sessions (London/NY), you can raise this slightly to filter even harder (ex: 0.30%). 🔥
________________________________________
4.4) 💪 ADX Filter
Purpose: Confirms the market is truly trending using ADX, a classic trend-strength tool.
How it works:
If ADX is below the threshold, the market is likely non-trending → signals blocked.
Recommended (M30 GOLD Optimized):
•✅ Enable ADX Filter: ON
•⏱ ADX Period: 14
•🎚 Minimum ADX Value: 25
Rule of thumb:
📌 ADX > 25 = trend conditions
📌 ADX < 20 = likely chop / mean-reversion
________________________________________
4.5) 🧯 Signal Spacing Anti-Spam Filter
Purpose: Prevents overtrading by forcing a cooldown period between signals.
How it works:
It tracks bars since last BUY and since last SELL separately.
Recommended M30 GOLD Optimized:
•✅ Enable Signal Spacing: ON
•⏳ Minimum Bars Between Signals: 75
What 75 bars means on M30:
75 × 30 minutes = 2250 minutes = 37.5 hours
So this is intentionally strict (high quality / swing-style filtering). 🏦
If you want more signals:
Try 30–50 for active trend capture, still clean. ✅
________________________________________
5) 📊 Filter Dashboard Read This First When Confused
The dashboard shows live status of each filter.
✅ PASS (Green) = filter condition met
❌ FAIL (Red) = filter is blocking signals
Dashboard also shows:
• 📏 Trend Strength (EMA slope %)
• 💪 ADX Value
• 🔁 Current Trend UPTREND / DOWNTREND
Pro Tip 🧠:
Not getting signals? Don’t guess. Look at the dashboard — it will instantly tell you which filter is failing.
________________________________________
6) 🔔 Alerts Integration TradingView Alerts Ready
This indicator includes built-in alert conditions.
To set alerts:
1️⃣ Click Alert (top toolbar) or press Alt + A
2️⃣ In Condition, select Supertrend Advanced
3️⃣ Choose one:
📌 Alert Conditions
✅ SuperTrend Buy → Buy printed after all enabled filters PASS
✅ SuperTrend Sell → Sell printed after all enabled filters PASS
⚠️ SuperTrend Direction Change → raw Supertrend flip (ignores filters)
Recommended alert frequency:
✅ Once Per Bar Close (reduces noise + avoids repaint confusion)
________________________________________
7) 🧠 Strategy & Best Practices M30 GOLD Focused
✅ Best Use Case
This Filtered Supertrend works best when GOLD is doing one of these:
•🏃 Strong session trend (London / NY continuation)
•🔁 Post-news directional expansion
•📈 Clean structure break + follow-through
🔥 Smart Trading Workflow (Simple + Effective)
✅ Use dashboard → wait for filters PASS
✅ Align with market structure (HH/HL for buys, LH/LL for sells)
✅ Use key zones:
•Support/Resistance 🧱
•Liquidity sweeps 💧
•Order Blocks / Supply-Demand (if you use them) 📦
🧪 Tune One Filter At A Time
When optimizing:
1.Reduce Signal Spacing first
2.Then reduce Confirmation Bars
3.Only then touch volatility / ADX / trend slope
________________________________________
8) 🧩 Example Profiles Quick Presets
🥇 GOLD M30 “Optimized / Conservative” Recommended
•Trend Strength: 0.05%
•Confirmation Bars: 5
•Volatility Threshold: 0.25%
•ADX: 25
•Signal Spacing: 75
⚖️ Balanced More signals, still filtered
•Trend Strength: 0.05%
•Confirmation Bars: 2
•Volatility Threshold: 0.50%
•ADX: 25
•Signal Spacing: 10
⚡ Aggressive / Scalping Style
•Trend Strength: 0.03%
•Confirmation Bars: 1
•Volatility Threshold: 0.10%
•ADX: OFF
•Signal Spacing: 3
________________________________________
🤝 Combining Filtered Supertrend + ProjectSyndicate Order Blocks Finder SMC Boost
For SMC traders, use Order Block Finder to map clean institutional supply/demand zones (bullish OB = last bearish candle before strong bullish displacement + BOS; bearish OB = last bullish candle before strong bearish displacement + BOS, with a displacement-strength filter and auto-cleanup) and then let Filtered Supertrend act as the “permission + timing” engine
✅only take Supertrend Buy signals when price is reacting from/returning into a bullish OB (demand) in an uptrend, and Supertrend Sell signals from a bearish OB (supply) in a downtrend; entries become higher probability because you’re stacking trend bias + institutional zone + confirmation filters, with clean risk defined by the OB boundary (stop beyond the box) and logical targets toward the next opposing OB or trend continuation
Order Block Finder | Gold | ProjectSyndicate
________________________________________
9) 🧯 Troubleshooting
❓ “No signals are appearing”
Likely filters are too strict.
✅ Check dashboard → see which filter fails.
Try this order:
1.Lower Signal Spacing (75 → 50 → 30)
2.Lower Confirmation Bars (5 → 3 → 2)
3.Slightly reduce thresholds
❓ “Still too many signals”
Tighten filters:
✅ Confirmation Bars 3+
✅ Signal Spacing 100+
✅ Increase Trend Strength + ADX thresholds
❓ “Signals appear too late”
Reduce Confirmation Bars:
✅ 5 → 3 or 2
(earlier entries, slightly more risk of fakeouts)
________________________________________
✅ Conclusion
ProjectSyndicate Filtered Supertrend turns a basic trend indicator into a high-control signal engine. On GOLD M30, where fakeouts and chop are common, the 5-filter AND logic + dashboard gives you a cleaner edge — especially when combined with structure and key zones. 📈💎

Adaptive Market Structure Channel By S B PrasadAdaptive Market Structure Channel (AMSC)
Institutional-Grade Trend, Volatility & Liquidity Framework
Overview
The Adaptive Market Structure Channel (AMSC) is a multi-engine, adaptive trading framework designed to read market structure, volatility, liquidity, and trend strength in real time.
It integrates ATR-based channels, pivot structure, supply–demand zones, liquidity sweeps, multi-factor momentum, and higher-timeframe confirmation into a single, coherent visual system.
AMSC is not a single-indicator strategy.
It is a context-driven decision framework intended to help traders align entries with dominant trend, structural levels, and institutional activity.
Core Components
1️⃣ Adaptive ATR Trend Channel
Dynamic ATR-based support & resistance
Automatically adjusts to volatility
Color-coded trend strength (strong / weak regimes)
Acts as the primary trend bias filter
2️⃣ Pivot-Based ATR Trend Channels
Channels built from confirmed pivot highs and lows
ATR-expanded structure, not fixed slopes
Separates impulse moves from corrections
Useful for trend continuation and pullback trades
3️⃣ Market Structure: Supply & Demand Zones
Automatically plots fresh demand and supply zones
Zones extend forward until violated
Helps identify high-probability reaction areas
Used as a location filter, not a standalone signal
4️⃣ Liquidity Sweep Detection (Smart Money Logic)
Identifies equal high / equal low liquidity pools
Detects stop-hunt style sweeps
Validates sweeps only when price reacts from structure zones
Prevents chasing false breakouts
5️⃣ Multi-Factor Trend Confirmation Engine
Combines:
EMA structure
MACD momentum
RSI regime
VWAP positioning
Optional ribbon & HMA filters
Signals are generated only when a majority of factors align, avoiding single-indicator bias.
6️⃣ Volatility Context (Bollinger Bands)
Provides volatility expansion / contraction context
Helps distinguish trend continuation vs compression
Works as a background regime filter
7️⃣ Higher Timeframe Confirmation
Confirms trend using a user-selected HTF
Prevents counter-trend trades during strong HTF bias
Essential for intraday and swing traders
8️⃣ Session-Aware Trading
Optional India, London, and New York session filters
Signals only during active market participation
Avoids low-liquidity false signals
9️⃣ Professional Dashboard
Real-time display of:
Trend direction
Trend strength
Factor alignment
HTF bias
Active zone
Trade signal
Session status
Designed for quick decision-making, not clutter.
How to Use AMSC (Best Practice)
✔ Trade in the direction of the ATR trend
✔ Enter near demand/supply within the channel
✔ Confirm with factor alignment & HTF bias
✔ Use liquidity sweeps as entry triggers, not signals alone
✔ Avoid trades during low-strength or inactive sessions
AMSC performs best when used as a confluence system, not a mechanical entry-exit robot.
Ideal Use Cases
Intraday index trading
Swing trading in trending markets
Futures & FX structure-based trading
Traders who prefer context over indicators
What AMSC Is NOT
❌ Not a scalping toy
❌ Not a repainting indicator
❌ Not a one-click signal generator
It is built for disciplined traders who understand structure and risk.
Final Note
AMSC is designed to think like the market, not predict it.
Use it to read conditions, not chase signals.
MSC — BEST CLEAN SETUP (RECOMMENDED)
🎯 Design Philosophy
“Context first, signals last.”
The goal is to:
Read trend & structure at a glance
Avoid indicator overload
Let price + zones + channel do the heavy lifting
1️⃣ CORE VISUALS (KEEP ON)
These are non-negotiable.
🔹 Adaptive ATR Trend Channel
✅ ON
Primary trend bias
Use ATR Trendline Color = ON
This alone defines:
Bull vs Bear
Strength vs weakness
👉 If price is above channel → bullish context
👉 If price is below channel → bearish context
🔹 Pivot ATR Trend Channel
✅ ON
Channel fill: ON
Transparency ≥ 85
Purpose:
Visualise trend slope
Spot pullbacks inside trend
👉 Treat channel edges as dynamic structure, not entry signals.
🔹 Supply & Demand Zones
✅ ON
Transparency: 80–85
Zones auto-expire visually when violated
👉 These are your only horizontal levels.
2️⃣ SMART FILTERS (SELECTIVE)
💧 Liquidity Sweep
✅ ON
Lookback: 5
Tolerance: 0.15 ATR
👉 Use sweeps only near zones
❌ Ignore sweeps in the middle of nowhere
⏱ Session Filter
✅ ON
Trade only one session
India (for NSE)
London (for FX)
New York (for US indices)
❌ Do NOT enable multiple sessions simultaneously
🔍 Higher Timeframe (HTF)
✅ ON
Intraday: Daily
Swing: Weekly
👉 If HTF disagrees → no trade
3️⃣ WHAT TO TURN OFF (CRITICAL)
This is where clutter dies.
❌ Bollinger Bands
🚫 OFF by default
Use only when studying volatility compression
Otherwise adds visual noise
❌ Full ATR Channel (Ver 15)
🚫 OFF
Redundant with pivot + ATR trend
Keep only one channel logic
❌ SuperTrend Channel
🚫 OFF
ATR Trend Channel already covers this
❌ Pivot Levels (P, R1, S1…)
🚫 OFF
Zones replace static pivots
Too many horizontal lines = paralysis
❌ Previous Day / Week Levels
🚫 OFF
Turn ON only for index option trading
Otherwise clutter
4️⃣ MOVING AVERAGES (STRICT RULE)
Keep ONLY:
EMA Fast (9)
EMA Slow (21)
Optional:
HMA → ON only for scalping
❌ Do NOT stack multiple MAs visually
5️⃣ DASHBOARD (MINIMAL MODE)
🧭 Dashboard
✅ ON
Position: Top Right
Text Size: Small
Watch only:
Trend
Strength
HTF
Zone
Signal
Ignore factor numbers once confidence develops.
6️⃣ SIGNAL USAGE (DISCIPLINE RULE)
✔ Signal must appear inside a zone
✔ Signal must align with trend & HTF
✔ Signal must be during session
❌ Never take:
Signals mid-channel
Signals against HTF
Signals during flat strength (<30%)
7️⃣ RECOMMENDED PRESETS (COPY THIS)
🔹 Intraday (Clean)
Timeframe: 5m / 15m
HTF: Daily
Session: India / NY
BB: OFF
Full ATR: OFF
SuperTrend: OFF
Pivots: OFF
🔹 Swing (Ultra Clean)
Timeframe: 1H / 4H
HTF: Weekly
Liquidity: ON
Zones: ON
Dashboard: ON (small)
8️⃣ GOLDEN RULE (MOST IMPORTANT)
If you cannot explain the trade using only:
Trend channel
One zone
One sweep
Do not trade it.
🏁 FINAL VERDICT
AMSC is not cluttered by design.
Clutter comes from turning everything ON.
Used correctly:
The chart stays clean
Decisions become obvious
Overtrading disappears
AMSC – TRADE EXECUTION RULEBOOK
Framework rule:
Trend → Structure → Liquidity → Entry → Risk → Exit
1️⃣ MARKET PRE-CONDITIONS (MANDATORY)
❌ NO TRADE unless ALL are TRUE
✅ Trend Filter
ATR Trend Channel = Bull for longs / Bear for shorts
Trend strength ≥ 40%
Price must be on the correct side of the channel
✅ HTF Confirmation
HTF bias must match LTF trend
If HTF is neutral → NO TRADE
✅ Session Filter
Trade only during active session
No first 5 minutes after session open
No last 15 minutes before session close
2️⃣ LOCATION RULE (MOST IMPORTANT)
🔹 Long Trades
Price must be inside or just above a DEMAND zone
Zone must be:
Fresh (not tested more than twice)
Within the Pivot ATR Channel
🔹 Short Trades
Price must be inside or just below a SUPPLY zone
Same freshness rules apply
❌ No zone → no trade
3️⃣ LIQUIDITY CONFIRMATION (ENTRY TRIGGER)
🔹 Long Entry Trigger
At the demand zone, you must see:
✔ Sell-side liquidity sweep
✔ Sweep candle closes bullish
✔ Sweep occurs inside the zone
🔹 Short Entry Trigger
At the supply zone, you must see:
✔ Buy-side liquidity sweep
✔ Sweep candle closes bearish
✔ Sweep occurs inside the zone
4️⃣ ENTRY RULE (EXECUTION)
🔵 LONG ENTRY
Enter BUY when all conditions align and:
Enter at:
Close of the sweep candle OR
50% retrace of the sweep candle (preferred)
🔴 SHORT ENTRY
Enter SELL when:
Enter at:
Close of the sweep candle OR
50% retrace of the sweep candle
5️⃣ STOP-LOSS RULES (NON-NEGOTIABLE)
🔻 Long SL
Place SL at:
Lowest point of the demand zone
OR
Below sweep low − 0.1 ATR (whichever is lower)
🔺 Short SL
Place SL at:
Highest point of the supply zone
OR
Above sweep high + 0.1 ATR (whichever is higher)
❌ Never trail SL early
❌ Never move SL to break-even before partial exit
6️⃣ POSITION SIZE (FIXED RISK ONLY)
Risk per trade: 0.5% – 1% max
If SL distance is large → reduce position size
Do not widen SL to fit position
7️⃣ EXIT RULES (STRUCTURED)
🎯 TARGET 1 (T1 – Protection)
At 1R
Action:
Book 50%
Move SL to Break-Even
🎯 TARGET 2 (T2 – Structure)
Next opposite zone
OR
Pivot ATR Channel mid-line
Book 30%
🎯 FINAL EXIT (TREND FOLLOW)
Exit remaining 20% when:
✔ Opposite liquidity sweep occurs
✔ Price closes beyond Pivot ATR Channel
✔ HTF bias flips
✔ Session ends
8️⃣ NO-TRADE CONDITIONS (ABSOLUTE)
❌ Trend strength < 30%
❌ Zone already tested 3+ times
❌ Liquidity sweep outside zone
❌ Entry candle is oversized (>1.8 ATR)
❌ Trade against HTF
❌ Emotional or revenge trade
9️⃣ ONE-SCREEN TRADE CHECKLIST
Before clicking BUY/SELL:
✔ Trend aligned
✔ HTF aligned
✔ In session
✔ At zone
✔ Sweep confirmed
✔ SL defined
✔ R ≥ 2 possible
If any answer = NO → skip trade
🔒 DISCIPLINE STATEMENT (PRINT THIS)
AMSC does not pay for activity.
It pays for patience, location, and discipline.
🏁 EXPECTED PERFORMANCE (REALISTIC)
Win rate: 45–60%
R:R average: 1:2.5 to 1:4
Drawdown: low
Trade frequency: selective
Adaptive Market Structure Channel — Visual Layout
5
🧭 How to READ the Chart (Left → Right)
1️⃣ Core Trend Context (FIRST thing your eyes see)
ATR Trend Channel
Acts as dynamic support/resistance
Green = bullish regime
Red = bearish regime
No second trendline competing with it
👉 If price is on the wrong side → no trade
2️⃣ Pivot ATR Structure Channel (SECOND layer)
Sloping channel following real swing structure
Shows:
Trend acceleration
Healthy pullbacks
Channel fill is very light (high transparency)
👉 Pullbacks inside this channel are valid
👉 Breaks outside = caution / exit
3️⃣ Supply & Demand Zones (ONLY horizontal objects)
Few, wide, soft-colored zones
No pivot clutter, no fibs, no grids
👉 Trades happen only here
4️⃣ Liquidity Sweep Markers (EVENT-BASED)
Appears only near zones
Indicates stop-hunt, not entry by itself
👉 Sweep + zone + trend = setup
👉 Sweep alone = ignore
5️⃣ Dashboard (Decision Support, not distraction)
Small
Corner-placed
Shows only:
Trend
Strength
HTF bias
Zone
Signal
Session
👉 After experience, you’ll barely look at it
🚫 What You DO NOT See (Very Important)
A clean AMSC chart intentionally avoids:
Multiple moving averages
Pivot levels (P/R/S)
Too many channels
Oscillator panels
Bright fills or thick lines
If your chart looks “busy”, something is ON that should be OFF.
🧠 Mental Model (Keep This Image in Mind)
AMSC chart =
1 dynamic trend
1 structure channel
1 zone
1 liquidity event
1 decision
Anything more → clutter
Anything less → blind trading
✅ Final Visual Checklist (Before Trading)
✔ Chart background visible
✔ Candles clearly readable
✔ Zones visible but not loud
✔ Channel guides the eye
✔ Nothing overlaps price excessively
If yes → you are trading AMSC correctly

Supply & Demand Sniper369Indicator Philosophy: The Convergence of Structure and Liquidity
The Supply & Demand Sniper369 is not just another signal generator; it is a professional-grade execution framework built on the principles of Institutional Order Flow and Liquidity Engineering. While standard indicators often lag or provide signals in "no-man's land," this script is designed to identify high-probability reversal points by combining macro-structural zones with micro-execution triggers.
What Makes This Script Original?
Most scripts treat Supply/Demand and Entry Triggers as separate entities. The originality of the Sniper369 lies in its Strict Hierarchical Logic. It employs a "Two-Factor Authentication" system for trades:
1. Structural Validation: Identifying where "Smart Money" has historically left unfilled orders.
2. Liquidity Sweep Confirmation: Using the Enigma 369 logic to detect a specific manipulation pattern (a stop-run or "sweep") that occurs exclusively within those structural zones.
By using Pine Script v6 Object-Oriented Programming, the script manages dynamic arrays of boxes and lines that auto-delete upon mitigation, ensuring your chart remains a clean, actionable workspace.
Underlying Concepts & Calculations
1. Macro: Structural Supply & Demand
The indicator calculates zones based on Pivot Strength and Volatility Scaling.
Calculations: It scans for major structural pivots ( and ). Once a pivot is confirmed, it doesn't just draw a line; it calculates a zone width based on the Average True Range (ATR).
Why it works: Institutions do not enter at a single price; they enter in "pockets" of liquidity. Using ATR-based zones ensures that on high-volatility pairs (like Gold or GBP/JPY), your zones are appropriately wide, while on lower-volatility pairs, they remain tight and precise.
2. Micro: The Enigma 369 Sniper Logic
Once price enters a zone, the "Sniper" logic activates. This is based on the Institutional Wick-Liquidity concept.
The Sweep: The script looks for a candle that breaks the high/low of the previous candle (trapping "breakout" traders) but fails to hold that level.
The Mean Threshold (50% Wick): A core calculation of the Enigma logic is the midpoint of the rejection wick.
Calculation: for Sells.
Logic: Institutions often re-test the 50% level of a long wick to fill the remaining orders before the real move starts.
How to Use the Indicator
Step 1: Wait for Structural Alignment
Observe the Teal (Demand) and Red (Supply) boxes. These are your "Points of Interest" (POI). Do not take any trades until the price is physically touching or inside these boxes.
Step 2: Monitor for the Sniper Trigger
When the price is inside a zone, look for the appearance of the Solid and Dotted lines.
The Solid Line: This is the extreme of the manipulation candle. It serves as your structural invalidation level (Stop Loss).
The Dotted Line: This is the 50% Wick level. It is your "Sniper Entry" target.
Step 3: Execution & Alerts
The script features a built-in alert system that notifies you the moment a Sniper activation occurs inside a zone.
Conservative Entry: Place a Limit Order at the Dotted Line.
Aggressive Entry: Market enter on the close of the Sniper candle if the price has already reacted strongly.
Exit: Target the opposing Supply or Demand zone for a high Risk-to-Reward ratio.
Technical Summary for Traders
Trend Detection: Uses an EMA-50 Filter to ensure Snipers only fire in the direction of the dominant trend (optional).
Scalping/Day Trading: Optimized for the 1m, 5m, and 15m timeframes, but functions perfectly on 4H/Daily for swing traders.
Dynamic Cleanup: The script automatically deletes lines if the price closes past them, signaling that the "Liquidity Grab" was actually a breakout, thus preventing you from entering a losing trade.

Hybrid Strategy: Trend/ORB/MTFHybrid Strategy: Trend + ORB + Multi-Timeframe Matrix
This script is a comprehensive "Trading Manager" designed to filter out noise and identify high-probability breakout setups. It combines three powerful concepts into a single, clean chart interface: Trend Alignment, Opening Range Breakout (ORB), and Multi-Timeframe (MTF) Analysis.
It is designed to prevent "analysis paralysis" by providing a unified Dashboard that confirms if the trend is aligned across 5 different timeframes before you take a trade.
How it Works
The strategy relies on the "Golden Trio" of confluence:
1. Trend Definition (The Setup) Before looking for entries, the script analyzes the immediate trend. A bullish trend is defined as:
Price is above the Session VWAP.
The fast EMA (9) is above the slow EMA (21). (The inverse applies for bearish trends).
2. The Signal (The Trigger) The script draws the Opening Range (default: first 15 minutes of the session).
Buy Signal: Price breaks above the Opening Range High while the Trend is Bullish.
Sell Signal: Price breaks below the Opening Range Low while the Trend is Bearish.
3. The Confirmation (The Filter) A signal is only valid if the Higher Timeframe (default: 60m) agrees with the direction. If the 1m chart says "Buy" but the 60m chart is bearish, the signal is filtered out to prevent false breakouts.
Key Features
The Matrix Dashboard A zero-lag, real-time table in the corner of your screen that monitors 5 user-defined timeframes (e.g., 5m, 15m, 30m, 60m, 4H).
Trend: Checks if Price > EMA 21.
VWAP: Checks if Price > VWAP.
ORB: Checks if Price is currently above/below the Opening Range of that session.
D H/L: Warns if price is near the Daily High or Low.
PD H/L: Warns if price is near the Previous Daily High or Low.
Visual Order Blocks The script automatically identifies valid Order Blocks (sequences of consecutive candles followed by a strong explosive move).
Chart: Draws Green/Red zones extending to the right, showing where price may react.
Dashboard: Displays the exact High, Low, and Average price of the most recent Order Blocks for precision planning.
Risk Management (Trailing Stop) Once a trade is active, the script plots Chandelier Exit dots (ATR-based trailing stop) to help you manage the trade and lock in profits during trend runs.
Visual Guide (Chart Legend)
⬜ Gray Box: Represents the Opening Range (first 15 minutes). This is your "No Trade Zone." Wait for price to break out of this box.
🟢 Green Line: The Opening Range High. A break above this line signals potential Bullish momentum.
🔴 Red Line: The Opening Range Low. A break below this line signals potential Bearish momentum.
🟢 Green / 🔴 Red Zones (Boxes): These are Order Blocks.
🟢 Green Zone: A Bullish Order Block (Demand). Expect price to potentially bounce up from here.
🔴 Red Zone: A Bearish Order Block (Supply). Expect price to potentially reject down from here.
⚪ Dots (Trailing Stop):
🟢 Green Dots: These appear below price during a Bullish trend. They represent your suggested Stop Loss.
🔴 Red Dots: These appear above price during a Bearish trend.
🏷️ Buy / Sell Labels:
BUY: Triggers when Price breaks the Green Line + Trend is Bullish + HTF is Bullish.
SELL: Triggers when Price breaks the Red Line + Trend is Bearish + HTF is Bearish.
Settings
Session: Customizable RTH (Regular Trading Hours) to filter out pre-market noise.
Matrix Timeframes: 5 fixed slots to choose which timeframes you want to monitor.
Order Blocks: Adjust the sensitivity and lookback period for Order Block detection.
Risk: Customize the ATR multiplier for the trailing stop.
Disclaimer
This tool is for educational purposes only. Past performance does not guarantee future results. Always manage your risk properly.

Trade Setup A+ [v.8 Fixed Lines]🚀 Trade Setup A+ : Liquidity Hunter System (XAUUSD)
This indicator is an "All-in-One" trading system designed specifically for XAUUSD (Gold) Scalping and Swing trading. It combines Smart Money Concepts (SMC) with Price Action to identify high-probability setups by tracking liquidity pools and institutional order blocks.
💎 Key Features (v.8 Updated):
Auto Order Blocks (Clean View):
Automatically detects and draws Bullish (Green) and Bearish (Red) Order Blocks based on swing points.
Clean Look: Limits display to the last 5 active zones to keep the chart clutter-free.
Liquidity Levels (Fixed Lines):
D-High / D-Low: Thin lines representing Previous Day’s High & Low.
W-High / W-Low: Thick lines representing Previous Week’s High & Low (Strong Support/Resistance).
Dual Entry Signals:
Method 1 (Sniper): Shows a Diamond Icon (💎) when price touches an Order Block zone (Reversal setup).
Method 2 (Follow): Shows a Triangle Arrow (🔼/🔽) when price crosses EMA 14 with trend confirmation from EMA 49.
Macro Time Zones:
Highlights high-volume trading sessions (Asia, London, NY) on the background to identify "Killzones".
📈 How to Trade:
BUY Signal: Look for a Green Diamond (Touch OB) or Green Triangle (Price > EMA 14 & 49).
SELL Signal: Look for a Red Diamond (Touch OB) or Orange Triangle (Price < EMA 14).
Best Time: Trade when signals align with highlighted Macro Time zones.
⚠️ Disclaimer: This tool is for educational purposes only. Always use proper risk management.
🚀 Trade Setup A+ : ระบบเทรดล่าสภาพคล่อง (สำหรับทองคำ)
อินดิเคเตอร์ชุดนี้ออกแบบมาเพื่อเทรด XAUUSD (ทองคำ) โดยเฉพาะ ผสมผสานเทคนิค SMC (Smart Money Concepts) และ Price Action เพื่อหาจุดเข้าที่มีความแม่นยำสูง (High Probability) โดยเน้นการดักจับสภาพคล่องของรายใหญ่ค่ะ
💎 ฟีเจอร์หลัก (อัปเดตล่าสุด v.8):
Auto Order Blocks (แบบคลีน):
สร้างกล่องโซนซื้อขาย (Supply/Demand) ให้อัตโนมัติ (สีเขียว = โซน Buy, สีแดง = โซน Sell)
Clean Look: ระบบจะโชว์เฉพาะ 5 กล่องล่าสุดเท่านั้น เพื่อไม่ให้กราฟรกสายตา
Liquidity Levels (เส้นแนวรับต้าน):
D-High / D-Low: เส้นบาง แสดงราคาสูงสุด/ต่ำสุดของ "เมื่อวาน" (Day)
W-High / W-Low: เส้นหนา แสดงราคาสูงสุด/ต่ำสุดของ "สัปดาห์ที่แล้ว" (Week) ซึ่งเป็นแนวรับต้านที่แข็งแกร่ง
สัญญาณเข้าเทรด 2 แบบ (Dual Signals):
วิธีที่ 1 (Sniper): แสดงรูป เพชร (💎) เมื่อราคาวิ่งชนขอบกล่อง Order Block (ดักจุดกลับตัวปลายไส้)
วิธีที่ 2 (Follow Trend): แสดงรูป ลูกศรสามเหลี่ยม (🔼/🔽) เมื่อราคาตัดเส้น EMA ตามเงื่อนไข (Buy ต้องยืนเหนือ EMA 14 และ 49)
Macro Time (ช่วงเวลาทำเงิน):
ระบายสีพื้นหลังบอกช่วงเวลาที่ตลาดวิ่งแรง (Asia, London, NY) เพื่อให้โฟกัสถูกจุด
📈 วิธีใช้งาน:
ขา BUY: รอสัญญาณ เพชรสีเขียว (ชนกล่องรับ) หรือ ลูกศรเขียว (ตามเทรนด์)
ขา SELL: รอสัญญาณ เพชรสีแดง (ชนกล่องต้าน) หรือ ลูกศรส้ม (ตามเทรนด์)
คำแนะนำ: ประสิทธิภาพสูงสุดเมื่อสัญญาณเกิดในช่วงเวลา Macro Time (แถบสีพื้นหลัง)

T-DOW-FLOW: Final Edition
T-DOW-FLOW: Market Structure & Smart Pivot Zones
This indicator is a comprehensive technical analysis tool designed to visualize "Market Structure" based on Dow Theory and precise Supply/Demand Zones. It helps traders identify the true market trend and high-probability reaction levels by analyzing raw price action (ZigZag Pivots) rather than lagging indicators.
The script integrates three core systems:
ZigZag Trend Cloud: Visualizes the market bias (Uptrend/Downtrend).
Smart Pivot Zones (Type 1): Highlights the specific "Wick-to-Body" area of recent pivots.
Auto Density Channels (Type 2): Detects historical support/resistance clusters.
1. ZigZag Trend Identification
Logic: The script utilizes ta.highestbars and ta.lowestbars to detect Swing Highs and Swing Lows.
Trend Cloud:
If the structure creates a Higher High, the background cloud turns Green (Uptrend).
If the structure creates a Lower Low, the background cloud turns Red (Downtrend).
This provides an instant visual filter for "Trend Flow," encouraging traders to trade only in the direction of the dominant market structure.
2. SR Type 1: Smart Pivot Zones (Wick-to-Body)
Unlike standard indicators that draw thin lines at the absolute High/Low, this script focuses on the "Imbalance Zone".
It calculates the price range between the Pivot's Wick and the Pivot's Body (Open/Close) and fills this area with a colored zone.
Why? The area between the wick and body often represents the precise zone where institutional orders were filled, acting as a more reliable support/resistance level than a single price point.
3. SR Type 2: Auto Density Channels
This module scans a significant amount of historical data (default: 300 bars) to find clusters of pivot points.
Areas where multiple pivots align within a specific width are drawn as Channels. These represent strong, long-term psychological levels.
Trend Filter: Check the Trend Cloud color.
Green: Look for Long opportunities.
Red: Look for Short opportunities.
Entry Trigger: Wait for the price to retrace into a Smart Pivot Zone (Type 1) or an Auto Channel (Type 2).
Look for price rejection (wicks) at these zones in the direction of the Trend Cloud.
Structure Confirmation: Use the ZigZag lines and labels (HH, HL, etc.) to confirm that the market structure is still intact before entering.
ZigZag Settings: Adjust the sensitivity of the trend detection.
SR Type 1: Toggle the "Wick-to-Body" fill and choose between Wicks or Bodies as the primary source.
SR Type 2: Adjust the historical loopback period and channel width sensitivity.
This script is for educational and technical analysis purposes only. Past performance does not guarantee future results.
(以下、日本語説明 / Japanese Description)
このインジケーターは、「ダウ理論」に基づくトレンド判定と、精密な「需給ゾーン(Supply/Demand)」を可視化するための市場構造分析ツールです。 遅行指標を使わず、純粋なプライスアクション(ZigZagピボット)に基づいて、機関投資家の意識する価格帯を特定します。
1. ZigZagトレンドクラウド
ロジック: 一定期間の高値・安値を検出し、ダウ理論に基づいてトレンドを判定します。
視覚化: 高値切り上げ(上昇トレンド)なら「緑」、安値切り下げ(下落トレンド)なら「赤」の背景色を表示します。これにより、トレードすべき方向(順張り)を一目で判断できます。
2. SR Type 1: スマートピボットゾーン (Wick-to-Body)
単なる水平線ではなく、ローソク足の**「ヒゲ先」から「実体」までの価格差**をゾーンとして塗りつぶして表示します。
理由: ヒゲと実体の間の領域は、大口の注文が執行された(需給の不均衡が発生した)重要なエリアであることが多く、ピンポイントのラインよりも信頼性の高い反発ゾーンとして機能します。
3. SR Type 2: オート・デンシティ・チャネル
過去の長期間(デフォルト300本)のデータをスキャンし、ピボットが密集している価格帯を自動で「チャネル」として描画します。長期的に意識される強力なレジサポ帯です。
環境認識: 背景のトレンドクラウドの色に従い、目線を固定します。
エントリー: 価格がSRゾーン(Type 1)やチャネル(Type 2)に引きつけて、反発する動きを確認してエントリーします。
構造確認: ZigZagラインとラベル(HH/HLなど)を見て、トレンドが崩れていないことを確認します。

Liquidation Heatmap [Alpha Extract]A sophisticated liquidity zone visualization system that identifies and maps potential liquidation levels based on swing point analysis with volume-weighted intensity measurement and gradient heatmap coloring. Utilizing pivot-based pocket detection and ATR-scaled zone heights, this indicator delivers institutional-grade liquidity mapping with dynamic color intensity reflecting relative liquidity concentration. The system's dual-swing detection architecture combined with configurable weight metrics creates comprehensive liquidation level identification suitable for strategic position planning and market structure analysis.
🔶 Advanced Pivot-Based Pocket Detection
Implements dual swing width analysis to identify potential liquidation zones at pivot highs and lows with configurable lookback periods for comprehensive level coverage. The system detects primary swing points using main pivot width and optional secondary swing detection for increased pocket density, creating layered liquidity maps that capture both major and minor liquidation levels across extended price history.
🔶 Multi-Metric Weight Calculation Engine
Features flexible weight source selection including Volume, Range (high-low spread), and Volume × Range composite metrics for liquidity intensity measurement. The system calculates pocket weights based on market activity at pivot formation, enabling traders to identify which liquidation levels represent higher concentration of potential stops and liquidations with configurable minimum weight thresholds for noise filtering.
🔶 ATR-Based Zone Height Framework
Utilizes Average True Range calculations with percentage-based multipliers to determine pocket vertical dimensions that adapt to market volatility conditions. The system creates ATR-scaled bands above swing highs for short liquidation zones and below swing lows for long liquidation zones, ensuring zone heights remain proportional to current market volatility for accurate level representation.
🔶 Dynamic Gradient Heatmap Visualization
Implements sophisticated color gradient system that maps pocket weights to intensity scales, creating intuitive visual representation of relative liquidity concentration. The system applies power-law transformation with configurable contrast adjustment to enhance differentiation between weak and strong liquidity pockets, using cyan-to-blue gradients for long liquidations and yellow-to-orange for short liquidations.
🔶 Intelligent Pocket State Management
Features advanced pocket tracking system that monitors price interaction with liquidation zones and updates pocket states dynamically. The system detects when price trades through pocket midpoints, marking them as "hit" with optional preservation or removal, and manages pocket extension for untouched levels with configurable forward projection to maintain visibility of approaching liquidity zones.
🔶 Real-Time Liquidity Scale Display
Provides gradient legend showing min-max range of pocket weights with 24-segment color bar for instant liquidity intensity reference. The system positions the scale at chart edge with volume-formatted labels, enabling traders to quickly assess relative strength of visible liquidation pockets without numerical clutter on the main chart area.
🔶 Touched Pocket Border System
Implements visual confirmation of executed liquidations through border highlighting when price trades through pocket zones. The system applies configurable transparency to touched pocket borders with inverted slider logic (lower values fade borders, higher values emphasize them), providing clear historical record of liquidated levels while maintaining focus on active untouched pockets.
🔶 Dual-Swing Density Enhancement
Features optional secondary swing width parameter that creates additional pocket layer with tighter pivot detection for increased liquidation level density. The system runs parallel pivot detection at both primary and secondary swing widths, populating chart with comprehensive liquidity mapping that captures both major swing liquidations and intermediate level clusters.
🔶 Adaptive Pocket Extension Framework
Utilizes intelligent time-based extension that projects untouched pockets forward by configurable bar count, maintaining visibility as price approaches potential liquidation zones. The system freezes touched pocket right edges at hit timestamps while extending active pockets dynamically, creating clear distinction between historical liquidations and forward-projected active levels.
🔶 Weight-Based Label Integration
Provides floating labels on untouched pockets displaying volume-formatted weight values with dynamic positioning that follows pocket extension. The system automatically manages label lifecycle, creating labels for new pockets, updating positions as pockets extend, and removing labels when pockets are touched, ensuring clean chart presentation with relevant liquidity information.
🔶 Performance Optimization Framework
Implements efficient array management with automatic clean-up of old pockets beyond lookback period and optimized box/label deletion to maintain smooth performance. The system includes configurable maximum object counts (500 boxes, 50 labels, 100 lines) with intelligent removal of oldest elements when limits are approached, ensuring consistent operation across extended timeframes.
This indicator delivers sophisticated liquidity zone analysis through pivot-based detection and volume-weighted intensity measurement with intuitive heatmap visualization. Unlike simple support/resistance indicators, the Liquidation Heatmap combines swing point identification with market activity metrics to identify where concentrated liquidations are likely to occur, while the gradient color system instantly communicates relative liquidity strength. The system's dual-swing architecture, configurable weight metrics, ATR-adaptive zone heights, and intelligent state management make it essential for traders seeking strategic position planning around institutional liquidity levels across cryptocurrency, forex, and futures markets. The visual heatmap approach enables instant identification of high-probability reversal zones where cascading liquidations may trigger significant price reactions.

Ultimate_Price_Action_Tool_V2 by chaitu50cUltimate_Price_Action_Tool_V2 by chaitu50c — Session-Based SR Box Engine
This indicator builds clean, session-aware support and resistance “zones” from pure price action. It is designed for intraday and positional traders who want objective, rule-based zones instead of manual drawing.
Core Logic
Price-action based MAIN zones
Detects bullish and bearish breakouts using a strict body-structure:
Single-candle and double-candle breakout patterns.
Breakouts are confirmed only when closes break beyond previous highs/lows.
From each valid breakout, the tool builds a MAIN Support or MAIN Resistance box:
For bullish breaks, the zone is created from a combined low to the nearest open/close in the breakout combo.
For bearish breaks, the zone is created from a combined high to the nearest open/close in the breakout combo.
Optional first-box logic:
Can create the very first MAIN zone in a session from a simple opposite-color pair (without a full breakout), if enabled.
SUB zones on break
When price breaks a MAIN Support downwards with a red candle, the MAIN box is removed/frozen and:
A new SUB Resistance box is created above, using the current bar’s structure.
When price breaks a MAIN Resistance upwards with a green candle:
A new SUB Support box is created below.
SUB zones are optional and can be fully disabled if the user prefers a clean MAIN-only view.
Session Handling
The script is fully session-aware and can work in different market structures:
Session Mode options
Clock Session
Uses a fixed time window (e.g., 09:15–15:30).
Zones can be shown only inside the session or kept visible outside, depending on settings.
New Day
Each new trading day is treated as a fresh session.
Auto Gap
A new session starts whenever the time gap between candles exceeds a user-defined threshold (in minutes).
Session IDs and history
Each new session gets its own ID.
You can display zones for the last N sessions (including current).
Older sessions fade out visually but remain internally tracked to control visibility.
Main Features & Options
Initial Right Offset
Every new zone is projected to the right by a configurable number of bars.
All active boxes continuously extend with this offset, keeping zones clearly projected into the future.
Single MAIN per side (per session)
Optional constraint to have only:
One active MAIN Support and
One active MAIN Resistance
per session on the chart.
This prevents overcrowding and focuses on the most recent key structure.
MAIN vs SUB Overlap Control
When a new MAIN zone overlaps an existing SUB zone, you can choose:
Suppress MAIN (ignore the new MAIN if it clashes with a SUB),
Remove SUB (delete overlapping SUB zones and keep the new MAIN), or
Allow Both (plot everything and let the trader decide).
Vertical overlap is evaluated using a configurable minimum overlap percentage.
SUB suppression under MAIN
SUB boxes that overlap strongly with active MAIN zones can be auto-suppressed to avoid redundant clutter.
This suppression uses the same percent-based overlap logic.
Broken MAIN box handling
When a MAIN zone is broken:
Option 1: Fully delete it (classic behavior).
Option 2: Convert it into a 1-bar “marker” box at its origin, so you still see where the original zone formed without extending into the future.
Break candle coloring
The candle that breaks a MAIN zone can be optionally painted:
Red when breaking support.
Green when breaking resistance.
Helps visually confirm genuine breaks vs. simple intrabar tests.
Visual & Styling Controls
Separate style controls for:
MAIN Support / MAIN Resistance
Independent fill and border colors.
SUB Support / SUB Resistance
Independent fill and border colors.
Opacity and border colors are internally managed so that:
Recent sessions are clearly visible.
Older sessions are softly faded to maintain context without noise.
Typical Use Cases
Intraday traders looking for:
Clean, rule-based supply and demand zones.
Zones that respect actual session structure (clock, daily, or gap-based).
Swing traders who:
Want to track how current price reacts to the most recent 1–N sessions’ zones.
Price action traders who:
Prefer breakout-based zones rather than indicator-driven levels.
Need automatic zone management (creation, extension, break handling, and suppression).
This tool is built to be modular and configurable: you can run it minimal (only MAIN zones, single side per session) or fully featured (MAIN + SUB, multi-session history, overlap handling, and break paints). All logic is strictly price-action based with no dependency on volume or external indicators.

Viprasol Elite Flow Pro - Premium Order Flow & Trend System═══════════════════════════════════════════════════════════════
🔥 VIPRASOL ELITE FLOW PRO
Professional Order Flow & Trend Detection System
═══════════════════════════════════════════════════════════════
📊 WHAT IS THIS INDICATOR?
Viprasol Elite Flow Pro is a comprehensive trading system that combines institutional order flow analysis with adaptive trend detection. Unlike basic indicators, this tool identifies high-probability setups by analyzing where smart money is likely positioning, while filtering signals through multiple confirmation layers.
This indicator is designed for traders who want to:
✓ Identify premium (supply) and discount (demand) zones automatically
✓ Detect trend direction with adaptive cloud technology
✓ Spot high-volume rejection points before major moves
✓ Filter low-quality signals with intelligent confirmation logic
✓ Track market strength in real-time via elite dashboard
═══════════════════════════════════════════════════════════════
🎯 CORE FEATURES
═══════════════════════════════════════════════════════════════
1️⃣ ELITE TREND ENGINE
• Adaptive Moving Average system (Fast/Adaptive/Smooth modes)
• Dynamic trend cloud that expands/contracts with volatility
• Real-time trend state tracking (Bullish/Bearish/Ranging)
• Trend strength meter (0-10 scale)
• ATR-based volatility adjustments
2️⃣ ORDER FLOW DETECTION
• Automatic Premium Zone (Supply) identification
• Automatic Discount Zone (Demand) identification
• Smart zone extension - zones remain valid until broken
• Zone rejection detection with price action confirmation
• Customizable zone strength (5-30 bars lookback)
3️⃣ VOLUME INTELLIGENCE
• Volume spike detection (configurable threshold)
• Climax bar identification (exhaustion signals)
• Volume filter for signal validation
• Institutional activity detection
4️⃣ SMART SIGNAL SYSTEM
• 3 Signal Modes: Aggressive, Balanced, Conservative
• Multi-layer confirmation logic
• Automatic profit targets (2:1 risk-reward)
• Stop loss suggestions based on ATR
• Prevents overtrading with bars-since-signal filter
5️⃣ ELITE DASHBOARD (HUD)
• Real-time trend direction and strength
• Volume status monitoring
• Active zones counter
• Market volatility gauge
• Current signal status
• 4 positioning options, compact mode available
6️⃣ PREMIUM STYLING
• 4 Professional color themes (Cyber/Gold/Ocean/Fire)
• Adjustable transparency and label sizes
• Clean, institutional-grade visuals
• Optimized for all chart types
═══════════════════════════════════════════════════════════════
📖 HOW TO USE THIS INDICATOR
═══════════════════════════════════════════════════════════════
STEP 1: TREND IDENTIFICATION
→ Green Cloud = Bullish trend - look for LONG opportunities
→ Red Cloud = Bearish trend - look for SHORT opportunities
→ Purple Cloud = Ranging - wait for breakout or fade extremes
STEP 2: ZONE ANALYSIS
→ PREMIUM (Red) zones = Potential resistance/supply areas
→ DISCOUNT (Green) zones = Potential support/demand areas
→ Price rejecting from zones = high-probability setups
STEP 3: SIGNAL CONFIRMATION
→ Wait for "LONG" or "SHORT" labels to appear
→ Check dashboard for trend strength (Moderate/Strong preferred)
→ Confirm volume status is "HIGH" or "CLIMAX"
→ Entry: Enter when label appears
→ Stop Loss: Use dotted line (1 ATR away)
→ Take Profit: Use dashed line (2 ATR away)
STEP 4: RISK MANAGEMENT
→ Never risk more than 1-2% per trade
→ Use the provided stop loss levels
→ Trail stops as price moves in your favor
→ Avoid trading during low volatility periods
═══════════════════════════════════════════════════════════════
⚙️ RECOMMENDED SETTINGS
═══════════════════════════════════════════════════════════════
FOR SCALPING (1M - 5M):
- Trend Type: Fast
- Sensitivity: 15
- Signal Mode: Aggressive
- Zone Strength: 8
FOR DAY TRADING (15M - 1H):
- Trend Type: Adaptive
- Sensitivity: 21 (default)
- Signal Mode: Balanced
- Zone Strength: 12 (default)
FOR SWING TRADING (4H - Daily):
- Trend Type: Smooth
- Sensitivity: 34
- Signal Mode: Conservative
- Zone Strength: 20
BEST MARKETS:
✓ Crypto (BTC, ETH, major altcoins)
✓ Forex (Major pairs: EUR/USD, GBP/USD)
✓ Indices (S&P 500, NASDAQ, DAX)
✓ High-liquidity stocks
═══════════════════════════════════════════════════════════════
🎓 UNDERSTANDING THE METHODOLOGY
═══════════════════════════════════════════════════════════════
This indicator is built on three core concepts:
1. ORDER FLOW THEORY
Markets move between premium (expensive) and discount (cheap) zones. Smart money accumulates in discount zones and distributes in premium zones. This indicator identifies these zones automatically.
2. ADAPTIVE TREND FOLLOWING
Unlike fixed-period moving averages, the Elite Trend Engine adjusts to current market volatility, providing more accurate trend signals in both trending and ranging conditions.
3. CONFLUENCE-BASED ENTRIES
Signals only trigger when multiple conditions align:
- Price in correct zone (premium for shorts, discount for longs)
- Trend confirmation (cloud color matches direction)
- Volume validation (spike or climax present)
- Price action strength (strong rejection candles)
This multi-layer approach dramatically reduces false signals.
═══════════════════════════════════════════════════════════════
🔔 ALERT SETUP
═══════════════════════════════════════════════════════════════
This indicator includes 5 alert types:
1. Long Signal → Triggers when buy conditions met
2. Short Signal → Triggers when sell conditions met
3. Volume Climax → Warns of pot

Directional Strength and Momentum Index█ OVERVIEW
“Directional Strength and Momentum Index” (DSMI) is a technical analysis indicator inspired by DMI, but due to different source data, it produces distinct results. DSMI combines direction measurement, trend strength, and overheat levels into a single index, enhanced with gradient fills, extreme zones, entry signals, candle coloring, and a summary table.
█ CONCEPT
The classic DMI, despite its relatively simple logic, can seem somewhat chaotic due to separate +DI and -DI lines and the need for manual interpretation of their relationships. The DSMI indicator was created to increase clarity and speed up results, consolidating key information into a single index from 0 to 100 that simultaneously:
- Indicates trend direction (bullish/bearish)
- Measures movement strength
- Identifies overheat levels
- Generates ready entry signals
DMI (ADX + +DI / -DI) measures trend direction and strength, but does so based solely on comparing price movements between candles. ADX shows whether the trend is orderly and growing (e.g., above 20–30), but does not assess how dynamic the movement is.
DSMI, on the other hand, takes into account candle size and actual market aggression, thus showing directional momentum — whether the trend has real “fuel” to sustain or accelerate, not just whether it is orderly.
The main calculation difference involves replacing True Range with candle size (high-low) and using directional EMA instead of Wilder smoothing. This allows DSMI to react faster to momentum changes, eliminating delays typical of classic DMI based on TR.
This gives the trader an immediate picture of the market situation without analyzing multiple lines.
█ FEATURES
DSMI Main Line:
- EMA(Directional Index) based on +DS and -DS
- Scale 0–100, smooth color gradient depending on strength
+DS / -DS:
- Positive and Negative Directional Strength
- Gradient fill between lines — more intense with stronger trend
Extreme Zones:
- Default 20 and 80
- Gradient fill outside zones
Trend Strength Levels:
- Weak (<10) → neutral
- Moderate (up to 35)
- Strong (up to 45)
- Overheated (up to 55)
- Extreme (>55)
All levels editable
Entry Signals:
- Activated on crossing entry level (default 20)
Or on direction change when DSMI already ≥ entry level
- Highlighted background (green/red)
Candle Coloring:
- According to current trend
Trend Strength Table:
- Top-right corner
- Shows current strength (WEAK/STRONG etc.) + DSMI value
Alerts:
- DSMI Bullish Entry
- DSMI Bearish Entry
█ HOW TO USE
Add to Chart: Paste code in Pine Editor or find in indicator library.
Settings:
DSMI Parameters:
- DSMI Period → default 20
- Show DSMI Line → on/off
Extreme Zones:
- Lower Level → default 20
- Upper Level → default 80
Trend Strength Levels:
- Weak, Moderate, Strong, Overheated → adjust to strategy
Trend Colors:
- BULLISH → default green
- BEARISH → default red
- NEUTRAL → gray
Entry Signals:
- Show Highlight → on/off
- DSMI Entry Level → default 20
Signal Interpretation:
- DSMI Line: Main strength indicator.
- Gradient between +DS and -DS: Visualizes side dominance.
- Crossing 18 with direction confirmation → entry signal.
- Extreme Zones: Potential reversal or continuation points after correction.
- Table: Quick overview of current trend condition.
█ APPLICATIONS
The indicator works well in:
- Trend-following: Enter on signal, exit on direction change or overheat. When a new trend appears, consider entering a position, preferably with a rising trend strength indicator.
- Scalping/daytrading: Shorter period (7–10), lower entry level.
- Swing/position: Longer period (20–30), higher entry level, extreme zones as filters.
- Noise filtering: Ignores consolidation below “Weak” – increasing value e.g. to 15 highlights consolidation zones, but no signals appear there.
Style Adjustment:
- Aggressive strategies → shorten period and entry level
- Conservative → extend period, raise entry level (25–30), watch “Overheated”
“Weak” level (<10 default) → neutral; increasing it e.g. to 15 gives fewer but higher-quality signals. The Weak zone value controls the level below which no signals appear, and the gradient turns gray (often aligned with consolidation zones).
Combine with:
- Support/resistance levels
- Fair Value Gaps (FVG)
- Volume (Volume Profile, VWAP)
- Other oscillators (RSI, Stochastic)
█ NOTES
- Works on all markets and timeframes.
- Adjust period and levels to instrument volatility.
- Higher entry level → fewer signals, higher quality.
- Neutral color below “Weak” – avoids trading in consolidation.
- Gradient and table enable quick assessment without line analysis.

NY/LDN/TOK Stock Exchange Opening HoursThis indicator displays vertical dotted lines marking the exact opening times of the three major global stock exchanges: New York (NYSE), London (LSE), and Tokyo (TSE). Perfect for traders who need to track market opening sessions across different time zones.
Features:
New York Stock Exchange (NYSE): 9:30 AM EST/EDT
London Stock Exchange (LSE): 8:00 AM GMT/BST
Tokyo Stock Exchange (TSE): 9:00 AM JST
Key Highlights:
✓ Automatic daylight saving time adjustments for NY and London
✓ Individual color customization for each market
✓ Toggle on/off functionality for each exchange
✓ Clean vertical dotted lines (1-pixel width) that extend across the entire chart
✓ Interactive legend in bottom-right corner showing active markets
✓ Weekdays only (Monday-Friday) - no weekend lines
✓ Uses official local time zones for accurate timing
Customizable Settings:
Enable/disable individual exchanges
Custom color selection for each market line
Dynamic legend that shows only enabled markets
Time Zone Handling:
The indicator automatically handles daylight saving time transitions using official time zones:
America/New_York (EST/EDT)
Europe/London (GMT/BST)
Asia/Tokyo (JST - no DST)
Perfect for:
Multi-market traders
Session overlap analysis
Global market timing coordination
Institutional trading schedules
Simply add to your chart and customize colors/visibility in the indicator settings. The legend will automatically update to show your active markets in their respective colors.

X Opens+Overview:
The X Opens+ indicator is a precision tool designed for traders seeking to analyze market structure and behavior around key timeframe opens. It highlights the open prices of custom-selected higher timeframes—such as daily, weekly, or monthly sessions—and visualizes them directly on lower timeframes. These open levels often coincide with high-volume zones, market imbalance, and institutional interest, making them powerful reference points for intraday and swing trading strategies.
Key Features:
Custom Timeframe Anchoring: Users can select any timeframe (e.g., daily, 4H, 1W) to display its current and previous session opens directly on their active chart. This allows for flexible multi-timeframe analysis within a single view.
Price Reaction Zones: Timeframe opens are frequently areas of heightened liquidity and directional bias. By identifying these opens and their relationship to current price action, traders can anticipate areas of support/resistance, trend continuation, or reversal.
Derived Midpoints and Ranges: The indicator also computes and displays the previous session’s range midpoint (EQ), as well as extension bands (e.g., ±1.0x or ±1.5x the prior range). These levels are useful for contextualizing volatility expansion and identifying breakout or fade setups around key open zones.
Historical Session Mapping: In addition to live opens, the tool optionally displays opens and range-based levels from previous sessions. This historical layering gives traders a broader context of how price has respected or rejected these levels over time.
Labeling and Customization: Each level can be labeled and color-coded to match user preferences. The visibility, size, and style of each element (e.g., lines, labels, bands) are fully configurable for visual clarity and user alignment.
Use Cases:
Confirming bias around daily or weekly opens, especially during market opens or key economic releases.
Identifying equilibrium levels for mean reversion or continuation setups.
Using ±1.0 and ±1.5 range projections as dynamic targets or invalidation zones.
Anchoring to key sessions for volume profile or order flow-based strategies.
Summary:
X Opens+ is a data-driven utility that transforms static session opens into dynamic market tools. By spotlighting where institutional interest likely concentrates—at the opens of significant timeframes—this indicator provides traders with a structural edge in identifying key zones that influence price behavior throughout the trading day or week
