Willams %R with 13 EMA and Divergence FinderWilly 13 EMA
Features:
- Divergence finder
- Extreme conditions highlight
Buscar en scripts para "williams"

Willams %R with 13 EMA and middle pointWillams %R with 13 EMA and middle point. It also uses the textbook formula instead of the Tradingview one.
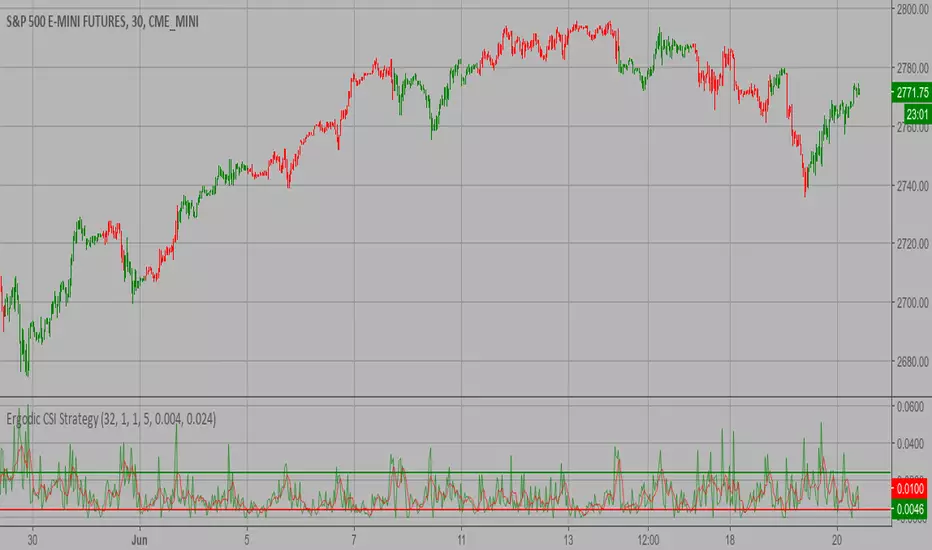
Ergodic CSI Strategy This is one of the techniques described by William Blau in his book
"Momentum, Direction and Divergence" (1995). If you like to learn more,
we advise you to read this book. His book focuses on three key aspects
of trading: momentum, direction and divergence. Blau, who was an electrical
engineer before becoming a trader, thoroughly examines the relationship between
price and momentum in step-by-step examples. From this grounding, he then looks
at the deficiencies in other oscillators and introduces some innovative techniques,
including a fresh twist on Stochastics. On directional issues, he analyzes the
intricacies of ADX and offers a unique approach to help define trending and
non-trending periods.
This indicator plots Ergotic CSI and smoothed Ergotic CSI to filter out noise.
WARNING:
- This script to change bars colors.
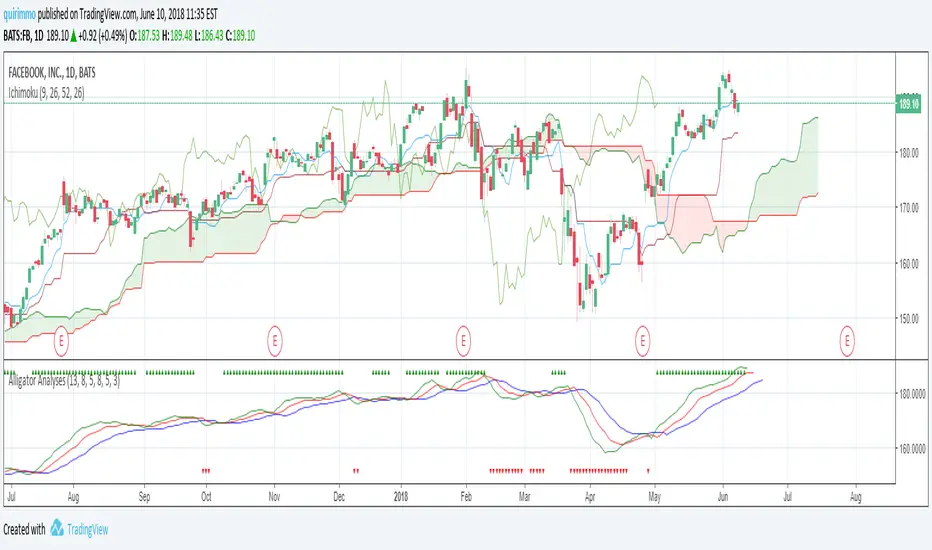
Alligator AnalysesA simple script in order to plot the Alligator Indicator with triangles plotted on the graph in order to see directly if the alligator is sleeping or eating.
You will see green up triangles when the alligator is bullish eating, while red down triangles when the alligator is bearish eating.
You will not see anything on the chart when the alligator is sleeping.
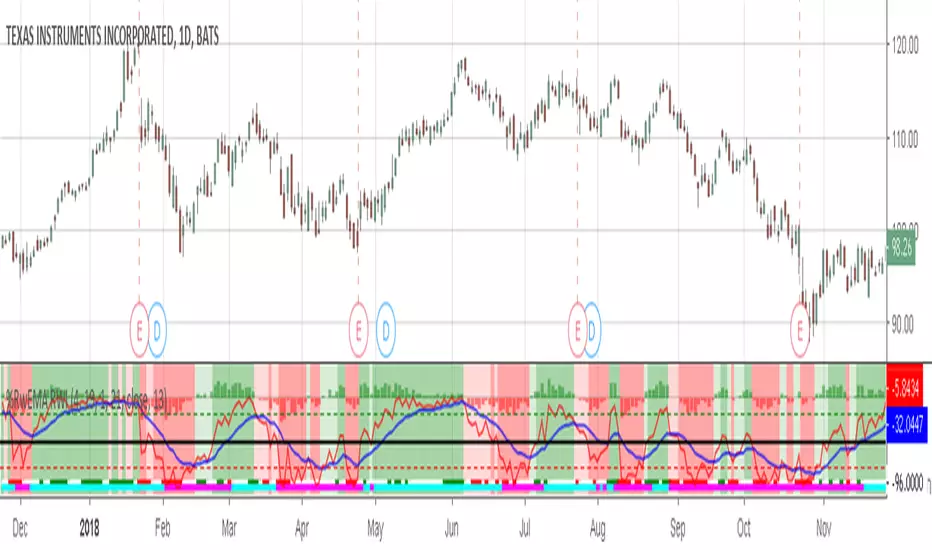
Willams %RwEMAspy
Was looking for something else when surfed into an old question
wanting %R 21 period with EMA 13 period of the %R signal
and being a rookie at this, made this code to post for them.
Tried to comment the script in such a way that other rookies
like me could make better sense of what is being done. Hope
this helps someone. I find it useful as one of my indicators for
trading.
Pinescript for tradingview.com user Tom1trader
All time frames.
Interpretation:
%R (Red) crosses above it's average (Blue) - bull
%R crosses below it's average - bear. Background
color changes green-up red-down with above crossings.
Most but not all of serious price movement takes place
from the time the %R (red) goes into oversold (or bought) and
exits again.
%R centerline crosses can also be useful.
I use various indicators and want all of the confirmation
that I can get for expectations BUT I never know what the
next bar will do and define my risks accordingly.
SMI Ergodic Oscillator The SMI Ergodic Indicator is the same as the True Strength Index (TSI) developed by
William Blau, except the SMI includes a signal line. The SMI uses double moving averages
of price minus previous price over 2 time frames. The signal line, which is an EMA of the
SMI, is plotted to help trigger trading signals. Adjustable guides are also given to fine
tune these signals. The user may change the input (close), method (EMA), period lengths
and guide values.
You can use in the xPrice any series: Open, High, Low, Close, HL2, HLC3, OHLC4 and ect...

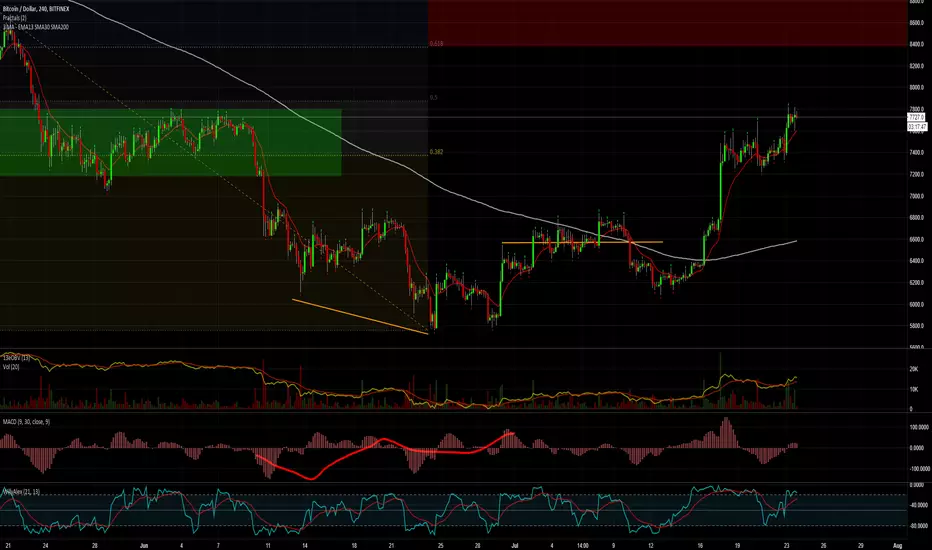
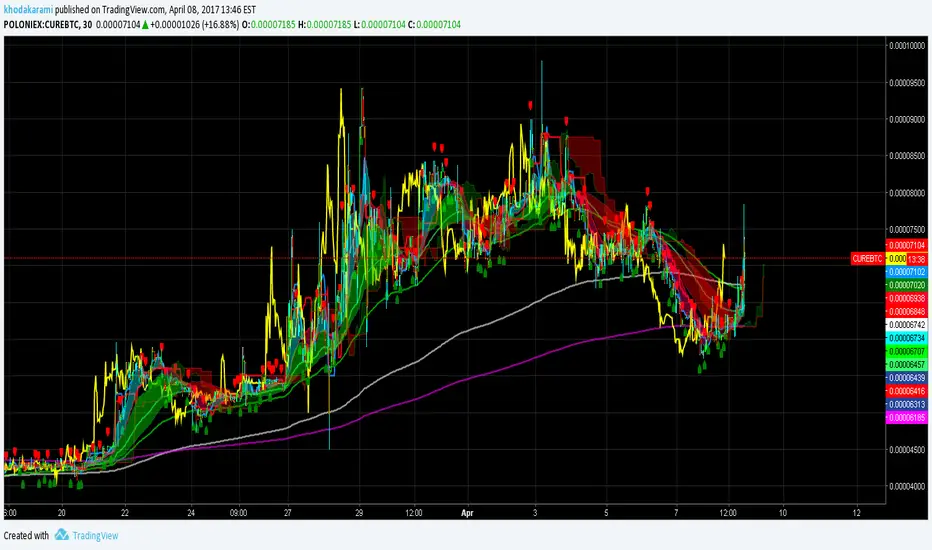
Guerrilla AdvancedThis indicator was designed with people without Pro License in mind (Including many of my close friends).
Basically, you will get a combo of few different tools in one box, with ability to turn them on and off with a single check mark, also, you have total control over the input numbers that was used in calculations if you so want to, for example, sometimes when i see a massive bullish up trend, i reduce the short rally from 12 to 8 even 6 to get faster signal for selling the trend.
So, what will you get in this pack?
1- Ichimoko. Yes, you heard it right, although we have it in the default tools but hey, it will use one indicator slot and if you don't have a pro license, you will use that slot
2- Rally. This is an old yet very powerful system for getting buy or sell signals, basically, you get two lines and for making the life easier i draw a cloud between them. when the trend passes above the cloud and it was bellow it in past, right after the very first candle that gets above the cloud you can put the buy order, and vice versa, the moment a candle body enters the cloud, if you want an aggressive signal, you can sell, if not, you may want to wait to see if the candles drop bellow the cloud or not then decide.
3- Resistance Support Cloud. Most of us always heard about resistance and support "lines" but many of us don't know that, in each trend, the trend line itself is a resistance or support line, and when you are going in a bullish or bearish tunnel, the floor and roof of tunnels are again resistance and supports, using this part of the tool, just like rally, you get a cloud that shows you the resistance / support "zone"
4- William Fractals. To be honest, I got this part of the code from another source available around. Why? looking at those fractal indicators, you can easily eyeball the trend line or existence of a tunnel.
5- Different EMA lines. If you are one of those people that use EMA lines for their trading, have fun with them, there are few different standard ones and even a custom one that you can put your desired number for it.
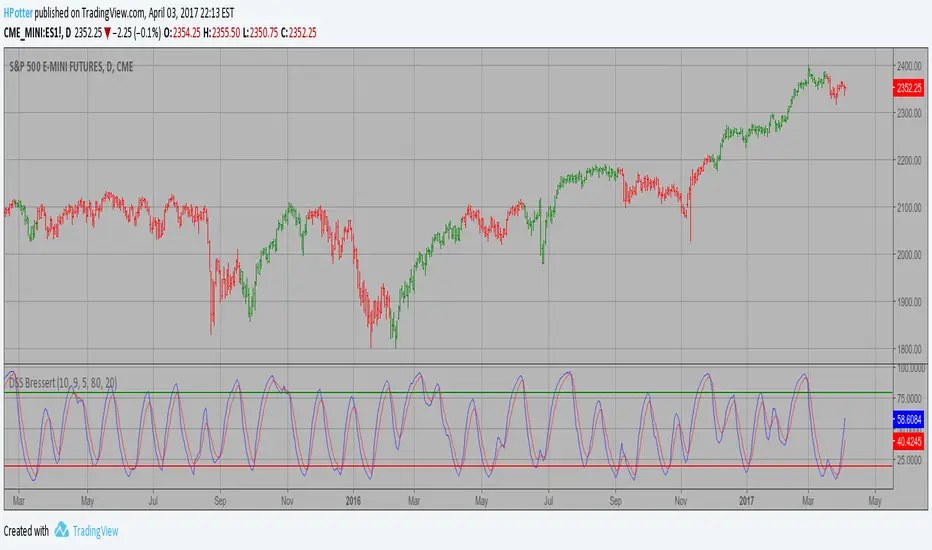
DSS Bressert (Double Smoothed Stochastic) Strategy Double Smoothed Stochastics (DSS) is designed by William Blaw.
It attempts to combine moving average methods with oscillator principles.
Enhanced Index [LazyBear]The Enhanced Index (EIDX) is a modified William %R that behaves much like the original, to indicate overbought and oversold market conditions.
EIDX has the advantage of
- Reacting more quickly to changes in buying power.
- Predicting market turning points better than other oscillators. Divergences are more pronounced.
List of my other indicators:

BEST ABCD Pattern Screener Deribit:DVOL BTC DXY scannerModified this script by Daveatt (based on Ricardo Santos Fractals)
to scan patterns in BTCUSD, ETHUSD, DVOL, DXY, DVOL/VV

Circular Barplot - Oscillators Sentiment [LuxAlgo]This indicator is an implementation of a circular barplot aiming to return the market sentiment given by multiple normalized oscillators. These include the relative strength index (RSI), Stochastic %K (%K), Linear Correlation Oscillator (ROSC), William Percent Range (WPR), Percent Rank (%R), and money flow index (MFI).
The length period of each of these oscillators can be adjusted in the indicator settings.
The label in the center of the circular plot returns the average market sentiment constructed from all the previously mentioned oscillators.
Settings
Width: Circle width.
Spacing: Determines how close each circle is to the other.
Thickness: Width of the colored lines.
Offset: Controls how far the circular barplot left extremity is from the most recent candles.
Src: Input source of the indicators.
Usage
Unlike regular bar charts, circular bar plots display the bars as circle arcs and have the advantage of preserving horizontal and vertical space. A higher arc length would indicate a value closer to the maximal value of the oscillator. Other variations of the circular barplots exist but this variation using the circle arc is particularly appropriate for normalized data.
The indicator can be used as a simple widget giving a quick method to obtain the overall market sentiment of a certain ticker. A dashboard is displayed on the top left of the chart in the event the user wants to see the actual value of the oscillators.
Note that low width or high spacing settings might return unwanted results.

RedK_Larry William's TrendI'm not the author of this indicator or the concept behind it
i found this code - written for another platform - while researching "Larry William's Trend" - while i also couldn't find that specific keyword in the TV public library. So thought to bring this in.
Also unfortunately there was no coder details to give credit to with the code i found. it seems this may somehow be related to the famous SuperTrend - but i have no idea how they are connected. i simply ported this to Pine in my own way.
will be happy if this is useful to some traders who use these types of trend indicators. if you do find it useful, pls leave a comment here - or feel free to take this code and modify it in any further way for your specific need.
we continue to learn and explore new tools everyday. good luck!

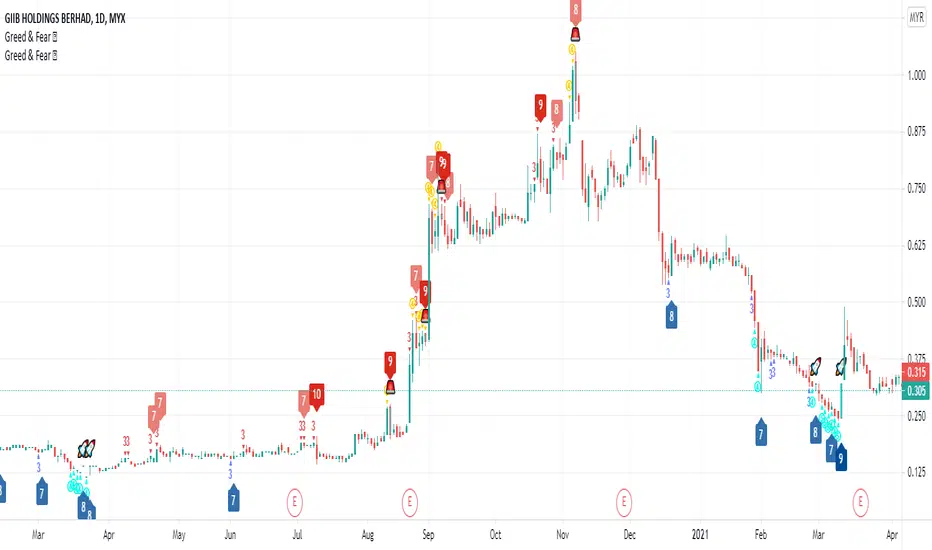
Greed and Fear ScoreHi All,
This is Greed and Fear Score script. The uses of this indicator is to let users know what is the state for each bar closed.
Warren Buffett once said that it is wise for investors to be “fearful when others are greedy, and greedy when others are fearful.
Greed & Fear Score (range from 1 - 5) has taken multiple measurements into consideration such as CCI, MFI, RSI, RVI and William %R.
The range of score is from 1 - 5 indicating weak to strong.
Red/Yellow represents Greed score.
Blue/Light Blue represents Fear score.
The Bull & Bear Transition Score (range from 1 - 10) is to measure how strong power needed to reverse the Greed or Fear State.
It is a powerful tool that incorporates CMF, MFI, CCI, MOMENTUM, OBV, RSI, RVI, WILLIAN %R, PRICE OSCILLATOR and Relative Volume.
How to use Bull & Bear Transition Score?
The higher the Bull & Bear Score, the more likely it will change from one state to another.
How to find BEST opportunity? Here comes the special symbol.
User can choose best fit combination by using filtering.
Matrix Series and Vix Fix with VWAP CCI and QQE SignalsBased on @ChrisMoody Williams_VIX_Fix and @glaz Matrix Series .
This indicator identify potential zone of reversal according to momentum and volatility.
Includes VWAP CCI and QQE Signals.

[TrustedSignals] Oscillator DivergencesDivergences are powerful tools that assess the price momentum and the likelihood of a price reversal. A positive divergence occurs when the price of an asset makes a new low while an oscillator, starts to climb. Conversely, a negative divergence is when the price makes a new high but the oscillator analyzed makes a lower high.
Once again, with the idea of providing an All-in-One indicator, this script can display the Divergences in up to 9 most used oscillators (RSI, Stochastic RSI, Stochastic, Williams%, MFI, ChangeMO, CCI, BB %B) including our own branded no-lag ‘ TS Oscillator ’
We have also included an optional custom no-lag smoothing function, that allows the user to smooth out the noise on all the oscillators and increase their accuracy, without delaying the actual data. This feature can be turned off if necessary and the smoothing length can be manually adjusted.
After the user selects from the first input the desired oscillator, the indicator can display Regular and Hidden Divergences on the chart.
The lookback period of the divergences is also fully configurable, as the settings for each of our individual oscillators.

Kairos QX Indicator [v1.7]What’s New in v1.7?
Streak Analytics (Dashboard Expansion):
The dashboard now tracks Winning and Losing Streaks.
Max Consec. (TP / SL): Displays the highest number of wins and losses that occurred in a row (e.g., 5 / 3).
Avg Consec. (TP / SL): Calculates the average length of your winning and losing streaks (e.g., 2.4 / 1.8).
Updated Default "settings" for MNQ 5 MIN Candles
Full Script Description
This script is a professional-grade Mean Reversion & Trend Following Engine designed for automated execution. It acts as a bridge between discretionary chart analysis and algorithmic trading, allowing you to backtest complex ideas visually and then automate them via alerts without writing code.
1. Core Logic: The "Flip Switch" Strategy
Standard Mode (Mean Reversion):
The script identifies "exhaustion" points where price pierces the Bollinger Bands.
It bets on a reversal (e.g., Price > Upper Band = Short).
Inverse Mode (Trend Following - Default):
With the "Inverse Trades" box checked, the logic flips.
It identifies "breakout" points where price pierces the bands.
It bets on continuation (e.g., Price > Upper Band = Long).
2. Advanced Automation & Safety Features
This system is built to drive trading bots (like TradersPost or 3Commas) safely:
State-Aware Execution: It tracks its own trades (in_trade state). It will never fire a duplicate "Open" signal if a trade is already active, preventing accidental pyramiding.
No Trade Zone (Force Close): You can define a specific time window (default 15:10–17:00). If a trade is open when this time hits, the script immediately triggers a Close Alert, preventing overnight holds.
Signal Cooldown: Configurable "Signals to Skip" allows you to force a cooldown period after a trade closes to avoid over-trading in choppy conditions.
3. Real-Time Analytics Dashboard
The on-chart table provides a transparent, real-time backtest of your settings:
Equity Calculator: You can set a dollar value per point (e.g., $2 for MNQ). The dashboard calculates your estimated Net Profit/Loss based on the total points gained.
Streak Analysis: Shows both the Maximum and Average number of consecutive wins and losses, helping you understand the psychological difficulty of trading the strategy.
Data Integrity: It automatically detects "N/A" trades (candles that hit both SL and TP) and excludes them from the Win Rate calculation to ensure realistic statistics.
4. Modular "Recipe" Building
The strategy is highly customizable via the settings menu (no coding required). You can filter the Bollinger Band trigger with 10 different indicators:
Supported Filters: RSI, Stochastic, CCI, Williams %R, MFI, CMO, Fisher Transform, Ultimate Oscillator, and ROC.
Logic: All selected filters must agree with the main trigger for a trade to fire.
5. Visual Projection Engine
Glowing Outcomes: The script draws exact TP (Green) and SL (Red) boxes for past trades. These boxes glow to indicate the result, allowing for rapid visual verification of the strategy's performance.
Force Close Markers: Special gray markers appear on the chart where a trade was forced to close due to the "No Trade Zone" time limit.

Valuation Multi-Asset [MTF]Description This indicator is a specialized Intermarket Analysis tool designed to determine the relative valuation of an asset by comparing its performance against key global benchmarks (Currency, Commodities, Bonds, and Sector ETFs).
Unlike standard oscillators (like RSI) that only look at the asset's own price, this script calculates a Relative Value Index.
Underlying Concepts & Methodology The script operates on the principle of asset correlation and mean reversion ratios. The calculation logic follows these steps:
Ratio Calculation: It computes the price ratio between the Chart Asset and a Benchmark Asset (e.g., Symbol / DXY).
Smoothing: It applies a double smoothing method using Exponential Moving Averages (EMAs) to filter out short-term noise from the ratio.
Historical Normalization: Based on valuation theories (inspired by concepts like Larry Williams' valuation window), the script normalizes the smoothed ratio over a user-defined lookback period (default is 3 years/156 weeks). This ranks the current relative value between 0 and 100.
Key Features
Multi-Benchmark Comparison: Automatically compares the asset against the Dollar Index (DXY), Gold (GC1!), Bonds (ZB1!), and Sector ETFs.
MTF Dashboard: Includes a Multi-Timeframe table to see valuation status across Daily, Weekly, and Monthly views simultaneously.
ETF Reference: A built-in reference table to help you quickly find the correct Sector ETF for stock correlation.
How to Use
Undervalued Zone (< 15): When the line turns Green (or enters the bottom zone), the asset is historically cheap relative to the benchmark. This often indicates a potential accumulation or reversal point.
Overvalued Zone (> 85): When the line turns Red (or enters the top zone), the asset is historically expensive relative to the benchmark, suggesting potential distribution.
Divergences: Watch for divergences between the asset price and the Valuation Index (e.g., Price makes a new high, but the Valuation Index against Gold makes a lower high).
Settings
You can toggle individual benchmark lines (Asset 1 to 4).
Adjust the "Lookback Period" to change the historical normalization window.
Customize the Overbought/Oversold thresholds.

👑KINGㅤKULDEEPKING KULDEEP PRO – The Ultimate All-in-One Trend Dashboard 👑
One indicator that rules them ALL.
This is not just a script — this is your complete trading command center.
Live on-chart dashboard combines 14+ powerful indicators and instantly tells you:
- Exact trend direction of every major signal
- When each indicator flipped (with 12-hour time stamp)
- Current market strength percentage (0-100%)
- India VIX fear level in real-time
What’s Inside:
• EMA 13, 21, 34, 200 (with auto color + touch detection)
• VWAP (daily reset, trend tracking)
• SuperTrend (ATR-based)
• Williams Alligator (full jaw/teeth/lips logic)
• MACD (classic crossover)
• Bollinger Bands (breakout detection)
• RSI (14) with overbought/oversold + neutral zone (45-55 bar coloring)
• Momentum, ADX + DI, ATR Volatility
• India VIX live reading (color-coded fear gauge)
Unique Features:
- Trend Strength Meter (0-100%) – combines ALL signals into one final verdict:
→ Strong Bullish | Bullish | Neutral | Bearish | Strong Bearish
- Every trend change timestamped (12-hour AM/PM format)
- Clean, beautiful on-chart table (4 positions, 5 text sizes)
- EMA 13 & 200 plotted directly on price chart (toggle on/off)
- RSI neutral zone (45-55) turns bars gray instantly
- Optional smoothing MA on RSI
Perfect for:
- Intraday & swing traders
- Nifty/BankNifty warriors
- Anyone who wants to see the entire market picture in ONE glance
No more switching tabs. No more confusion.
Just pure, clean, professional edge.
Coded with precision | Runs buttery smooth | Made for winners
Long live the King 👑
~ KULDEEP157

👑ᴀʟʟ ɪɴ 1 ᴀɴᴀʟʏꜱɪꜱ👑 All in 1 Analysis
The ultimate all-in-one oscillator – switch between 15 powerful indicators with just one dropdown. No more cluttered charts!
Instantly analyze any asset using your favorite tool:
• Volume (with bullish/bearish breakdown + MA)
• MACD (line, signal, histogram)
• RSI (with MA, Bollinger Bands, color zones)
• ATR (with moving average)
• Bull Bear Power
• MFI (Money Flow Index)
• Momentum
• Chop Zone (trend strength & direction)
• Williams %R
• Accumulation/Distribution
• Average Day Range (ADR)
• BBTrend
• BB %b (Bollinger Bands %b)
• RSI Candlestick Oscillator (with regular & hidden divergence lines on chart!)
• ADX and DI (trend strength + direction)
Key Features:
- One-click switch between all 15 indicators
- Beautiful, easy-to-read analysis table (appears automatically)
→ Current value + clear status (Bullish, Bearish, Overbought, etc.)
→ Fully customizable position (6 options) and size (Tiny to Large)
- All plots, colors, levels, and MAs are fully customizable
- Super clean and lightweight – runs fast on any timeframe
- RSI Candlestick mode draws divergence lines directly on your price chart!
Perfect for:
- Day traders who need quick insights
- Swing traders switching between tools
- Anyone tired of adding 10+ indicators manually
- Learning how different oscillators behave on the same chart
Why use 15 separate indicators when you can have them all in one?
One indicator. Endless analysis. Zero clutter.
Made with ❤️ by KULDEEP157 | Pine Script™ v6 | Updated & Optimized

MTF Dashboard Table - Sachin ThakareOne Dashboard, Complete Market View!
By - Sachin Thakare (India, Mumbai)
MTF HUD Indicator - All-in-One Market Dashboard
📊 Basic Information
Indicator Name: MTF HUD Table - Bias Column
Created By: Sachin Thakare
Version: Pine Script v5
Type: Multi-Timeframe Heads-Up Display (HUD)
Category: Strategy/Utility Tool
🎯 What This Indicator Does
This is a comprehensive Multi-Timeframe Market Dashboard that displays key technical indicators across 8 different timeframes (3min to Monthly) in a single, easy-to-read table format. It helps traders quickly assess market bias and make informed decisions.
✨ Key Features
📈 Multi-Timeframe Analysis
8 Timeframes: 3m, 5m, 15m, 1H, 4H, Daily, Weekly, Monthly
Real-time Updates: All timeframes update simultaneously
Color-coded Signals: Instant visual feedback
🔢 Technical Indicators Included
Price Change & % Change - Immediate price movement
VWAP - Volume Weighted Average Price
EMA 9/21 - Exponential Moving Average crossover
200 MA - Long-term trend indicator
SuperTrend 10/3 - Trend-following indicator
RSI 9 - Momentum oscillator
MACD 8/21/5 - Moving Average Convergence Divergence
ADX 7/7 - Average Directional Index
Alligator - Bill Williams' trend indicator
Stochastic 5/3/3 - Overbought/Oversold levels
ATR 10 - Average True Range (volatility)
PH/PL - Previous Day High/Low position
🎨 Visual Design
Color Psychology:
🟢 Green: Strong Bullish
🟩 Light Green: Bullish
🔴 Red: Strong Bearish
🟥 Light Red: Bearish
⚪ Gray: Neutral
Customizable Position: Top/Bottom, Left/Right, Center
Clean Table Format: Professional HUD-style display
⚙️ Smart Features
Bias Column: Automatic market bias calculation
Score-based System: 11 indicators contribute to bias score
Customizable Thresholds: Adjust bull/bear levels
Multi-timeframe Security: Accurate timeframe calculations
🚀 How to Use
For Beginners:
Install the indicator on any chart
Look at the BIAS column for overall market direction
Check consistency across timeframes
Stronger signals when multiple timeframes agree
For Advanced Traders:
Identify confluence - When multiple indicators align
Timeframe alignment - Look for agreements across timeframes
Divergence spotting - When timeframes show conflicting signals
Entry/Exit points - Use with price action confirmation
Trading Strategies:
Trend Following: Follow the dominant bias across higher timeframes
Mean Reversion: Look for extreme readings in oscillator columns
Breakout Trading: Use PH/PL and ATR columns
Swing Trading: Focus on 4H and Daily timeframes
⚙️ Customization Settings
Position Settings:
Choose from 5 display positions
Adjust to your preferred chart layout
Indicator Parameters:
Adjust all indicator lengths and periods
Modify OB/OS levels for RSI and Stochastic
Change MA types (SMA/EMA) for 200 MA
Bias Thresholds:
Strong Bull Threshold: 8 (default)
Bull Threshold: 3 (default)
Bear Threshold: -3 (default)
Strong Bear Threshold: -8 (default)
💡 Pro Tips
Start with Higher Timeframes - Daily and Weekly first
Look for Alignment - Best trades when 3+ timeframes agree
Watch the BIAS Column - Quick market sentiment check
Combine with Price Action - Use support/resistance with signals
Risk Management - Never trade on indicator alone
⚠️ Important Notes
Not a Standalone System: Use with other analysis methods
Lagging Indicators: Most components are trend-following
Market Conditions: Works best in trending markets
Customize for Your Style: Adjust parameters for your trading style
🔄 Updates & Support
The indicator is regularly updated based on user feedback and market changes. For suggestions or issues, please leave a comment on the TradingView script page.
Perfect For: Day Traders, Swing Traders, Position Traders, Market Analysts, and anyone needing quick multi-timeframe analysis.
Best Results: When combined with fundamental analysis, risk management, and proper trading psychology.

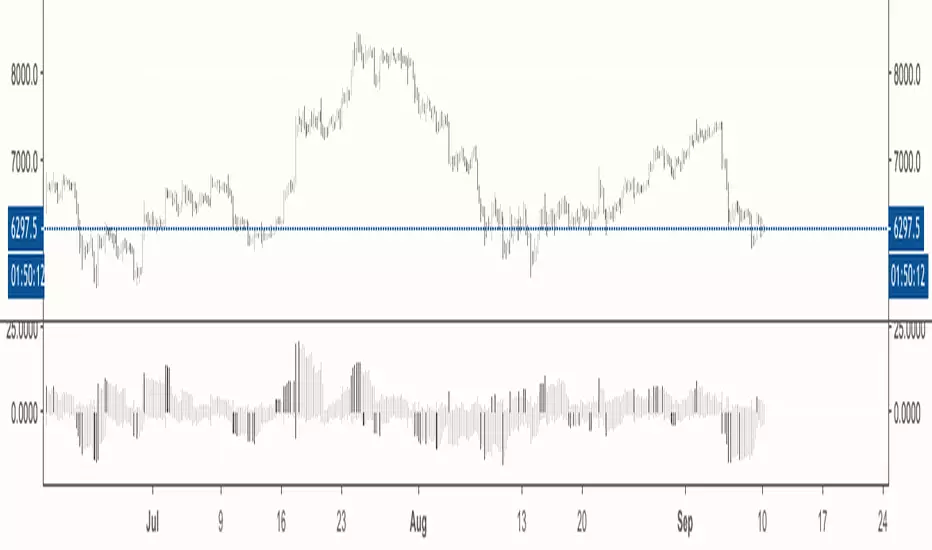
Liquides & Value CryptaThe indicator shows the ratio of the analyzed market to stablecoins based on the Larry Williams Price Index.
This allows one to determine the dynamics of liquidity movement toward the market; for example, if the price rises and the indicator falls, it means that most market participants are using this rise to exit positions.
The opposite is also true: if the price falls and the indicator rises, it means that most market participants are using the price decline to buy, i.e., money is flowing into the market.
The analysis is based on divergence.
The indicator works well in conjunction with the Cumulative Index OS momentum indicator and the volume-adjusted Cumulative Delta Index OS momentum indicator. Two out of three divergences are sufficient to confirm a trend-following position entry.

CISD & Projections BossThis is a CISD (Change in State of Delivery) indicator with Fibonacci-style projections. Here's what it does:
Core Functionality
1. Pivot Detection
Uses Williams Fractal logic to identify swing highs and lows based on your specified pivot strength
Can use either candle bodies or wicks for calculations
2. CISD Detection
The indicator identifies "Change in State of Delivery" moments - institutional trading concept where:
For bullish CISD (CISD+): Finds a swing low, then looks backward to identify the preceding series of bearish candles. When price breaks above this bearish series, it marks a CISD+ (change from bearish to bullish delivery)
For bearish CISD (CISD-): Finds a swing high, then looks backward to identify the preceding series of bullish candles. When price breaks below this bullish series, it marks a CISD- (change from bullish to bearish delivery)
The CISD line is drawn from the start of the series to the breakout point at the series extreme (high for bullish, low for bearish).
3. Range Projections
Once a CISD is confirmed, the indicator:
Calculates the range of the broken series (high - low)
Projects multiples of that range as potential targets
Default levels are 1x, 1.5x, 2x, 2.5x, 3x, and 4x the series range
Bullish projections extend upward from the CISD+ line
Bearish projections extend downward from the CISD- line
Visual Elements
CISD lines (thick lines in blue for bullish, red for bearish)
Projection levels (thinner horizontal lines extending from the breakout point)
Labels showing the multiplier for each projection level
Optional pivot shapes to mark swing points
This is essentially tracking institutional "order flow changes" and projecting measured moves based on the size of the broken delivery pattern - very much in line with ICT (Inner Circle Trader) concepts.
