Wyckoff Wave Chart
What Is Wyckoff Wave Chart and How Does It Work?
It is the cumulative sum of exchanged (sold/bought) shares or contracts on a given wave (downward or upward) in a given time plotted on the chart.
Wyckoff Wave Chart for TradingView
Wyckoff Wave Chart is the best tool to identify turning points in all markets. Money plays in the market, not set ups. Therefore, in order to earn money, you must play in the same direction as the professionals! It is thanks to the observation of the volume that you can know which side the professionals (Smart Money) are on and trade in accordance with their direction. You can also "look" inside the chart and see on the numbers or graphical histogram who controls the market at a given moment - Buyer or the Seller.
Let's Start From The Beginning!
Wyckoff Wave Chart created by Richard Wyckoff in early 1930' were a breakthrough in technical analysis. In his famous technical analysis course, he told his students to "think like waves". Volume analysis was an integral part of his way of investing. During the period when Wyckoff was active in the financial markets wave volume was calculated manually, we now have a fully automated version for TradingView. Using Wyckoff Cumulative Volume you will be surprised how well it identifies turning points in all markets and on any time frame. This tool is very helpful in predicting trend changes in all markets like forex, crypto, futures and stocks.
In order for the indicator to work well on all charts, it is necessary to set the appropriate step in its settings.
"Step" is the wave setting to be taken into account when counting the volume on a given swing. The standard setting for each round is 30. This is the measure of pips on which the next upward or downward wave is to be counted. However, for individual assets, these settings can be adjusted individually.
Another important setting is the "Volume Divider" - the cumulative volume numbers on a given swing displayed on the chart will be different for different assets. In the case of penny stocks, it can be even millions of listed assets. In order for the chart not to display too long numbers, you can divide it by 1000 / 10000 / 100000. In the case of small intervals such as 1 or 5 minute charts, "O" may appear at the ends of swings. You should then reduce the "Volume Divider" to 1 or 10.
Accumulation example:
Buscar en scripts para "wave"

Harmonic Sine Waves model plot Hey,
Here is another tool that I created. I could not find anything similar.
This script is creating a sine wave, based on the given length, amplitude, horizontal vertical offset.
After this it plots also nearest harmonics to the base sine wave and draws it on the chart.
At the last step it sums up the value for base sine wave with its harmonics.
This is a great way to experience how 4 basic sine waves, when summed up, are creating more complex chart.
This shows that the 'chaotic' chart can be built on just a few most important factors.
You do not have to "know every single fact" about the asset to make a proper forecast.
You just need those most important.
It is crucial though, to offset the chart in a correct way, so it is in phase with the asset that we work on.

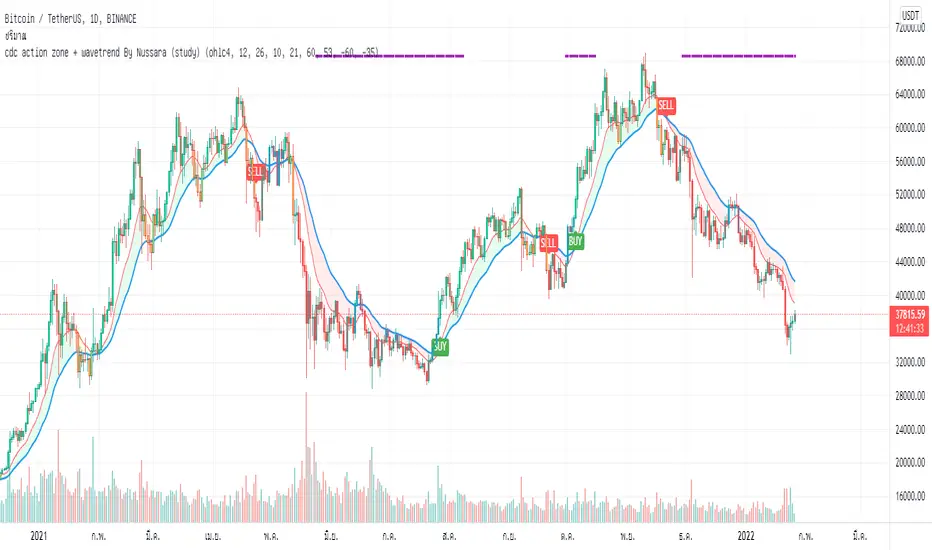
cdc action zone + wavetrend By Nussara (study)I previously shared strategy CDC action zone + WaveTrend By Nussara.
But some people say that the alarm is not connected to the robot trade (not 3commas robot trade) .
But for me, I used the strategy CDC action zone + WaveTrend By Nussara connect to 3commas robot trade with no problem at all.
However, I made a study script for those who want to connect to robot trade.
This version combines a famous indicator CDC Action zone V.2 and WaveTrend together.
When the WaveTrend cross below -35, it is an indication of oversold. The indicator will show a purple line on top until the WaveTrend is greater than 53.
Buy condition.
1. Purple line appears on the top indicator.
2. CDC Action zone - fast EMA crossover slow EMA .
Sell condition
1. CDC Action zone - fast EMA crossunder slow EMA .
This indicator is Suitable for a 1DAY time frame or more.
Moving Average with Dynamic Color Gradient (WaveTrend Momentum)Similar scripts exist but I haven't seen one using WaveTrend and I haven't seen one that hand picks evenly divided colors between GREEN-YELLOW-RED.
The green is exact green, the yellow is exact yellow, and the red is exact red.
Not complicated, just useful.

On-chart Wavetrend Divergence with PivotsThis is an OnChart WaveTrend Divergence Indicator with Pivots and Alerts
LazyBears WaveTrend Indicator or also known as "Market Cipher" is an Indicator that is based on Moving Averages, therefore its an "lagging indicator". Lagging indicators are best used in combination with leading indicators. In this script the "leading indicator" component are Daily, Weekly or Monthly Pivots. These Pivots can be used as dynamic Support and Resistance, Stoploss, Take Profit etc.
This indicator combination is best used in larger timeframes. For lower timeframes you might need to change settings to your liking.
What are those circles?
-These are the WaveTrend Divergences. Red for Regular-Bearish. Orange for Hidden-Bearish. Green for Regular-Bullish. Aqua for Hidden-Bullish.
Please keep in mind that this indicator is a tool and not a strategy, do not blindly trade signals, do your own research first! Use this indicator in conjunction with other indicators to get multiple confirmations.

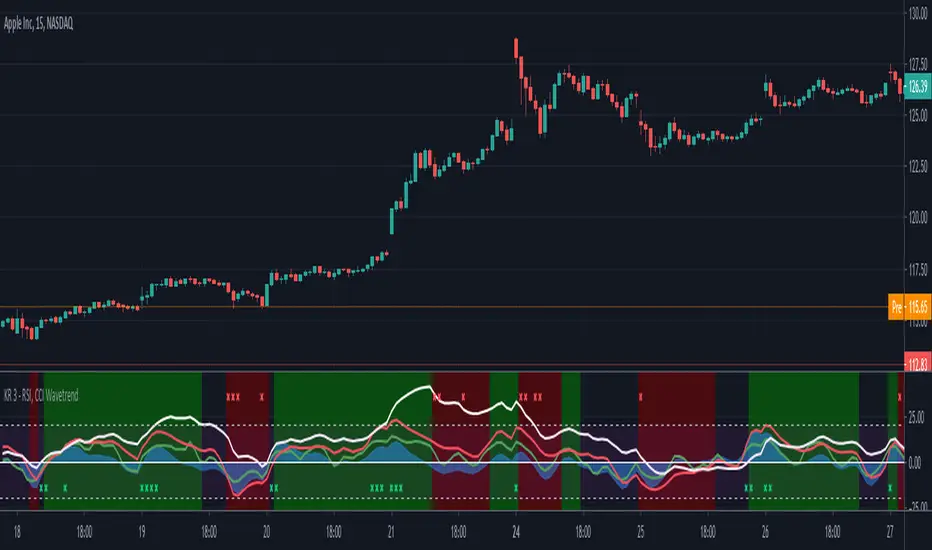
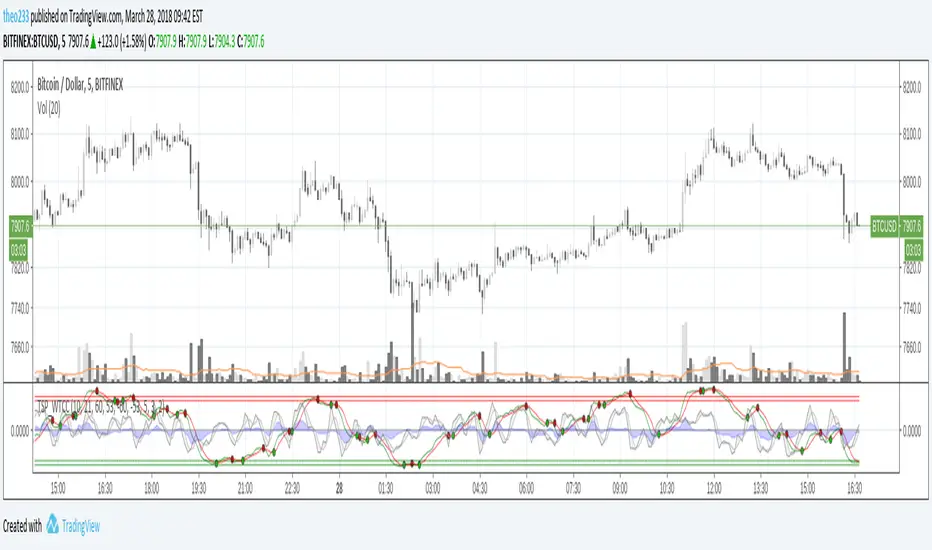
RSI, CCI WaveTrend God by Keiron RichieThis script uses Relative Strength Index ( RSI ), Commodity Channel Index ( CCI ) and WaveTrend (WT) together as an oscillator with an additional custom RSI rate of change indicator and buy/sell background color zones derived from a complex combination of these indicators.
The White line shows the moving average of RSI as an oscillator
The Green line is the fast Exponential Moving Average ( EMA ) of CCI & the Red line is the slow EMA of CCI .
The Blue area is the EMA of WaveTrend WT
How to read:
If the RSI , CCI or WT crosses above a programmed threshold and the other lines are also within a pre-defined buy range then the background will change to green for buy.
If the RSI , CCI or WT crosses below a programmed threshold and the other lines are also within a pre-defined sell range then the background will change to red for sell.
Where requirements are not met, the background is neither green nor red.
There are also red and green indicator x’s at the top/bottom of the indicator. They show a drastic change in Relative strength within a short period. This often indicates an immediate buy or sell opportunity.
Buy, Sell, Exit Buy and Exit Sell alerts are included.
Use the link below to obtain access to this indicator.
cloe V X.0 triple wave trend with trend This script is based on the lazybears wavetrend script
with a extra useful ema
the third ema is based on the last 200 periods and show how the trend is going in the time
- When the original wave cross the third ema it's means that we can continue long or short
- When the third ema stretchs below or up the 0 line it means that the current pair is oversell or overbought but in a large period of time so we can decide if we continue long or short

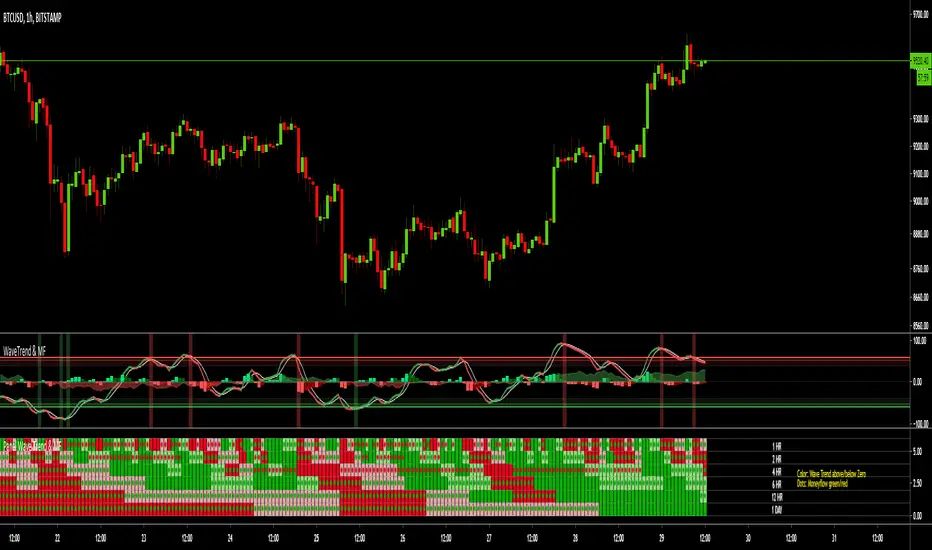
MTF Wave Trend & Money Flow - Monitoring PanelAnother indicator based on the famous "Wave Trend Oscillator" by LazyBear.
Monitoring panel showing the Wave Trend as color for 6 different timeframes. Additionaly the Money Flow (positive or negative) is indicated as green or red dots.
I find it helpful that with one glance the current Wave Trend and Money Flow on many timeframes is visible.
(Timeframes can be changed, but the description labels are currently hardcoded - if you want to change it, just copy the script and change them)
Meanings of the Colors:
WT above Zero and rising : Dark Green
WT above Zero and declining : Light Green
WT below Zero and declining : Dark Red
WT below Zero and rising : Light Red
Money flow positive : Green dot
Monet flow negative : Red dot
(Currently there are two additional timeframes commented in the code - if you want to use them, just copy the script and uncomment them)
Have fun and as always I am open for constructive feedback.
Cheers!
Swing Trade Pros - Wave Trend IndicatorThe STP Wave Trend Indicator allows you to catch big trends before they start by confirming the direction and momentum in real-time. This indicator can be used across all assets on any timeframe. When the oscillator (white area) crosses down the signal (green area), it is a good SELL signal. Similarly, when the oscillator crosses above the signal it is a good BUY signal. Another strategy is to buy when the oscillator crosses the oversold area and sell when it crosses the overbought area
WaveTrend Oscillator 1.0.149 [NinjaDawgz]WaveTrend in it native oscillator form. Added various plots to help interpret the data better.
To be used in conjuction with additional analysis, like wave theory. helps find, confirm and trade price cycles on any timeframe and any security.
can be used for momentum trading, or picking tops and bottoms.

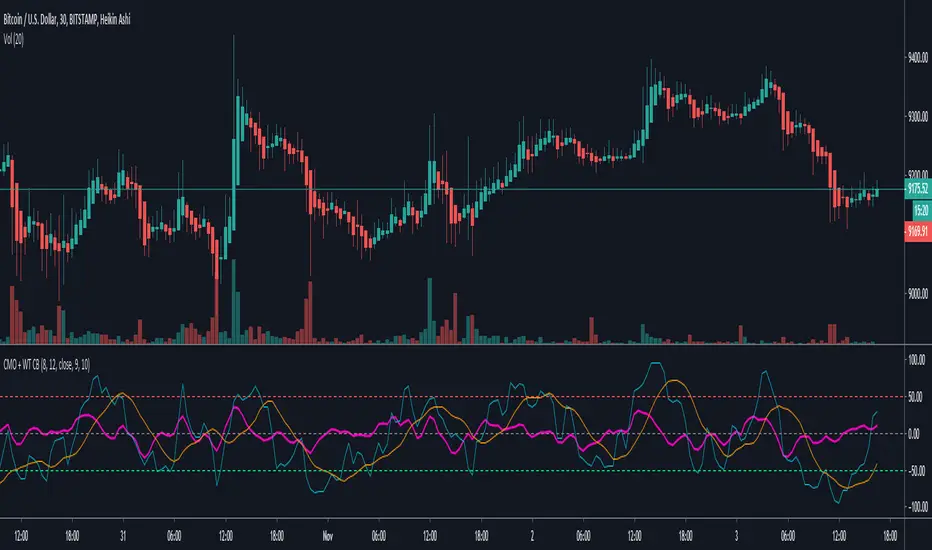
Chande Momentum Oscillator + WaveTrend Oscillator [ChuckBanger]This is a combination of Lazybears WaveTrend Oscillator (purple line) and Chande Momentum Oscillator (blue line with the orange line as a signal line). Use WaveTrend as a confirmation tool. It is consider as a selling point when CMO is over the red horizontal dotted line. The opposite applies if CMO line is under the red horizontal dotted line.
You can also use this with WaveTrand to confirm the sell or buy point. When WT line is over center line and CMO has crossed over it's signal line. It is a buy point. The opposite applies if WT line is under the center line and CMO is under its signal line.
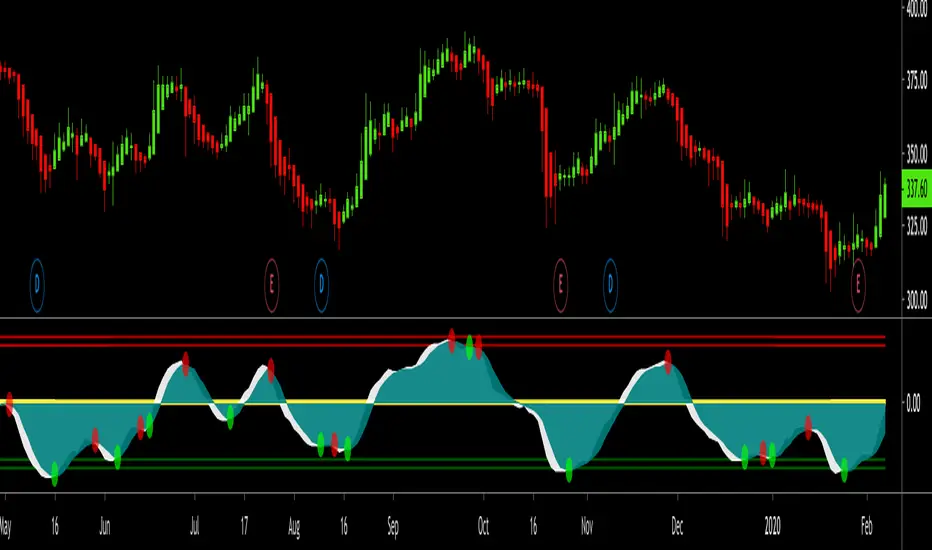
⚛WPZO - Wave Period Zone Oscillator by Cryptorhythms⚛WPZO - Wave Period Zone Oscillator by Cryptorhythms
Intro
Based upon Akram El Sherbini's article "Time Cycle Oscillators" published in IFTA journal 2018.
Companion indicator to the Wave Period Oscillator, this is simply a transformation to display in a familiar manner like an RSI. Occasionally WPO can exceed the upper and lower boundary lines in strong moves. With WPZO, it will never go below -80 or above +80.
Description
In the Authors words....
"The wave period zone oscillator (WPZO) is a bounded oscillator for the wave period oscillator (WPO) and calculates the period of the market’s cycle. In other words, the wave period refers to the time taken by buyers or sellers to complete one cycle. The oscillator moves within a range of -100 to 100 percent.
The WPZO has overbought and oversold levels at +40 and -40 respectively. At extreme periods, the oscillator may reach the levels of +60 and -60. The zero level demonstrates an equilibrium between the periods of bulls and bears. The WPZO oscillates between +40 and -40. The crossover at those levels creates buy and sell signals. In an uptrend, the WPZO fluctuates between 0 and +40 where the bulls are controlling the market.
On the contrary, the WPZO fluctuates between 0 and -40 during downtrends where the bears control the market. Reaching the extreme level of -60 in an uptrend is a sign of weakness. Mostly, the oscillator will retrace from its centerline rather than the upper boundary of +40. On the other hand, reaching +60 in a downtrend is a sign of strength, and the oscillator will not be able to reach its lower boundary of -40.
During an ideal uptrend, the WPZO does not reach the lower boundary of -40 and usually rebounds from a higher level than -40. This means that the bulls have taken control earlier. Hence, a zeroline crossover generates a buy signal. The WPZO crosses the upper boundary at +40, then pulls back again below +40 to generate a sell signal. During sideways, the WPZO fluctuates between the lower and upper boundaries of -40 and +40. This tactic is also used in an uptrend where corrections are strong enough to drive the WPZO line below the lower boundary. During downtrends, the WPZO fails to reach the upper boundary and oscillates between the 0 and -40 levels.
The bears enter early, indicating an obvious weakness in the market. Therefore, crossing the zero level generates a sell signal. The exit at weakness tactic is used during uptrend reversals and downtrends. The WPZO oscillates between the centerline and the lower boundary of -40. The bears are controlling the market and move in wide cycle periods, while the bull’s strength is almost absent. An exit signal is triggered once the WPZO crosses -40. When prices decline, the WPZO may cross its extreme lower boundary at -60. Therefore, a swift exit signal is triggered once the WPZO crosses -40.
The WPZO gives an insight about the relation between time and price movements. In this article, we used the oscillator to differentiate between the time taken by bulls and bears to complete one cycle. Due to the boundaries effect, the WPZO may diverge less than the WPO with prices."
TL:DR
More strategy discussed above, but heres the short version:
Bullish signals are generated when WPZO crosses over 0
Bearish signals are generated when WPZO crosses under 0
OverBought level is 40
OverSold level is -40
ExtremeOB level is 60
ExtremeOS level is -60
👍 Enjoying this indicator or find it useful? Please give me a like and follow! I post crypto analysis, price action strategies and free indicators regularly.
💬 Questions? Comments? Want to get access to an entire suite of proven trading indicators? Come visit us on telegram and chat, or just soak up some knowledge. We make timely posts about the market, news, and strategy everyday. Our community isn't open only to subscribers - everyone is welcome to join.
For Trialers & Chat: t.me

Waddah Attar Explosion and WaveTrend Oscillator combinedWaddah Attar Explosion by LazyBear and WaveTrend Oscillator by Krypt.
All credits goes to LazyBear and Krypt, i have only done some combining with the two indicators, barcolors and BG colors to clarify entrys and exits.
Combine with CM_Williams Vix_Fix, Super Guppy R1.0 by JustUncleL and you have a powerful tool.
Barcolors to look for
Aggressive Buy 1 = Lime
Agressive Buy 2 = Aqua
Buy = Green
Sell 1 = Orange
Sell 2 = Red
This is my first try, so be nice to me :-)

TB! Fibonacci Elliot Wave OscillatorOnly one way to do it the right way!
With forwarded wave propagation.

RSI Bollinger WaveTrend Cycle Multi Free TSPMulti indicator
Bollinger Band x RSI
Wave Trend
Cycles
Free users will like it :)
Fell free to like share comments... and check my other stuff :]

Elliott Wave Oscillator With BandsElliott Wave Oscillator With Breakout Bands. To determine and validate elliott wave counts.

PPSignal Elliot Wave OscillatorA good oscillator for helping you count Elliot waves.
Different bar colors for noticing trend change

Vdubus Divergence Wave Pattern Generator V1The Vdubus Divergence Wave Theory
10 years in the making & now finally thanks to AI I have attempted to put my Trading strategy & logic into a visual representation of how I analyse and project market using Core price action & MacD. Enjoy :)
A Proprietary Structural & Momentum Confluence SystemPart 1: The Strategic Concept1. The Core Philosophy: "Geometry + Physics"Traditional technical analysis often fails because traders confuse location with timing.Geometry (Price Patterns): Tells us WHERE the market is likely to reverse (e.g., at a resistance level or harmonic D-point).Physics (Momentum): Tells us WHEN the energy driving the trend has actually shifted. The Vdubus Theory posits that a trade should never be taken based on Geometry alone. A valid signal requires a specific, fractal decay in momentum—a "Handshake" between price structure and energy exhaustion.2. The 3-Wave Momentum Filter (The Engine)Most traders look for simple divergence (2 points). The Vdubus Theory demands a 3-Wave Structure to confirm the true state of the market.A. The Standard Reversal (Exhaustion)This is the "Safe" entry, catching the slow death of a trend.Wave 1 $\rightarrow$ 2 (The Warning): Price pushes higher, but momentum is lower (Standard Divergence). This signals that the trend is tapping the brakes.Wave 2 $\rightarrow$ 3 (The Confirmation): Price pushes to a final extreme (often a stop-hunt), but momentum is flat or lower than Wave 2 ("No Divergence").The Logic: This confirms that the buyers have expended all remaining energy. The engine is dead.
B. The Climax Reversal (The Trap)This is the "Aggressive" entry, catching V-shape reversals.Wave 1 $\rightarrow$ 2 (The Bait): Price pushes higher, and momentum is Stronger/Higher (No Divergence). This sucks in retail traders who believe the trend is accelerating.Wave 2 $\rightarrow$ 3 (The Snap): Price pushes again, but momentum suddenly collapses (Divergence).The Logic: A "Strong to Weak" shift. The market traps traders with a show of strength before hitting a "concrete wall" of limit orders.C. The Predator (The Trend Continuation)The Logic: Trends rarely move in straight lines. The "Predator" looks for Hidden Divergence during a pullback.The Signal: Price makes a Higher Low (Trend Structure Intact), but Momentum makes a Lower Low (Oversold Trap). This signals the end of the correction and the resumption of the main trend.3. The "Clean Path" PrincipleA trade is only valid if there is no opposing force. If you are looking to Sell (Bearish Reversal), the opposing Bullish momentum must be weak or neutral. If the "Enemy" is strong, the trade is skipped.
Part 2: The Indicator Breakdown
Tool Name: Vdubus Divergence Wave Pattern Generator V1
This script automates your analysis by combining ZigZag Pattern Recognition (Geometry) with your Custom MACD Logic (Physics).
1. The "Golden" Settings
The physics engine is tuned to your specific discovery:
Fast Length: 8
Slow Length: 21
Signal Length: 5
Lookback: 3 (Sensitive enough to catch the exact pivot points).
2. Signal Generation Logic
The indicator scans for four distinct setups. Here is the exact logic code translated into English:
Signal 1: Standard Reversal (Green/Red Pattern)
Geometry: The ZigZag algorithm identifies a 5-point structure (X-A-B-C-D), such as a Gartley, Bat, or Butterfly.
Physics Check:
Finds the last 3 momentum peaks matching the price highs.
Rule: Momentum Peak 2 must be < Peak 1 (Divergence).
Rule: Momentum Peak 3 must be <= Peak 2 (Confirmation/No Div).
Output: Draws the colored pattern and labels it (e.g., "Bearish Gartley (Exhaustion)").
Signal 2: Climax Reversal (Orange Pattern)
Geometry: Identifies the same 5-point structures.
Physics Check:
Rule: Momentum Peak 2 is >= Peak 1 (Strength/No Div).
Rule: Momentum Peak 3 is < Peak 2 (Sudden Failure/Div).
Output: Draws the pattern in Orange labeled "⚠️ CLIMAX REVERSAL". This is your "Trap" detector.
Signal 3: Rounded Top/Bottom (Navy/Maroon Label)
Geometry: Price is compressing or rounding over.
Physics Check:
Scans for 4 consecutive waves of momentum decay.
Rule: Peak 1 > Peak 2 > Peak 3 > Peak 4.
Output: Places a label indicating a "Multi-Wave Decay," identifying turns that don't have sharp pivots.
Signal 4: The Predator (Purple Pattern)
Geometry: Identifies a trend pullback (Higher Low for Buys).
Physics Check:
Rule: Momentum makes a Lower Low while Price makes a Higher Low (Hidden Divergence).
Output: Draws a Purple pattern labeled "🦖 PREDATOR" to signal trend continuation.
3. The Confluence Dashboard
Located in the corner of the screen, this provides a final "Safety Check."
Logic: It compares the absolute value (strength) of the most recent Bearish Momentum Peak vs. the most recent Bullish Momentum Low.
Output:
Green (Bulls Strong): Buying pressure is dominant. Safe to Buy, Dangerous to Sell.
Red (Bears Strong): Selling pressure is dominant. Safe to Sell, Dangerous to Buy.
Grey (Neutral): Forces are balanced.
Summary of Potential
This system solves the "Trader's Dilemma" of entering too early or too late. By waiting for the 3rd Wave, you effectively filter out the market noise and only commit capital when the opposing side has structurally and physically collapsed. It transforms trading from a guessing game into a disciplined execution of identifying Geometric Exhaustion.
Logic 1 / PREVIOUS DIVERGENCE PROJECTS future TREND BREAKS / Reversals *Not in script*
Logic 2 / Wave 1 to 2 = Divergence / Wave 2 to 3 = NO divergence = Signal
Reverse logic: Wave 1 to 2 = NO Divergence / Wave 2 to 3 = Divergence = Signal

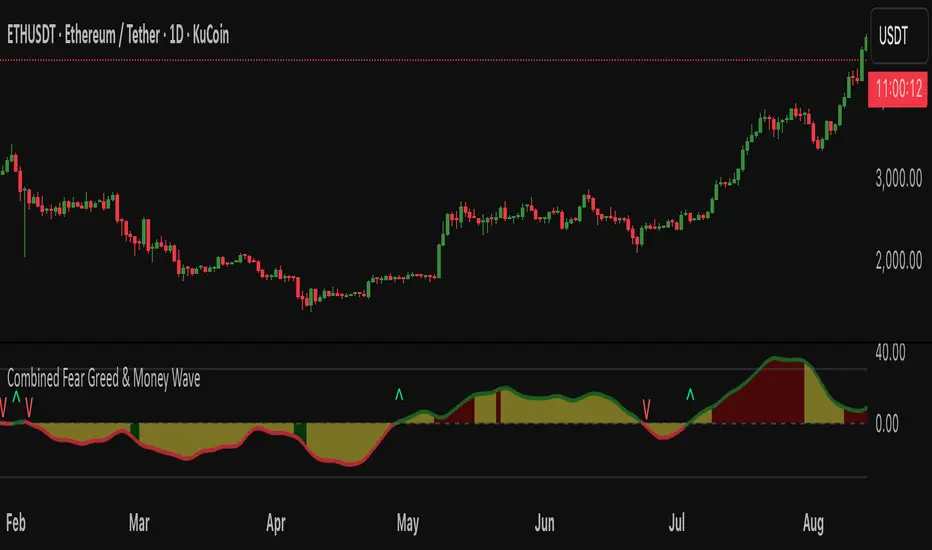
Fear Greed zones and Money Waves FusedThis indicator, named "Fear Greed zones and Money Waves" combines a smoothed Money Flow Index (MFI)-based wave and the Relative Strength Index (RSI) to visualize market sentiment through fear and greed zones and generate buy/sell signals.
Core Functions
- It calculates a zero-centered and smoothed version of the MFI (MoneyWave) using configurable smoothing methods (SMA, EMA, RMA) with parameters for length and smoothing intensity.
- It uses RSI to define fear and greed zones based on user-defined thresholds (e.g., RSI below 30 indicates fear, above 70 indicates greed).
- The MoneyWave area is color-coded based on these fear/greed RSI zones: dark green for fear, dark red for greed, and yellow neutral.
- The edge line of the MoneyWave shows bullish (lime) when above zero and bearish (red) when below zero.
Visual Elements
- Plots the MoneyWave as a colored area with an edge line.
- Displays horizontal lines representing the zero line and upper/lower bounds derived from MFI thresholds.
- Optionally shows direction change arrows when the MoneyWave sign changes and labels indicating BUY or SELL signals based on MoneyWave crossing zero combined with fear/greed conditions.
Trading Signals and Alerts
- Buy signal triggers when MoneyWave crosses upward through zero while in the fear zone (RSI low).
- Sell signal triggers when MoneyWave crosses downward through zero while in the greed zone (RSI high).
- Alerts can be generated for these buy/sell events.
In summary, this indicator provides a combined measure of money flow momentum (MoneyWave) with market sentiment zones (fear and greed from RSI), helping identify potential market entry and exit points with visual markers and alerts .
WaveTrend OscillatorWave trend Oscillator, similar to the other Cypher Oscillators, just that this oscillator is a little bit more refined less noise and a few better options for the money flow, but keeping the basic Structures and features. The only feature this does not have is the divergences

WaveTrend LazyBear + BUY/SELL Labels (Custom Color)WaveTrend LazyBear + BUY/SELL Labels (Custom Color)

Sequence Waves [OmegaTools]the sequence waves indicator, developed by omegatools, is a multi-functional tool designed to detect trends, sequences, and potential reversal signals based on price movements and volume. this indicator has two main modes, "trend" and "sequence," which determine how the indicator calculates directional changes. additional enhancements in this version include reversal signals, allowing users to identify potential long and short opportunities with specific entry cues.
input parameters
mode (mode): chooses the calculation basis for directional movement.
- "trend": uses a midline calculated from the highest high and lowest low over the "trend mode length" period to assess if the price is in an upward or downward trend.
- "sequence": compares the current price to the closing price of the previous "sequence mode length" period to detect shifts in direction.
counter mode (modec): sets whether the counter increments by a fixed amount (1 or -1) or the volume of the bar, impacting the indicator’s sensitivity.
- "fixed": increments or decrements the counter by 1.
- "volume": increments or decrements based on the period’s volume, making the indicator more responsive to high-volume periods.
percentile length (lntp): defines the lookback period for calculating overbought and oversold thresholds using a percentile method. shorter lengths make ob/os levels more reactive.
sensitivity (sens): controls the percentile-based ob/os thresholds, ranging from 10 to 100. higher values narrow ob/os zones, while lower values widen them, impacting signal frequency.
trend mode length (lnt1): sets the period length for midline calculation in trend mode, defaulting to 21. longer periods smooth the midline for detecting major trends.
sequence mode length (lnt2): sets the lookback period in sequence mode, with a default of 4. shorter lengths capture more frequent directional changes, while longer lengths smooth signals.
visual colors:
- up color (upc): sets the color for upward movements.
- down color (dnc): sets the color for downward movements.
calculation logic
midline calculation: in trend mode, a midline is derived from the average of the highest high and lowest low over the "trend mode length" period, acting as a reference to detect upward or downward movements.
counter calculation:
- in trend mode, if the close price is above the midline, the counter increases (or volume if volume mode is selected). it decreases when the price is below.
- in sequence mode, the counter increases if the close is above the closing price from "sequence mode length" periods ago and decreases if below.
the counter resets to zero on direction changes, creating clear directional transitions.
overbought/oversold percentiles: separate arrays track the counter’s values each time the direction changes, creating historical up and down values. ob and os thresholds are dynamically determined based on these arrays, with sizes limited by the percentile length and sensitivity inputs.
reversal signals: two new variables, "long" and "short," detect potential reversal points when the counter crosses specific thresholds:
- long: a long signal is generated when the counter switches to positive and exceeds the down percentile.
- short: a short signal is triggered when the counter switches to negative and exceeds the up percentile.
visual and display elements
counter plot: plots the counter value on the chart with color-coded columns, making it easy to spot directional momentum.
up and down percentiles: displays overbought (up percentile) and oversold (down percentile) thresholds to identify potential reversal zones.
regime background: the background color changes based on market regime:
- bullish (up percentile > down percentile): greenish background.
- bearish (down percentile > up percentile): reddish background.
- neutral (both percentiles equal): grayish background.
reversal signals: plotted as small triangles on the chart for visual confirmation of potential long (triangle up) and short (triangle down) reversal signals.
obs background: changes color when the counter exceeds ob or os thresholds, creating a visual cue for extreme market conditions:
- overbought: background changes to a faint down color.
- oversold: background changes to a faint up color.
status table: displayed on the right side of the chart, providing real-time status information:
- status: shows "overbought," "oversold," "long," "short," or "none" based on the current counter position.
- regime: indicates whether the market is in a "bullish," "bearish," or "neutral" state based on the percentile comparison.
- percentile up/down: displays the current up and down percentiles for quick reference.
how to use the indicator
trend following: in trend mode, use the midline-based counter to gauge if the market is in an uptrend (positive counter) or downtrend (negative counter).
reversal detection: the ob/os thresholds assist in identifying potential reversal points. when the counter exceeds the up percentile, it may indicate an overbought state, suggesting a bearish reversal. similarly, dropping below the down percentile may indicate an oversold state, suggesting a bullish reversal.
entry signals: use the long and short reversal signals for potential entry points, particularly in trending or range-bound markets. these signals are indicated by up and down triangles.
sequence trading: in sequence mode, the indicator tracks shorter-term directional shifts, making it suitable for detecting smaller momentum patterns based on recent price comparisons.
volume sensitivity: selecting volume mode enhances sensitivity to high-volume moves, allowing it to detect stronger market activity in both trend and sequence modes.
the sequence waves indicator is suited to both short-term and long-term traders. it allows for detailed trend analysis, reversal detection, and dynamic ob/os signals. the inclusion of visual reversal cues makes it a flexible tool adaptable to a variety of trading strategies.
