[TTI] Pinch AVWAPs––––History & Credit
This indicator came from studying Alpha trends and the concept from CMT Brian Shannon
–––––What it does
Upon uploading choose two dates from which the script will calculate Anchored VWAP from both dates. The dates can be easily moved for faster adjustment and re-calculation.
–––––How to use it
If you are trading a breakout methodology like myself, look for the "pinch" of the AVWAPs. Preferably, a bottom AVWAP moving up and a top AVWAP moving down. Choose important dates (this is rather subjective) for the AVWAP dates. These can be important events like Earnings or Divident Announcements. Or places where there is a change of structure of the Supply and Demand dynamic.
Buscar en scripts para "vwap"

Anchored VWAP with Custom Volume IndexNot a regular AVWAP - this one allows you to use up to 39 sources added together as your volume source
This enables you to use many different pairs from many different exchanges when dealing with crypto
OR you can enhance your intermarket analysis charting abilities enabling you to place the AVWAP on multiple symbols on one chart
Hope you enjoy!
NOTE:
All the symbols must have a history that goes back as far as the chosen date!
When placing at a date in the past, ensure all the sources of volume have history going back as far as you have chosen OR the AVWAP will not appear

Anchored VWAP ClickIt calculates AVWAP set from a mouse click on a chart instead of having to edit a popup box, manually transferring date and time from the chart.
It's the Oct 2021 sample script from Tradingview to demonstrate their new chart interactive capabilities of Pine script.
www.tradingview.com
I take no credit for this, just noticed it wasn't in the Public Library.
This ability to accept OnMouse positional data from the chart, into an indicator has been needed in TV for a long time.
Glad to see they continue to grow the capabilities.

Auto Anchored Volume Weighted Average Price - Custom AVWAP
Based on Brian Shannon's AVWAP - This indicator anchors vwap to the highest high, lowest low and highest volume bar of a user defined lookback period.
In the chart example above on AVAX, the lookback period is set to 90 days
- The blue line depicts AVWAP from the highest bar in in the last 90 dats
- The purple Line is AVWAP from the lowest bar in the last 90 days
- The golden line is AVWAP from the highest volume bar in the last 90 Days
These levels act as a price magnet and strong levels of support and resistance. I use them to identify chart locations for where I want to do business and look for trade setups.
Unlike moving averages, AVWAP will maintain it's chart position no matter the chart resolution. One way to take advantage of this is to wait for price to get to one of these levels, go to lower timeframes and find low risk setups based on your trading strategy.
You can customise the look and feel and which anchors you want displayed. You can use multiple instances with varying lookback periods to display shorter and longer term levels simultaneously

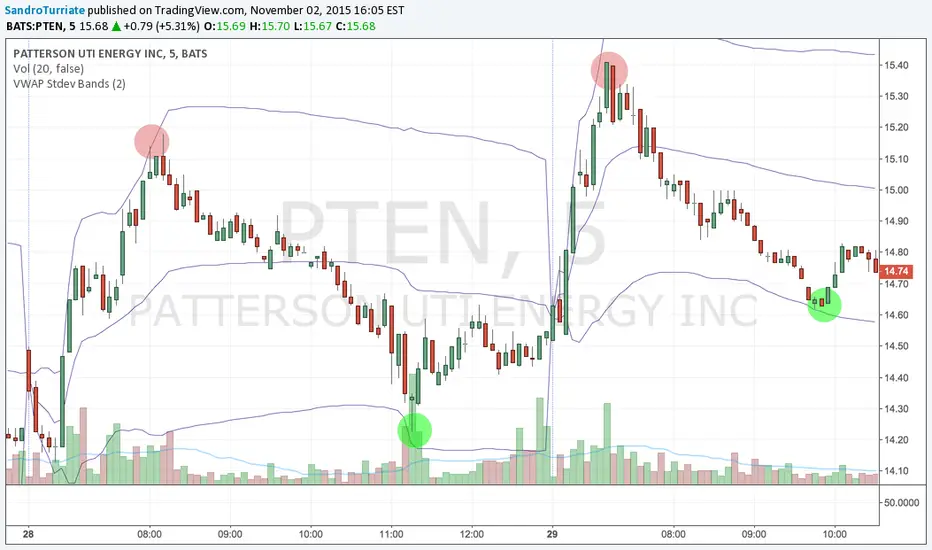
VWAP St. Dev BandsThis indicator allows you to add up to 3 volatility bands to VWAP based on its Standard Deviation.
Best use is for intraday but you can choose higher timeframes too.
For day trading a band of 3 standard deviations usually works well as an overbought/oversold region, allowing for mean reversion trading, but you are free to come up with your own strategies.
Enjoy!

asw Intraday SetBest for intraday trading!
Key levels to watch during intraday include Open price, high & low of the the and of yesterday's.
These lines are plotted on the chart with VWAP in addition.
Hope it helps!

Intraday VWAP weighted averaged KAMA BandsFor Intraday trading!
This indicator helps in figuring out the directivity as well as optimum entry criteria in an Intraday Trade
Most of the times in market,
it makes a good sense for any trader to have a particular bias, the indicator helps provide biases with the potential target bands
Explore it and come up with your own explanation! The indicator is self intuitive
Buy when Blue price tracker line appears
Sell when Orange price tracker line appears
Target the just next band line! or Pivot
Which timeframes it works best ?
It is designed for 1 minute


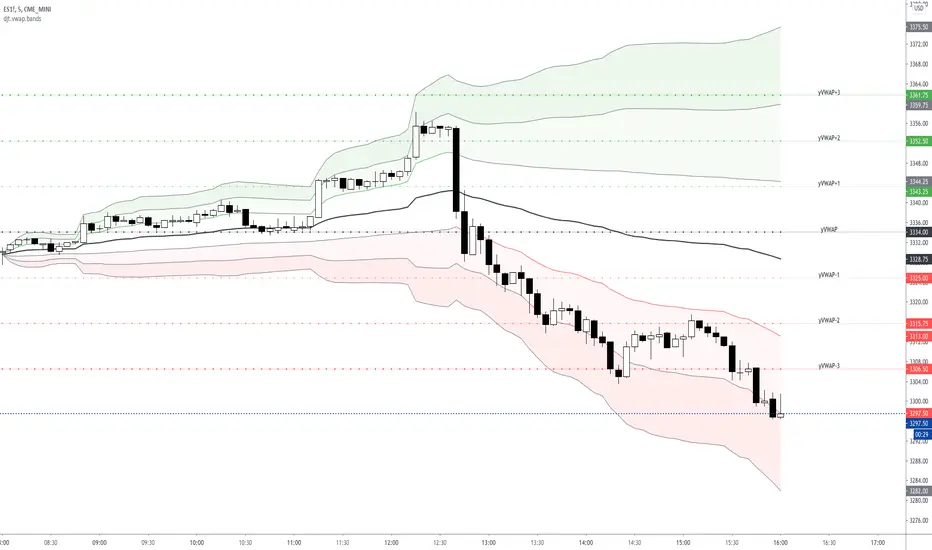
VWAP Standard Deviation Bands w/History & LabelsThis is my bread and butter when trading futures .
- 3 Standard Deviation Bands (Above and Below)
- Yesterday's VWAP and Band Levels
- Labels to help keep track of levels
- Ability to define resolution (I use Daily for my intraday scalping and Weekly/Monthly for context)
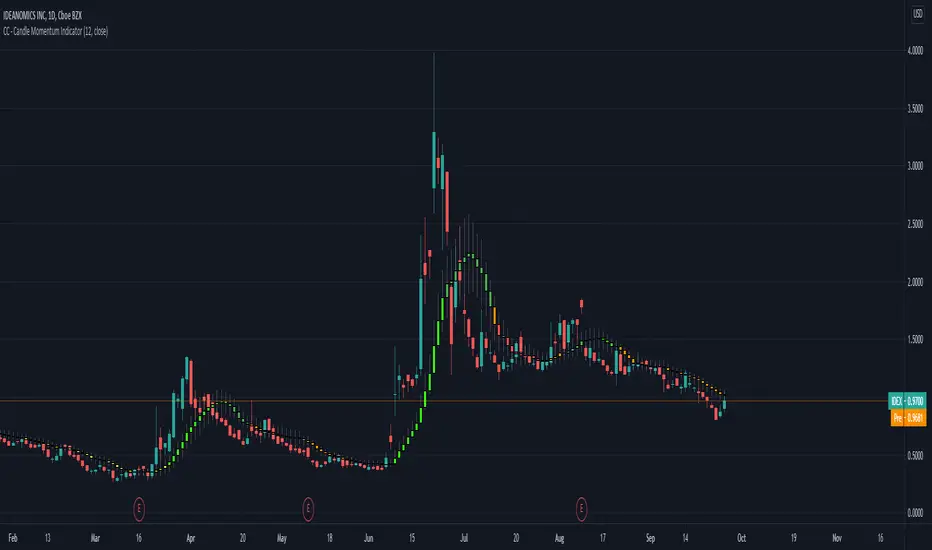
CC - Candle Momentum IndicatorA simple VWAP and SMA smoothing on the candles along with some momentum coloring. Basically, if the "slider" is slid all the way up and it turns red, moving down or losing volume t's probably going down. If it's all the way down and starts turning green, getting bigger and seeing volume, it's probably going up. this is a prototype indicator that I plan to extend using arrays and averages if it is seen as something useful.
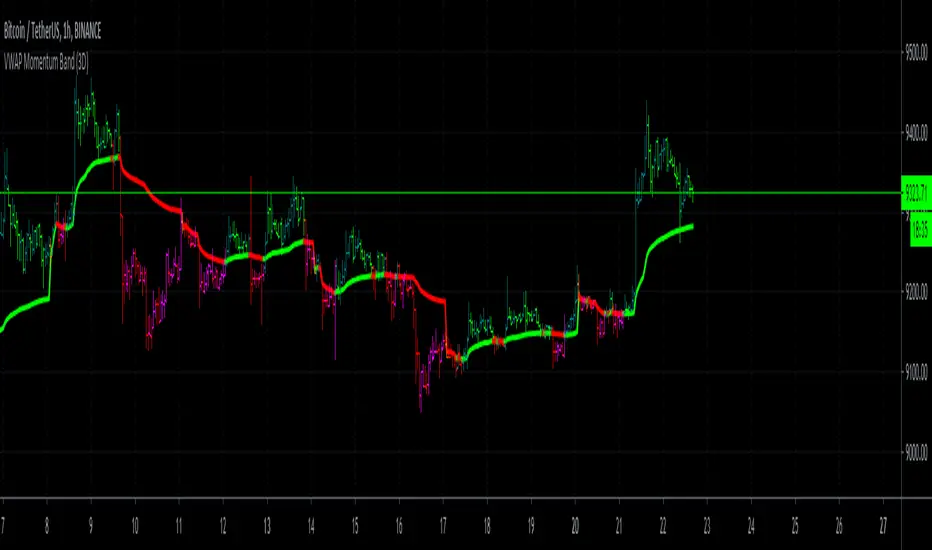
VWAP Momentum BandHow to use:
This should always be used in a bar chart. You as a trader actually just have to look for the color of the band in the middle, it tries to indicate you the coming up price action it also shows you where there is gaining momentum into your direction.
Band is green, what to do ?
Shown with the darker green candles and loosing momentum with the lighter green candles for the upward direction.
Band is red, what to do ?
Shown with the darker red color is momentum to the downwards direction and pink or lighter red color in the bars indicate loosing momentum to the downward direction.
If used correctly this indicator can also be used to feed trading bots via the Trading View Alerts.
Here are a few chart examples:
For example this for daytrading Tesla Stock.
Or daytrading NIO
If there are any questions left open, please send us a direct message!
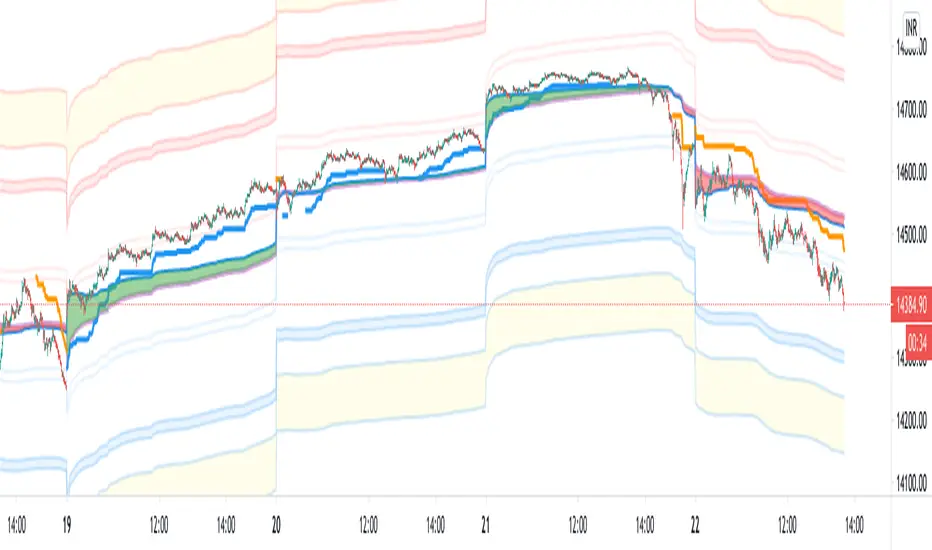
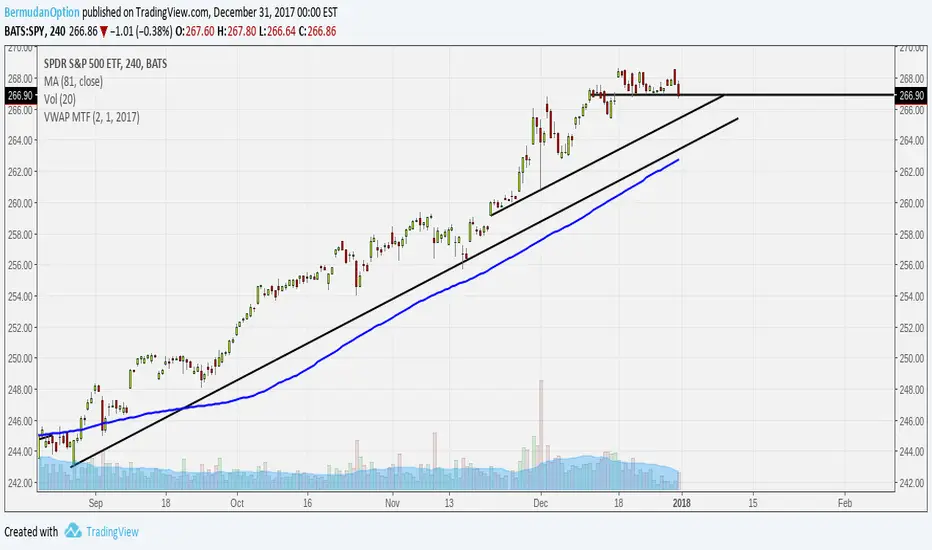
Vwap Ribbon - JDThis indicator displays a custom timeframe VWAP line
together with several multiples of this timeframe
After a large price move, the price often tends to return to one of these multiples
JD.
#nottradingadvice
#DYOR


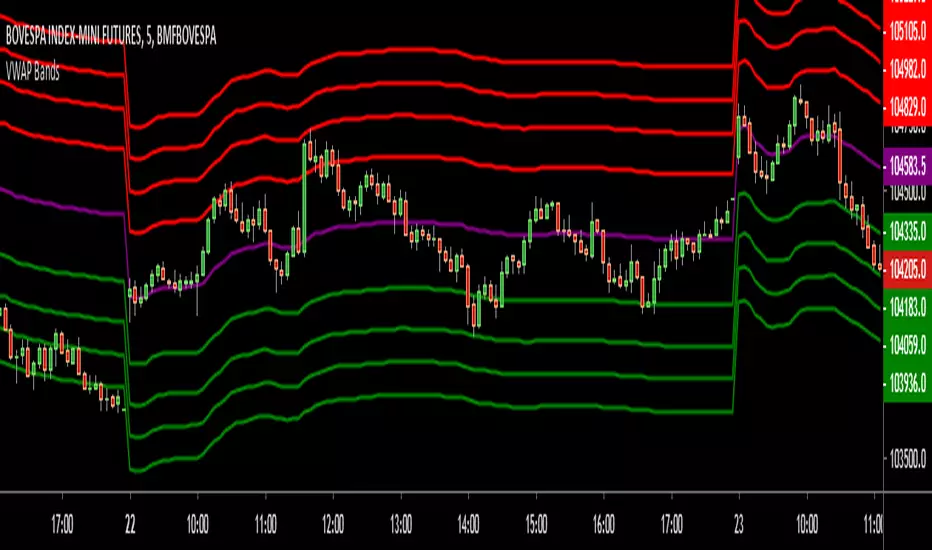
VWAP Bands This is a free script I made for the users of my FREE Liquidation Hunter BOT to help visualize vwap offsets over time.

VWAP BandsThis indicator plots distant VWAP lines that serve as support and resistance. You can add more lines from the script.
Good trades!

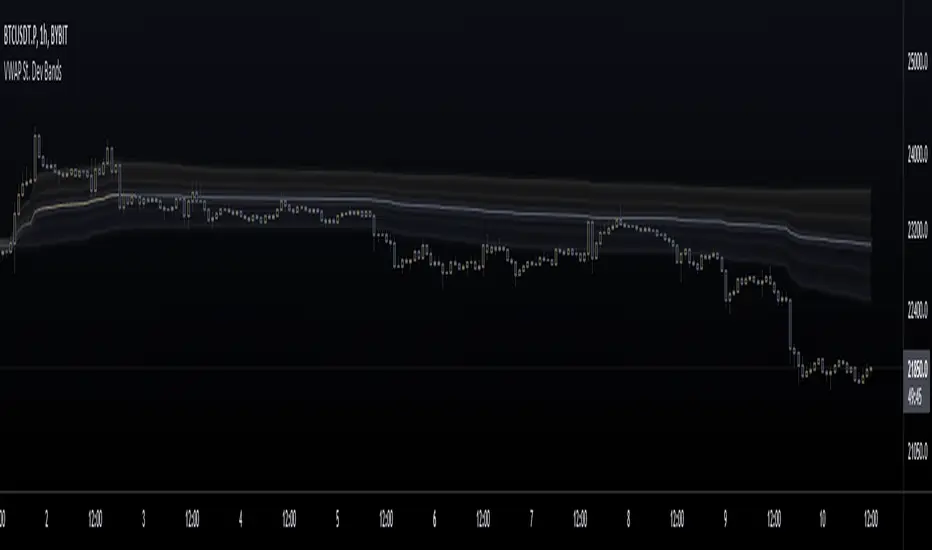
VWAP Stdev Bands v3Adds timeframe option for Weekly and Monthly timeframes, changes default 2nd and 3rd bands to more common deviations


VWAP Stdev BandsThis indicator plots VWAP with 2x Standard Deviation bands. This could potentially be used to trade a mean reversion type strategy. Only works on intraday charts.