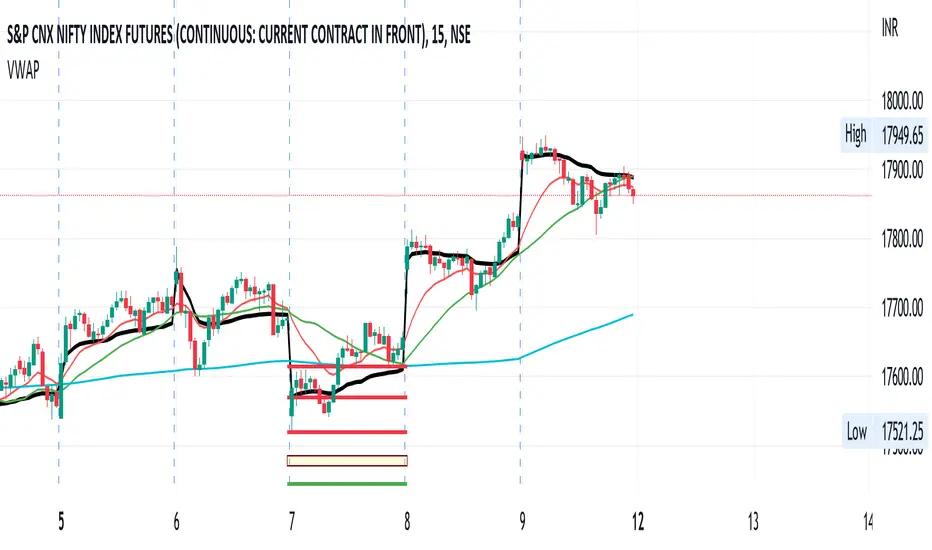
[AKC Trading] VWAPIndian Major indices (NIFTY & BANKNIFTY) doesn't have volumes as they are not traded.
So we imported volumes from their future current month and use price of spot to calculate VWAP.
For day trading, it is assumed that
(a) when price is above VWAP, it shows price has buying pressure
(b) when price is below VWAP, it shows price has selling pressure
(c) when price is hovering around VWAP, it is assumed, price is in range and forming some sort of pattern for intraday.
One should never trade only based on VWAP but add something else like EMA, SuperTrend for additional confirmation to execute any trade.
PS: This VWAP indicator works well with all symbols which has volume and added additional volume (from futures) on NIFTY & BANKNIFTY SPOT.
Buscar en scripts para "vwap"

High/Low Anchored VWAPHigh/Low Anchored VWAP simply plots an Anchored VWAP at High and Low, within a set range (D,W,M) , with a central "Basis" plot of the High and Low anchored VWAPs
*DISCLAMER* This indicator repaints. DO NOT set alerts or backtest using this indicator.

VWAP OscillatorI like a clean chart and trade primarily with price action alone, but the power of VWAP is undeniable, which is why VWAP is the basis of most of my scripts.
The VWAP oscillator plots VWAP as the zero line with exponential average price, relative to VWAP. This can be use the same way you would traditionally use VWAP, but after creating the script, I noticed divergence was also extremely noticeable here!

USA VWAPFuture traders commonly watch both the globex VWAP (all time) and the US session VWAP (9:30am to 4:00pm). Trading view's built-in VWAP indicator plots the globex VWAP. The USA VWAP indicator overlays the US session VWAP (using hlc3) onto any futures asset. It works for stocks too, but it would be the exact same thing as using the builtin VWAP indicator.

Intraday Direction Finder For Indices (Based On VWAP) Happy Independence Day..!!
------------------------------------------------------------------------
This indicator is based on the concept shared by "learntotrade365" to Find Intraday Direction for Index.
To decide the direction of Index we check whether the constituent Stocks are trading above VWAP or below VWAP.
Lets Consider Banknifty Example.
Banknifty Constituents are:
HDFC Bank
ICICI Bank
KOTAK Bank
SBI
AXIS Bank
IndusInd Bank
Based on concept, where above stocks are trading decides the direction as follows
Ratio Concept (Color)
6:0 Super Bullish (Lime)
5:1 Bullish(Green)
4:2 Mild Bullish (Aqua)
3:3 Sideways(Blue)
2:4 Mild Bearish ( Orange)
1:5 Bearish (Fuchsia)
0:6 Super Bearish (Red)
-------------------------------------------------------------------------
Features :-
1) Screener
In this Screener, we can clearly see which stock is trading above VWAP
& which is trading below VWAP along with ratio.
2) Chart Candle Colors
One can able to project candle colors according to Ratio colors.
3)Chart Background Color
One can set background color of chart if he is required.
------------------------------------------------------------------------
Same this can be used with other indices also like Nifty, Finnifty etc.
-------------------------------------------------------------------------
Thanks For Reading Till here...!!
------------------------------------------------------------------------
Kindly share your feedback or any suggestions.
------------------------------------------------------------------------

VWAP Anchored Date with multiplierA modified version from the default VWAP indicator with 2 major enhancements:
1- Start date: instead of being limited to applying the indicator on the entire chart, this script allows you to select the start time to show the VWAP. You can also use this option to show VWAP on an instrument starting from a specific time, all time high for example.
2- Multiplier: You can choose a period multiplier for VWAP, like 2 days, 4 month, 3 years and so on
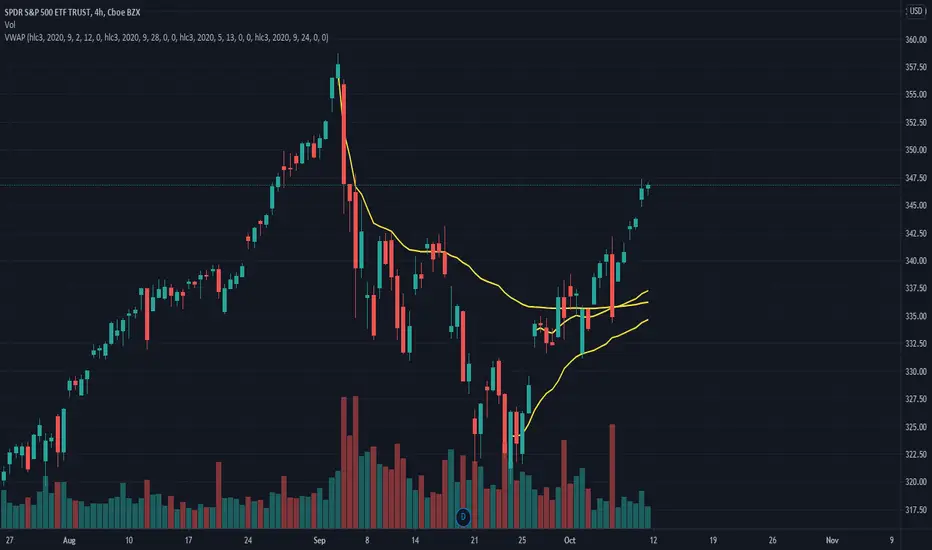
Mike's VWAP Pop/Crack StratWill signal based on the VWAP Pop and Crack strategy. You can change the time frame -- default is set to current chart -- to 5 minute if you wish to use 5 minute alerts on a 1 minute, 15-second, etc. chart.
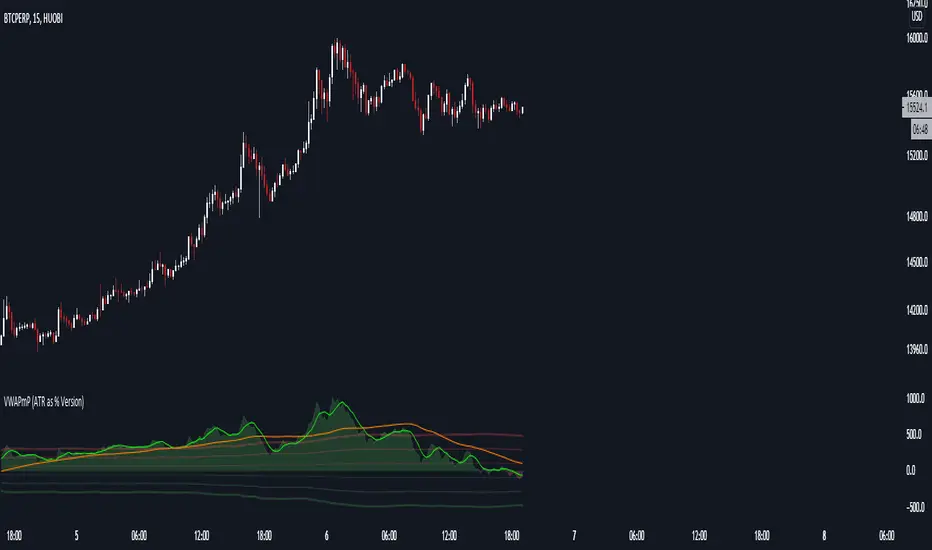
VWAPmP (ATR as % Version)This indicator displays a histogram for the distance of closing price from a VWAP value. The VWAP length is rolling and its value is user defined. Additionally, there are 3 bands which are based on the %-value of the underlying ATR. The ATR's length can be chosen by the user, and the distance multipliers may also be chosen. Lastly, there are two simple moving averages which have user-defined lengths and are based on the histograms value.
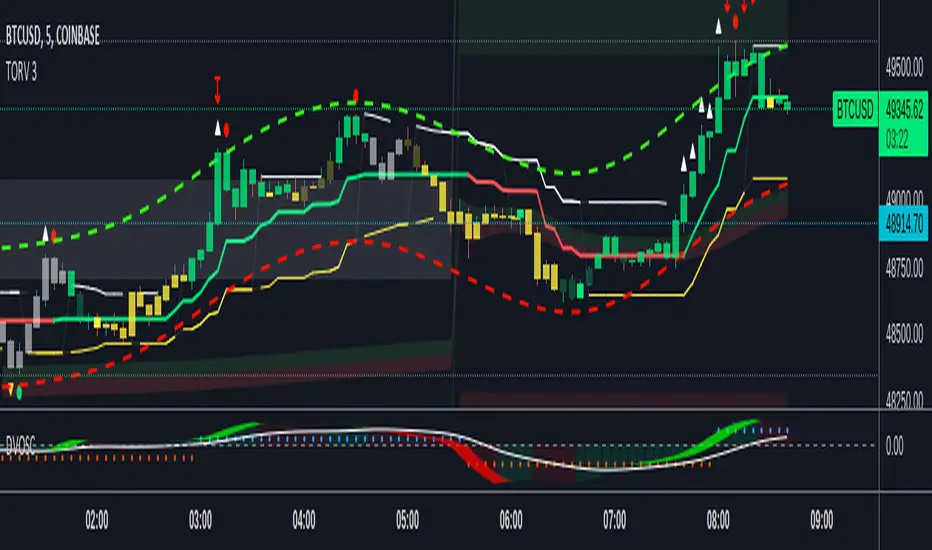
VWAP OscillatorToday I'm proposing a simple VWAP oscillator script to trade buy and sell waves more easily.
You trade this similar to how you trade Awesome Oscillator, so if you want an explanation just look up YT videos.
In addition to that, this will also show volume squeezes, please note that this is a makeshift way and not real volume squeeze phenomena of volume profile and tape. None the less, it is quite good at allowing you to ride out good trending waves and locate weak price action due to volume squeeze. You can turn off bar coloring from settings if you don't want this.
For ease of reading, I've also applied Allenstars Dynamic zones on this indicator so you can easily locate where the reading is entering in long and where it is in sell, this is compared to selected sample size. I've already selected the most common setting for that, so you don't really need to fiddle with it unless you find something better.
This indicator can be used to trade divergences as well, in fact, I feel it is better for that compared to RSI/MACD, the usual suspects.
Past performance is not assurance of future performance and this idea is published for only educational purposes, author taken no responsibility for your profit or loss.
VWAP Standard DeviationsVWAP Standard Deviations
VWAPSD is an indicator that can be used to identify Support & Resistance lines based on Volume per Price.
Such an indicator can be easily used to place a limit order on the SR levels

vwap pivotsThese levels keep track of the last periods VWAP open and close for the specified periods. It also tracks the high and low for the vwap during the current period. The fill color corresponds to trend estimations. I like to use it on a low timeframe for support and resistance levels.

VWAP Bands ProDisclaimer: This script is for educational purposes only and is not financial advice. Trading involves risk, and users are responsible for their own decisions.
VWAP Bands Pro is a professional volatility tool that anchors the Volume Weighted Average Price to a chosen timeframe and projects standard deviation bands to reveal stretched price zones.
Key Features
Anchored Precision : Calculates VWAP from a fixed anchor period (default: Daily) for a clean institutional reference point.
Standard Deviation Bands : Plots 1s, 2s, and 3s bands to show volatility. Moves into the outer bands often point to exhaustion or possible reversal areas.
Glowing Gradient Design : Uses a premium multi step gradient that fades outward, making extreme zones easy to spot.
Clean Visuals : Prioritizes smooth gradient fills instead of crowding the chart with heavy lines.
How to Use
Anchor Period : Select the timeframe you want the tool to follow. Daily works well for intraday setups, while Weekly or Monthly suits swing trades.
Strategy : Watch for mean reversion setups when price moves into the 2s to 3s outer zones and starts to reject, aiming for a return toward the central VWAP.

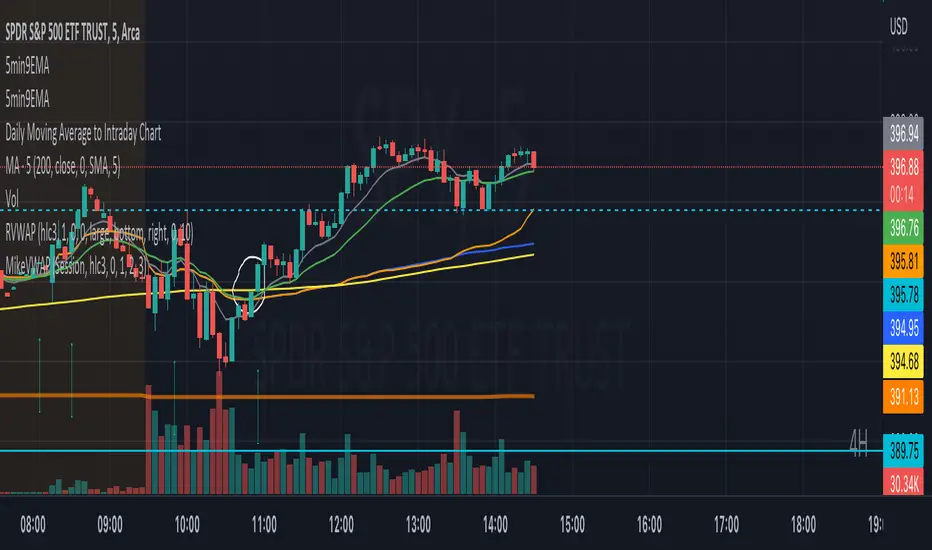
VWAP+SMA+EMAThis is the only indicator combing the results of VWAP + 2 SMAs + 2 EMAs.
This is a free indicator. Enjoy using it.
Kunal Jain
VWAP - Standard + 3 multi periodThis script combines the standard VWAP with 3 additional period-dependent VWAPs (originally coded by Neolao).

rth vwap and midMidpoint and VWAP are often important inflection points in daytrading. I managed to find a script providing me with a 24 hour session midline by NorthStarDayTrading and a RTH VWAP script by LDBC. So I decided to merge those two to get a RTH mid and vwap.

Rumpy's Donchian Anchored VWAPUses donchian points to anchor VWAPs (start a new VWAP interval). The defaults are set up for a 1H chart, with lookback periods of 1 day, 2 days, 1 week, 2 weeks and 4 weeks for the anchor points.
Green : upper donchian AVWAPs, Red : lower donchian AVWAPS, thin/1day to thickest/4 week.
Option to test whether a new point should be formed from a high or low exceeding the historical high/low over a lookback length or using a closes that exceed the historical high/low.
--------------------------------------
If you find it useful please consider a tip/donation :
BTC - 3BMEXEDyWJ58eXUEALYPadbn1wwWKmf6sA

Flunki Multi timeframe MTF VWAPsMultiple Timeframe VWAP plots.
Seven of them.
With colour flips and plot horizontal options.
Possibly more VWAP than you need... but you have an on / off option for each.
Enjoy.
Add me on Twitter @flunkimoku or find me in the OneX discord..

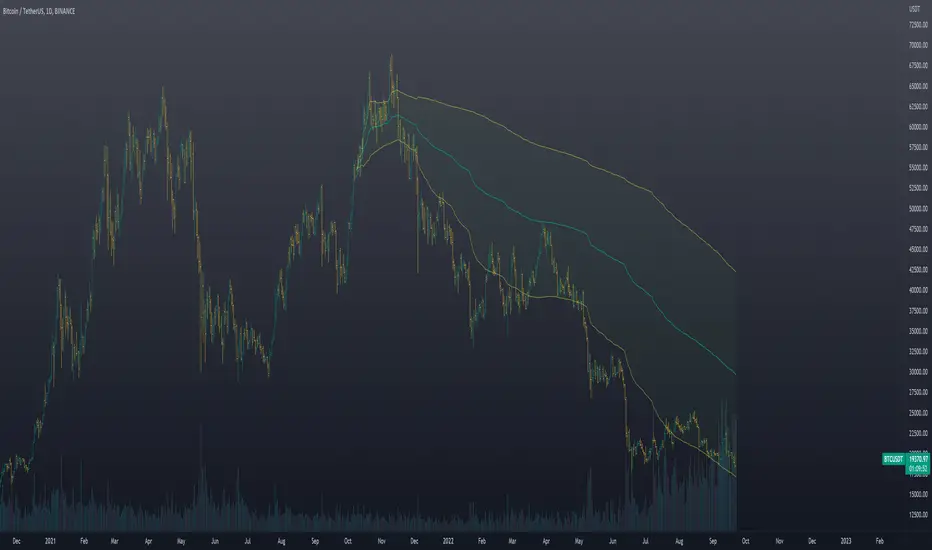
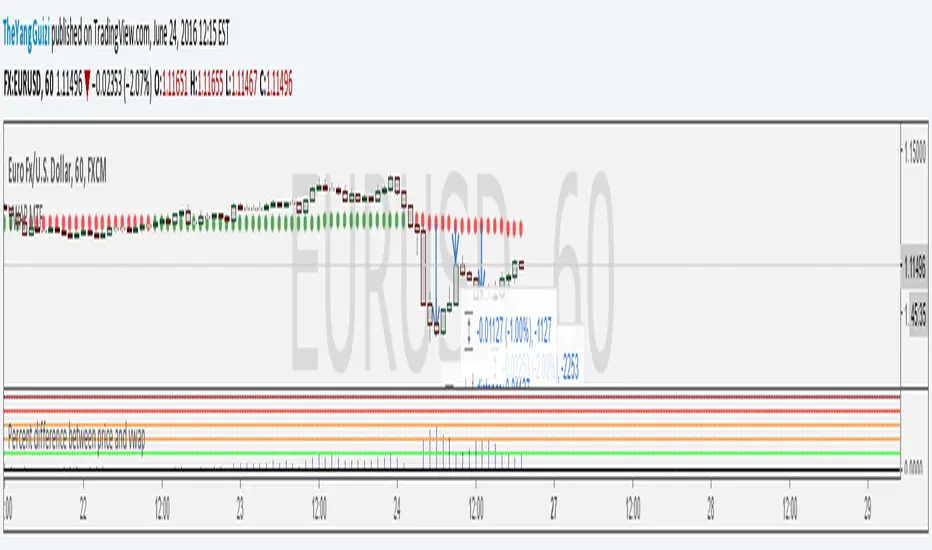
Percent Difference Between VWAP and Price MTFShows the difference between vwap and price in percent.
You can can choose between multiple timeframe vwap. Default is normal daily.
The levels on the indicator can be changed to whatever you want to.
In the chart above we can see eurusd reverting up at 3% below monthly vwap, after the brexit dip, It then turns down again at 1% from monthly and lastly it turns up again at 2% from monthly.
Script is a small modification of this:
Custom MTF VWAP 4x with IBI put this indicator together to have my main VWAP levels displayed on the chart easily with shaded areas when price is over extended. The IB I added to have the option to change futures based on an initial balance strategy combined with the daily and NY VWAP.

VWAP Session and NY CashAuto Anchored VWAPs with Label options
Session starts at 1800 EST
Cash Open or NY Session starts 0930 EST

Rolling Anchored VWAPRolling Anchored VWAP
This is my Rolling Anchored VWAP. Instead of being anchored to a fixed point of time, its anchored to a specific time-frame (ex. 24 hours to the minute) so the anchor point is constantly moving with time.
Enjoy


Nic's Anchored VWAP 4Poor mans anchored vwap. Allows you to identified the volume weighted average price from 4 specific points in time.
Best used on key pivot point high's and lows'