FiboStaircase by Solah AzmanThe band represents the range between local highest and local lowest and the layers are proportional to Fibonacci ratio. Suitable for 5 minutes charts.
Buscar en scripts para "volume"

[rs] TrendLazyBear's WaveTrend port has been praised for highlighting trend reversals with precision and punctuality (minimal lag). But strong "3rd Wave" trends can "embed" or saturate any oscillator flashing several premature crosses while stuck overbought/oversold. This happens when the trend stretches over a longer timescale than the oscillator's averaging window or filter time constant. Our solution: simultaneously monitor many oscillator timescales. Watch for fresh crossovers in "dominant" timescales alternating most smoothly between the overbought (red shade) and oversold (green shade) range.

[VIP] Long/Short Strategy 79-80 Profit Percentage or even moreThis is using Toolkit buy and sell:
You have 7 days trial, so you should make sure that you make a profit instead of loss
We have 4 strategies named 01, 02, 03, 04 and will be added more soon
Disclaimer
Tested from 3 minutes to 1 Day time frame
Possible repainting because I use security function
I use Pinescript v4
barmerge.gaps is disabled
barmerge.lookahead is enabled
Configuration
Intense Level: default is 6, to provide signal frequency to the chart, the lower number will return more signal, the image is 3, means more attentions or actions*] Possible repainting because I use security function
Custom Timeframe: default is using chart time frame, to calculate signal based on different timeframes without change the chart time frame.
Strategy: Other approaches long or short algorithm

REAL STRATEGY : Dow_Factor_MFI/RSI_DVOG_StrategyI'm actually one of those who think it's more important to extract clues from indicators than strategy, but I wanted to test the data about the probability and dow factor I've shared for a long time.
Usually, Bitcoin is used as an eye stain for strategy success, since the graph has increased significantly from the beginning.
To prevent this, I used a commission and in the last lines of document I shared Bitmex's Bitcoin and Ethereum 1W test results.
I don't think there's a factor to repaint. ( Warn me if u see or observe )
I considered Bitcoin because I found working with liquid parities much more realistic.
Ethereum and Bitmex have been featured as a spot and may soon find a place at the CME , so I've evaluated the Ethereum .
But since the Ethereum Bitmex was also spot new, I deleted results that were less than 10 closed trades.
Since the Dow Theory also looks at the harmony in the indices, just try it in the Cryptocurrency market.
Use as indicator in other markets. Support with channels, trend lines with big periods and other supportive indicators.
And my personal suggestion : Use this script and indicator TF : 4H and above.
Specifications :
Commission. ( % 0.125 )
Switchable Methods ( Relative Strength Index / Money Flow Index )
Alarms. (Buy / Sell )
Position closure when horizontal market rates weighs.
Progressive gradual buy/sell alarms.
Clean code layout that will not cause repaint. (Caution : source = close )
Switchable barcolor option (I / 0 )
*****Test results :*****
drive.google.com
Summary:
It was a realistic test.
It has achieved great success in some markets, but as I mentioned earlier, use it only to gain insight into the price movements of cryptos.
Use as indicator in other markets.
This code is open source under the MIT license. If you have any improvements or corrections to suggest, please send me a pull request via the github repository : github.com
Stay tuned ! Noldo.

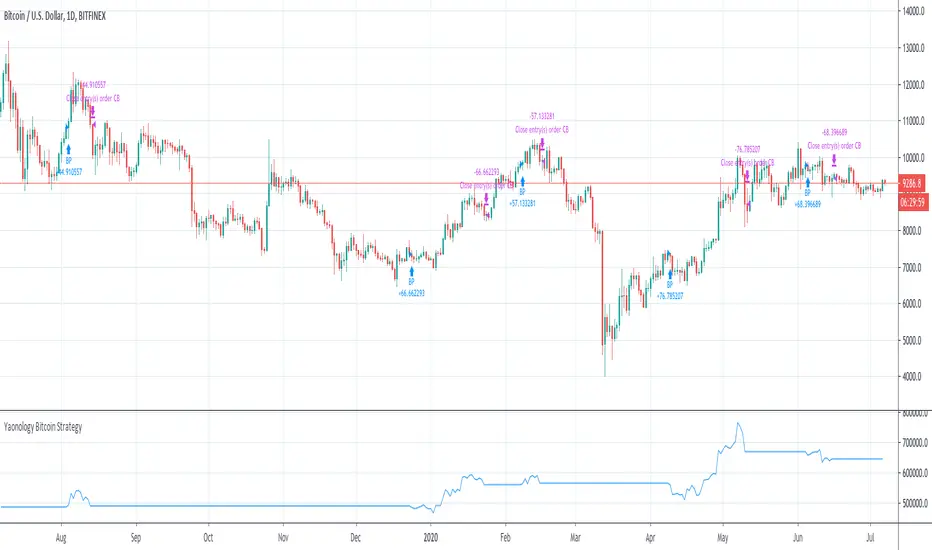
BITCOIN_BUYSELL_vs_DOMINANCEUpdated to three lines similar to the 20, 50, 200 ema however they utilize RSI + MACD + EMA + ROC + Averaging powers to generate buy and selling zones

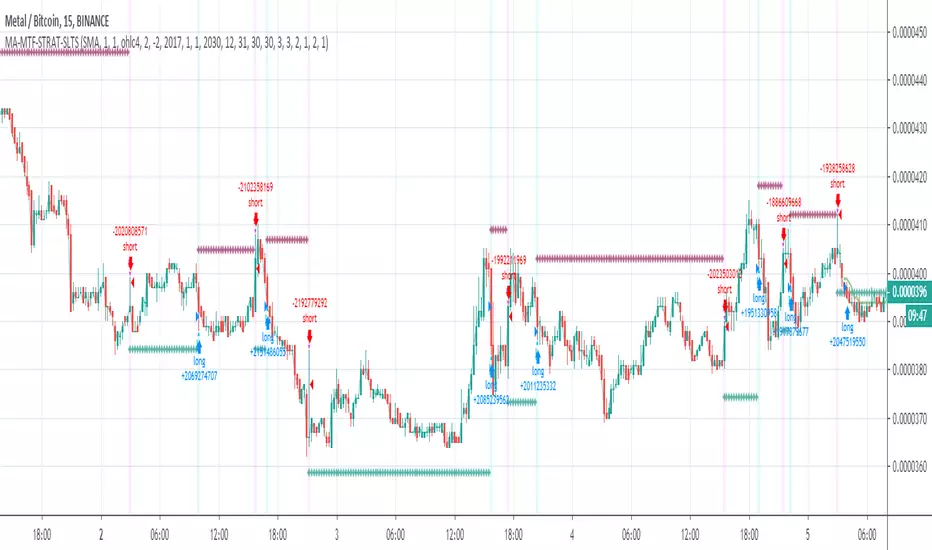
MA-MTF-STRAT-SLTS=== This is an updated version of the MA-MTF strategy ===
+ Take profit
+ Stop Loss
+ Traling Stop

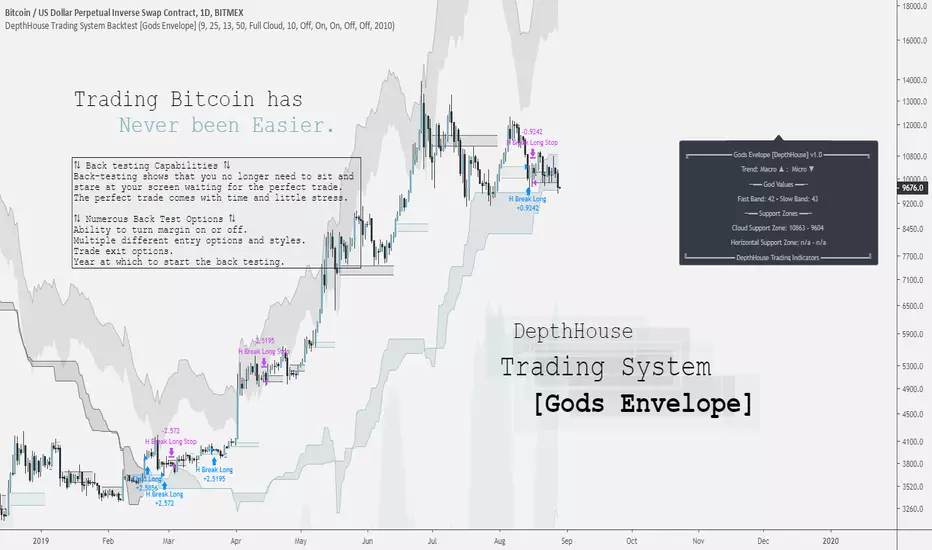
DepthHouse Trading System [Gods Envelope] Backtest StrategyCreated for Bitcoin!
*All testing has been done on the 1 Day time frame of BTC USD pairs.
Use at your own risk.
DepthHouse Trading System Basics
The Cloud:
The cloud is used in a very similar manner as the ichimoku cloud. A complete cross above or below the represents a macro trend change. The cloud then could be used as dynamic support and resistance zones.
By default there is no smoothing to the full cloud. If you wish to add smoothing, you can change the ‘Trend Base On’ option to ‘Modded Cloud Average’ to add price action and smoothing into the cloud’s calculations. The Modded Cloud can then be used in the same manner as the Full Cloud. Generally, the Full Cloud is more forgiving and has less Macro Trend changes. By default, this option is turned off. The support or resistance zone created will be shown on the info panel on the right.
Horizontal Levels:
A Horizonal zone is generated each time there is a micro level trend change. For example, as soon as a positive micro trend change occurs a green horizontal level will be plotted.
These levels then can be used as temporary support and resistance zones. The Horizontal Break Trading Strategy is entirely based on these levels. These levels are also shown on the info panel on the right.
The Envelope Itself: (by default this is off)
By selecting the Overbought and Oversold Ranges option, a cloud envelope will appear around the price action. This envelope represents the overbought and oversold ranges. If the price action should go into these zones, the info panel on the right will show ‘CAUTION’ beside the God Values as this signals that the pair is either overbought or oversold.
The God Values:
The God values are listed on the info panel on the right. These are the values created by the Godmode indicator. Generally, below 20 or above 80 it signals for caution as the price action has overextended itself.
The Back-Test Strategy Options:
⇅ - Child Fomo Positioning:
Child Fomo Positioning strategy is entirely based on the macro trend change with the center cloud. As soon as there is a complete candle close above or below the cloud and a trend change takes place. The back-test places a market order as soon as the next candle opens. By default, it then will not close this position until the price action fully crosses the cloud once again.
⇅ - Horizontal Break Trading:
Horizontal Break Trading Strategy is entirely based on the horizontal levels generated and the macro trend direction. For example, say the Macro Trend is up, and a green, positive horizontal level is formed. As soon as a complete candle closes above the upper level of the positive zone, a limit order is placed in hope that the price action comes back down and retests, filling the order. This long will not close then until a negative level is formed. As soon as a negative level is formed a stop/loss order is placed on the lower level of the horizontal support zone. It will then do the opposite in a bearish trend, and margin trading is turned on.
⇅ - Parent Positions :
Parent Positioning Strategy is based on the overall trend and the center cloud levels. This strategy has limit orders waiting on the level of the cloud that is closest to the price action. Therefore, using this strategy alone, the back-test system waits for the trend to be confirmed, and then follows the price action with limit orders waiting on the cloud to be retested. By default this order does not close until a Marco trend change occurs.
⇅ - Take 50% Partial Profits:
This options allows the back-test to take 50% profit or loss when one of the two options occur.
Horizontal Break: This would close 50% of the position in the same manner it would close a trade using the horizontal break trading system.
God Values: Once the price action enters the oversold or overbought clouds, it would then place a close order as soon as the price action exits the cloud.
⟲ - Backtest Year Start Date :
Start year of the back-testing. If set to ex. 2017, the back-test will not calculate any trades that took place before Jan. 1 of 2017.
⚖ - Margin Trading :
By default, margin trading is turned off. Simply switch this option to on the enable ‘Short Trading’ into the strategy back-test.
Notes: If you are back testing multiple strategies at the same time, you must increase the pyramiding to correspond to the number or strategies.
My Favorite Settings:
Margin = Off
Pyramiding = 2 [Settings → Properties → Pyramiding → 2 orders
Child Fomo Positioning = On
Horizontal Break Trading = On
Everything else off 😊
DISCLAIMER: Past performance does not guarantee future results.
Use at your own risk.
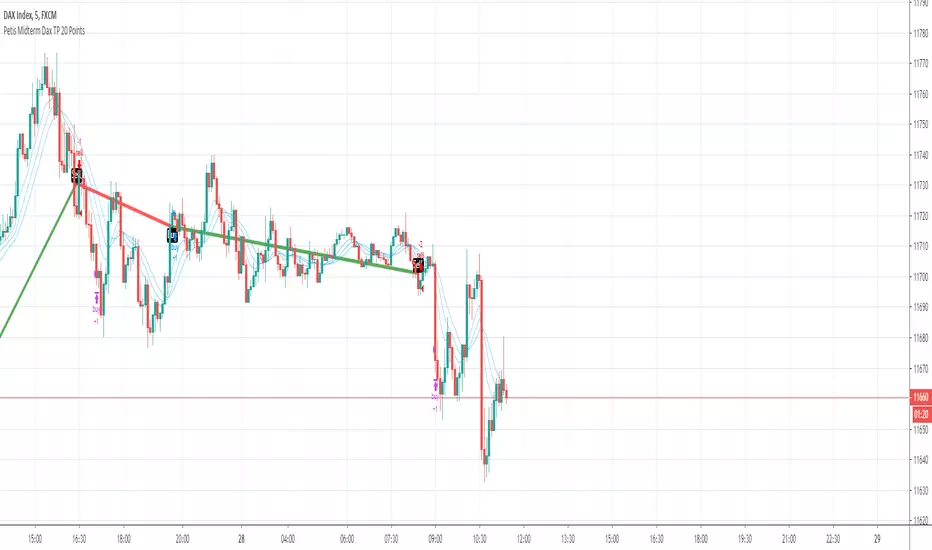
Petis Midterm Dax TP 20 PointsHy Leutz,
hier mein Script für meine Urlaubskasse meiner Frau.
Läuft ausschließlich im Ger30! Und auch da nur im 5 Min! Parameter sind darauf optimiert und getestet.
Meine Standarteinstellung ist 20 Pkt TP, kein SL! (BTW: Einen Not-Stopp-Loss kann man auf 250 Pkt setzen, falls mal alles schief geht oder Trump was twittert!)
Der Trade beginnt, wenn die Vorkerze dauerhaft Buy oder Sell anzeigt, nicht dann, während eine Kerze noch nicht fertig ist. Ansonsten kann es zu Repaints kommen!
Vorsicht: Im blödestens Fall kann es auch mal 100 Pkt gegen einen laufen, deshalb Moneymanagement beachten!
Ich trade es mit 0.2 CFD pro Punkt. Ganzidealerweise wartet man nach einm Signal, dass es erst ein paar Punkte in die falsche Richtung läuft und steigt dann ein. Oder man splittet die Posis und geht mit 50% gleich, mit der 2. Hälfte dann bei -10 Pkt rein. Einfach mal anschauen. Und man setzt die Ziele bitte auch per Take Profit, sonst geht die Gier mit einem durch.
Die beigefügte Historie zeigt die Performance in gut 2.5 Monaten, 1.7 K € . Passt schon. Da geht auch der Mietwagen und die Pizza mit rein. :)
Üblicherweise kommen so 5 bis 25 Signale in einer Woche. Je volatiler der Markt, desto höher die Signaldichte.
Geschrieben für meine Frau, die nebenbei ihre Urlaubskasse füllen möchte. Cheers my Love. Lets got to Hollywood!

MoneyBible QTUMUSDT BacktesterMoneybible BINANCE:QTUMUSDT backtester on 15m candlestick . It will be re-optimized monthly.
The script is written in PineScript V.3, makes no use of the security() function and does not use the Trailing Stop-Loss function from TradingView. No repainting issue.
DM me for joining discord and getting a trial.
Alert script here :

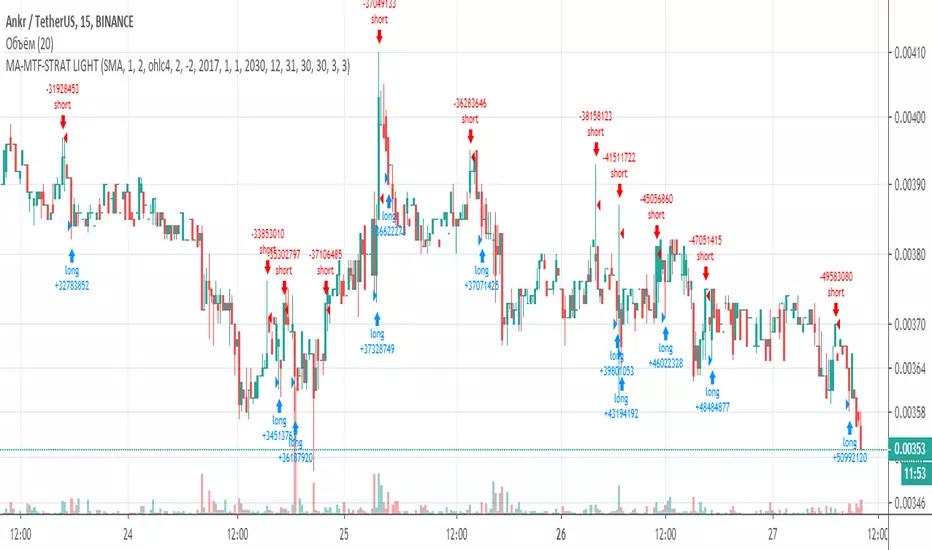
MA-MTF-STRAT// Strategy based on SMA
// Time frame 5M, 10M, 15M
// Created and based on Binance chart
// Working with comission
// No repaints

MoneyBible ETHUSD BacktesterMoneybible BITMEX:ETHUSD backtester on 15m candlestick . It will be re-optimized monthly.
The script is written in PineScript V.3, makes no use of the security() function and does not use the Trailing Stop-Loss function from TradingView. No repainting issue.
Alert script here :

MoneyBible XBTUSD BacktesterMoneybible BITMEX:XBTUSD backtester on 10m candlestick . It will be re-optimized monthly.
The script is written in PineScript V.3, makes no use of the security() function and does not use the Trailing Stop-Loss function from TradingView. No repainting issue.
Alert script here :