Candle Closer Levels & TP Zones📝 Description:
This indicator is designed to provide intrabar trade levels for high-speed execution strategies, such as scalping and intraday momentum trading.
🧩 Key Features:
Plots High, Low, Mid, and two Quarter Levels on the current candle only, keeping charts clean
Take Profit (TP) lines are calculated as a percentage of candle range, not fixed ticks — this makes it highly adaptable for futures like NQ/ES or volatile markets like crypto
Supports both long and short setups via a simple toggle
Customizable colors, line thickness, and length
Each TP level can be enabled or muted individually
📈 Use Case:
Apply this tool to spot candle-based breakouts or rejections. You can scale TPs dynamically based on the strength of the current candle. This is especially helpful in assets where volatility fluctuates greatly intrabar.
This is not a repackaged built-in indicator — it’s purpose-built for real-time tactical level plotting without historical noise.
Buscar en scripts para "tp"

VWAP Breakout Strategy + EMAs + Clean Cycle/TP/SL PlotsHere’s a quick user-guide to get you up and running with your “VWAP Breakout Strategy + EMAs + Clean Cycle/TP/SL Plots” script in TradingView:
⸻
1. Installing the Script
1. Open TradingView, go to Pine Editor (bottom panel).
2. Paste in your full Pine-v6 code and hit Add to chart.
3. Save it (“Save as…”): give it a memorable name (e.g. “VWAP Breakout+EMAs”).
⸻
2. Configuring Your Inputs
Once it’s on the chart, click the ⚙️ Settings icon to tune:
Setting Default What it does
ATR Length 14 Period for average true range (volatility measure)
ATR Multiplier for Stop 1.5 How many ATRs away your stop-loss sits
TP1 / TP2 Multipliers (ATR) 1.0 / 2.0 Distance of TP1 and TP2 in ATR multiples
Show VWAP / EMAs On Toggles the blue VWAP line & EMAs (100/34/5)
Full Cycle Range Points 200 Height of the shaded “cycle zone”
Pivot Lookback 5 How many bars back to detect a pivot low
Round Number Step 500 Spacing of your dotted horizontal lines
Show TP/SL Labels On Toggles all the “ENTRY”, “TP1”, “TP2”, “STOP” tags
Feel free to adjust ATR multipliers and cycle-zone size based on the instrument’s typical range.
⸻
3. Reading the Signals
• Long Entry:
• Trigger: price crosses above VWAP
• You’ll see a green “Buy” tag at the low of the signal bar, plus an “ENTRY (Long)” label at the close.
• Stop is plotted as a red dashed line below (ATR × 1.5), and TP1/TP2 as teal and purple lines above.
• Short Entry:
• Trigger: price crosses below VWAP
• A red “Sell” tag appears at the high, with “ENTRY (Short)” at the close.
• Stop is the green line above; TP1/TP2 are dashed teal/purple lines below.
⸻
4. Full Cycle Zone
Whenever a new pivot low is detected (using your Pivot Lookback), the script deletes the old box and draws a shaded yellow rectangle from that low up by “Full Cycle Range Points.”
• Use this to visualize the “maximum expected swing” from your pivot.
• You can quickly see whether price is still traveling within a normal cycle or has overstretched.
⸻
5. Round-Number Levels
With Show Round Number Levels enabled, you’ll always get horizontal dotted lines at the nearest multiples of your “Round Number Step” (e.g. every 500 points).
• These often act as psychological support/resistance.
• Handy to see confluence with VWAP or cycle-zone edges.
⸻
6. Tips & Best-Practices
• Timeframes: Apply on any intraday chart (5 min, 15 min, H1…), but match your ATR length & cycle-points to the timeframe’s typical range.
• Backtest first: Use the Strategy Tester tab to review performance, tweak ATR multipliers or cycle size, then optimize.
• Combine with context: Don’t trade VWAP breakouts blindly—look for confluence (e.g. support/resistance zones, higher-timeframe trend).
• Label clutter: If too many labels build up, you can toggle Show TP/SL Labels off and rely just on the lines.
⸻
That’s it! Once you’ve added it to your chart and dialed in the inputs, your entries, exits, cycle ranges, and key levels will all be plotted automatically. Feel free to experiment with the ATR multipliers and cycle-zone size until it fits your instrument’s personality. Happy trading!

Enhanced Range Filter Strategy with ATR TP/SLBuilt by Omotola
## **Enhanced Range Filter Strategy: A Comprehensive Overview**
### **1. Introduction**
The **Enhanced Range Filter Strategy** is a powerful technical trading system designed to identify high-probability trading opportunities while filtering out market noise. It utilizes **range-based trend filtering**, **momentum confirmation**, and **volatility-based risk management** to generate precise entry and exit signals. This strategy is particularly useful for traders who aim to capitalize on trend-following setups while avoiding choppy, ranging market conditions.
---
### **2. Key Components of the Strategy**
#### **A. Range Filter (Trend Determination)**
- The **Range Filter** smooths price fluctuations and helps identify clear trends.
- It calculates an **adjusted price range** based on a **sampling period** and a **multiplier**, ensuring a dynamic trend-following approach.
- **Uptrends:** When the current price is above the range filter and the trend is strengthening.
- **Downtrends:** When the price falls below the range filter and momentum confirms the move.
#### **B. RSI (Relative Strength Index) as Momentum Confirmation**
- RSI is used to **filter out weak trades** and prevent entries during overbought/oversold conditions.
- **Buy Signals:** RSI is above a certain threshold (e.g., 50) in an uptrend.
- **Sell Signals:** RSI is below a certain threshold (e.g., 50) in a downtrend.
#### **C. ADX (Average Directional Index) for Trend Strength Confirmation**
- ADX ensures that trades are only taken when the trend has **sufficient strength**.
- Avoids trading in low-volatility, ranging markets.
- **Threshold (e.g., 25):** Only trade when ADX is above this value, indicating a strong trend.
#### **D. ATR (Average True Range) for Risk Management**
- **Stop Loss (SL):** Placed **one ATR below** (for long trades) or **one ATR above** (for short trades).
- **Take Profit (TP):** Set at a **3:1 reward-to-risk ratio**, using ATR to determine realistic price targets.
- Ensures volatility-adjusted risk management.
---
### **3. Entry and Exit Conditions**
#### **📈 Buy (Long) Entry Conditions:**
1. **Price is above the Range Filter** → Indicates an uptrend.
2. **Upward trend strength is positive** (confirmed via trend counter).
3. **RSI is above the buy threshold** (e.g., 50, to confirm momentum).
4. **ADX confirms trend strength** (e.g., above 25).
5. **Volatility is supportive** (using ATR analysis).
#### **📉 Sell (Short) Entry Conditions:**
1. **Price is below the Range Filter** → Indicates a downtrend.
2. **Downward trend strength is positive** (confirmed via trend counter).
3. **RSI is below the sell threshold** (e.g., 50, to confirm momentum).
4. **ADX confirms trend strength** (e.g., above 25).
5. **Volatility is supportive** (using ATR analysis).
#### **🚪 Exit Conditions:**
- **Stop Loss (SL):**
- **Long Trades:** 1 ATR below entry price.
- **Short Trades:** 1 ATR above entry price.
- **Take Profit (TP):**
- Set at **3x the risk distance** to achieve a favorable risk-reward ratio.
- **Ranging Market Exit:**
- If ADX falls below the threshold, indicating a weakening trend.
---
### **4. Visualization & Alerts**
- **Colored range filter line** changes based on trend direction.
- **Buy and Sell signals** appear as labels on the chart.
- **Stop Loss and Take Profit levels** are plotted as dashed lines.
- **Gray background highlights ranging markets** where trading is avoided.
- **Alerts trigger on Buy, Sell, and Ranging Market conditions** for automation.
---
### **5. Advantages of the Enhanced Range Filter Strategy**
✅ **Trend-Following with Noise Reduction** → Helps avoid false signals by filtering out weak trends.
✅ **Momentum Confirmation with RSI & ADX** → Ensures that only strong, valid trades are executed.
✅ **Volatility-Based Risk Management** → ATR ensures adaptive stop loss and take profit placements.
✅ **Works on Multiple Timeframes** → Effective for day trading, swing trading, and scalping.
✅ **Visually Intuitive** → Clearly displays trade signals, SL/TP levels, and trend conditions.
---
### **6. Who Should Use This Strategy?**
✔ **Trend Traders** who want to enter trades with momentum confirmation.
✔ **Swing Traders** looking for medium-term opportunities with a solid risk-reward ratio.
✔ **Scalpers** who need precise entries and exits to minimize false signals.
✔ **Algorithmic Traders** using alerts for automated execution.
---
### **7. Conclusion**
The **Enhanced Range Filter Strategy** is a powerful trading tool that combines **trend-following techniques, momentum indicators, and risk management** into a structured, rule-based system. By leveraging **Range Filters, RSI, ADX, and ATR**, traders can improve trade accuracy, manage risk effectively, and filter out unfavorable market conditions.
This strategy is **ideal for traders looking for a systematic, disciplined approach** to capturing trends while **avoiding market noise and false breakouts**. 🚀

Enhanced Bollinger Bands Strategy with SL/TP// Title: Enhanced Bollinger Bands Strategy with SL/TP
// Description:
// This strategy is based on the classic Bollinger Bands indicator and incorporates Stop Loss (SL) and Take Profit (TP) levels for automated trading. It identifies potential long and short entry points based on price crossing the lower and upper Bollinger Bands, respectively. The strategy allows users to customize several parameters to suit different market conditions and risk tolerances.
// Key Features:
// * **Bollinger Bands:** Uses Simple Moving Average (SMA) as the basis and calculates upper and lower bands based on a user-defined standard deviation multiplier.
// * **Customizable Parameters:** Offers extensive customization, including SMA length, standard deviation multiplier, Stop Loss (SL) in pips, and Take Profit (TP) in pips.
// * **Long/Short Position Control:** Allows users to independently enable or disable long and short positions.
// * **Stop Loss and Take Profit:** Implements Stop Loss and Take Profit levels based on pip values to manage risk and secure profits. Entry prices are set to the band levels on signals.
// * **Visualizations:** Provides options to display Bollinger Bands and entry signals on the chart for easy analysis.
// Strategy Logic:
// 1. **Bollinger Bands Calculation:** The strategy calculates the Bollinger Bands using the specified SMA length and standard deviation multiplier.
// 2. **Entry Conditions:**
// * **Long Entry:** Enters a long position when the closing price crosses above the lower Bollinger Band and the `Enable Long Positions` setting is enabled.
// * **Short Entry:** Enters a short position when the closing price crosses below the upper Bollinger Band and the `Enable Short Positions` setting is enabled.
// 3. **Exit Conditions:**
// * **Stop Loss:** Exits the position if the price reaches the Stop Loss level, calculated based on the input `Stop Loss (Pips)`.
// * **Take Profit:** Exits the position if the price reaches the Take Profit level, calculated based on the input `Take Profit (Pips)`.
// Input Parameters:
// * **SMA Length (length):** The length of the Simple Moving Average used to calculate the Bollinger Bands (default: 20).
// * **Standard Deviation Multiplier (mult):** The multiplier applied to the standard deviation to determine the width of the Bollinger Bands (default: 2.0).
// * **Enable Long Positions (enableLong):** A boolean value to enable or disable long positions (default: true).
// * **Enable Short Positions (enableShort):** A boolean value to enable or disable short positions (default: true).
// * **Pip Value (pipValue):** The value of a pip for the traded instrument. This is crucial for accurate Stop Loss and Take Profit calculations (default: 0.0001 for most currency pairs). **Important: Adjust this value to match the specific instrument you are trading.**
// * **Stop Loss (Pips) (slPips):** The Stop Loss level in pips (default: 10).
// * **Take Profit (Pips) (tpPips):** The Take Profit level in pips (default: 20).
// * **Show Bollinger Bands (showBands):** A boolean value to show or hide the Bollinger Bands on the chart (default: true).
// * **Show Entry Signals (showSignals):** A boolean value to show or hide entry signals on the chart (default: true).
// How to Use:
// 1. Add the strategy to your TradingView chart.
// 2. Adjust the input parameters to optimize the strategy for your chosen instrument and timeframe. Pay close attention to the `Pip Value`.
// 3. Backtest the strategy over different periods to evaluate its performance.
// 4. Use the `Enable Long Positions` and `Enable Short Positions` settings to customize the strategy for specific market conditions (e.g., only long positions in an uptrend).
// Important Notes and Disclaimers:
// * **Backtesting Results:** Past performance is not indicative of future results. Backtesting results can be affected by various factors, including market volatility, slippage, and transaction costs.
// * **Risk Management:** This strategy is provided for informational and educational purposes only and should not be considered financial advice. Always use proper risk management techniques when trading. Adjust Stop Loss and Take Profit levels according to your risk tolerance.
// * **Slippage:** The strategy takes into account slippage by specifying a slippage parameter on the `strategy` declaration. However, real-world slippage may vary.
// * **Market Conditions:** The performance of this strategy can vary significantly depending on market conditions. It may perform well in trending markets but poorly in ranging or choppy markets.
// * **Pip Value Accuracy:** **Ensure the `Pip Value` is correctly set for the specific instrument you are trading. Incorrect pip value will result in incorrect stop loss and take profit placement.** This is critical.
// * **Broker Compatibility:** The strategy's performance may vary depending on your broker's execution policies and fees.
// * **Disclaimer:** I am not a financial advisor, and this script is not financial advice. Use this strategy at your own risk. I am not responsible for any losses incurred while using this strategy.

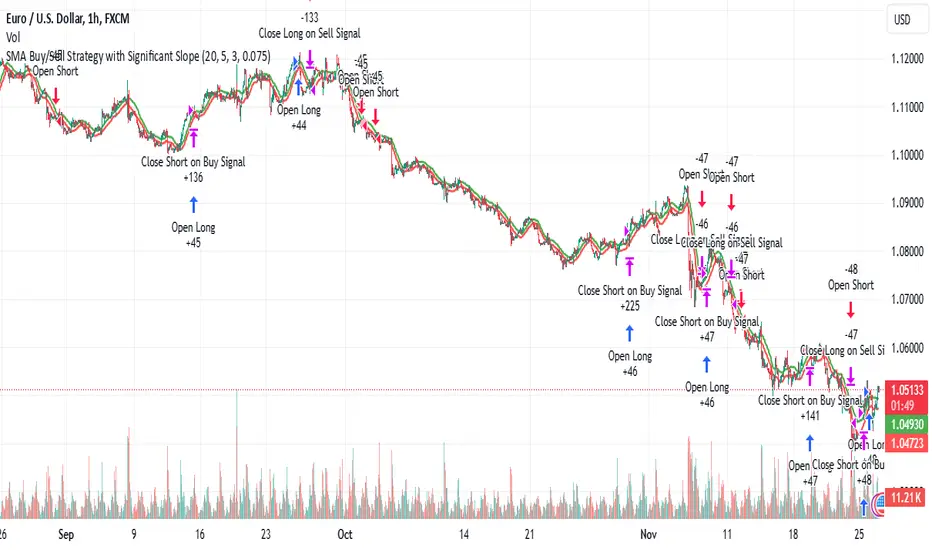
SMA Buy/Sell Strategy with Significant Slope and Dynamic TP/SLDescription:
This strategy uses a simple moving average (SMA) to detect trading opportunities based on the slope and proximity of price action. It ensures trades are only executed during significant trends, reducing false signals caused by sideways movements. The strategy incorporates dynamic risk management with an initial ambitious Take Profit (TP) and a Trailing Stop Loss (SL) to protect profits.
Key Features:
Trend Detection with SMA:
Two SMAs are calculated: one on High values and one on Low values.
Signals are generated when the price crosses these SMAs, ensuring:
Buy: Price closes above the SMA on High, with a significant upward slope.
Sell: Price closes below the SMA on Low, with a significant downward slope.
Slope Significance Check:
The slope of the SMA is calculated over a configurable period.
Only trends with a slope variation exceeding a user-defined percentage threshold are considered significant.
Dynamic Risk Management:
Ambitious Initial TP: Positions target a high percentage gain upon entry.
Trailing SL: Automatically adjusts as the price moves in favor of the trade, locking in profits.
Automatic Position Management:
Opposing signals close existing positions to avoid conflicting trades.
Configurable position size for risk control.
Parameters:
SMA Period: Number of candles for calculating the SMA.
Initial Take Profit (%): Percentage gain for the initial TP.
Trailing Stop Loss (%): Percentage for trailing SL based on the current price.
Slope Threshold (%): Minimum percentage change in SMA slope to confirm trend significance.
How It Works:
Buy Signal:
The price closes above the SMA on High values.
The slope of the SMA (on High) is positive and exceeds the slope threshold.
Sell Signal:
The price closes below the SMA on Low values.
The slope of the SMA (on Low) is negative and exceeds the slope threshold.
Exits:
A position closes at the Take Profit level, Trailing Stop Loss, or when an opposing signal is generated.
Use Case:
This strategy is ideal for trending markets where price action respects moving averages. It can be used on any timeframe or asset but is particularly effective in markets with clear directional movements.
Recommended Settings:
Timeframe: Works well on higher timeframes (e.g., 1H, 4H, Daily).
Slope Threshold (%): Default is 5%, adjust based on market volatility.
Initial TP and Trailing SL: Tailor to your risk/reward preferences.
By utilizing this strategy, traders can capitalize on significant market trends while dynamically managing risk. Test it on historical data to optimize the parameters for your preferred market!
Price - TP/SLPrices
With this library, you can easily manage prices such as stop loss, take profit, calculate differences, prices from a lower timeframe, and get the order size and commission from the strategy properties tab.
Note that the order size and commission only work with strategies!
Usage
Take Profit & Stop Loss
var bool open_trade = false
open_trade := strategy.position_size != 0
bars_since_opened = strategy.opentrades > 0 ? bar_index - strategy.opentrades.entry_bar_index(strategy.opentrades - 1) + 1 : 0
// ############################################################
// # TAKE PROFIT
// ############################################################
take_profit = input.string(title='Take Profit', defval='OFF', options= , group='TAKE PROFIT')
take_profit_percentage = input.float(title='Take Profit (% or X)', defval=0, minval=0, step=0.1, group='TAKE PROFIT')
take_profit_bars = input.int(title='Take Profit Bars', defval=0, minval=0, step=1, group='TAKE PROFIT')
take_profit_indication = input.string(title='Take Profit Plot', defval='OFF', options= , group='TAKE PROFIT')
take_profit_color = input.color(title='Take Profit Color', defval=#26A69A, group='TAKE PROFIT')
take_profit_price = math.round_to_mintick(strategy.position_avg_price)
take_profit_plot = plot(take_profit == 'ON' and take_profit_indication == 'ON' and open_trade and bars_since_opened >= take_profit_bars and take_profit_percentage > 0 and nz(take_profit_price) ? take_profit_price : na, color=take_profit_color, style=plot.style_linebr, linewidth=1, title='TP', offset=0)
// ############################################################
// # STOP LOSS
// ############################################################
stop_loss = input.string(title='Stop Loss', defval='OFF', options= , group='STOP LOSS')
stop_loss_percentage = input.float(title='Stop Loss (% or X)', defval=0, minval=0, step=0.1, group='STOP LOSS')
stop_loss_bars = input.int(title='Stop Loss Bars', defval=0, minval=0, step=1, group='STOP LOSS')
stop_loss_indication = input.string(title='Stop Loss Plot', defval='OFF', options= , group='STOP LOSS')
stop_loss_color = input.color(title='Stop Loss Color', defval=#FF5252, group='STOP LOSS')
stop_loss_price = math.round_to_mintick(strategy.position_avg_price)
stop_loss_plot = plot(stop_loss == 'ON' and stop_loss_indication == 'ON' and open_trade and bars_since_opened >= stop_loss_bars and stop_loss_percentage > 0 and nz(stop_loss_price) ? stop_loss_price : na, color=stop_loss_color, style=plot.style_linebr, linewidth=1, title='SL', offset=0)
// ############################################################
// # STRATEGY
// ############################################################
var limit_price = 0.0
var stop_price = 0.0
limit_price := take_profit == 'ON' ? price.take_profit_price(take_profit_price, take_profit_percentage, take_profit_bars, bars_since_opened) : na
stop_price := stop_loss == 'ON' ? price.stop_loss_price(stop_loss_price, stop_loss_percentage, stop_loss_bars, bars_since_opened) : na
strategy.exit(id='TP/SL', comment='TP/SL', from_entry='LONG', limit=limit_price, stop=stop_price)
Calculate difference between 2 prices:
price.difference(close, close )
Get last price from lower timeframe:
price.ltf(request.security_lower_tf(ticker, '1', close))
Get the order size from the properties tab:
price.order_size()
Get the commission from the properties tab.
price.commission()
X48 - Strategy | ADAPTIVE CONSECUTIVE + TP/SL | V.1Thanks For Tradingview Built-in Script :: << Original From Consecutive Strategy Built-in Script >>
================== Read This First Before Use This Strategy ==============
Please be aware that this strategy is not a guarantee of success and may lead to losses.
Trading involves risk and you should always do your own research before making any decisions.
This Strategy Just an Idea For Help Your Decision For Open Position.
You Must Be Search and Make Your Self Understand What You Doing In This Strategy.
Example :: This Strategy and Indicator Find The Consecutive Bars And You, You Are Reading Must Be Decision Up to You !!
For Backtest Show It's That For a Newbie 100$ Portfolio and 16.333$ Per Order Size
>>>> Read Me First !! <<<<<
========== Detailed and meaningful description =========
How It's Work : This Strategy are Following Green or Red Candle :: example 3 Green Candle To OpenLong Position
Can Set TP/SL if you want :: Just Fine The Best Value of Asset as you want
Fast Trend = MA FAST LINE
SLOW Trend = MA SLOW LINE
MID-TERM TREND = MA MID-TERM
LONG-TERM TREND = MA LONG-TERM
=========== Condition And Statement ===========
Long Condition Statement :: Candles Consecutive Bars Up and close > golden_line and fast_line > golden_line
Short Condition Statement :: Candles Consecutive Bars Down and close < golden_line and fast_line < golden_line
AutoCloseLong Condition :: Candles ConsecutiveBarsDownStop and close > golden_line and close < death_line and close < death_line and close < death_line or fastUpdeath
AutoCloseShort Condition :: Candles ConsecutiveBarsUpStop and close < golden_line and close > death_line and close > death_line and close > death_line or fastUpdeath
====== For ADAPTIVE you can customize your ALL MA For Your Statement
/////////For Example Hook Alert Command ////////////
Just Easy Command >> :: {{strategy.order.alert_message}}
Or Other Json You Should Edit Command Like This Example
{"ex":"'bnfuture'","side": "AutoLong", "$16.333", "symbol": "{{ticker}}", "passphrase": "1234","leverage":"10", "tp" : "5", "sl" : "2", "tl" : "2", "callback" : "1"}
{"ex":"'bnfuture'","side": "AutoShort", "$16.333", "symbol": "{{ticker}}", "passphrase": "1234","leverage":"10", "tp" : "5", "sl" : "2", "tl" : "2", "callback" : "1"}

Squeeze Momentum Strategy [LazyBear] Buy Sell TP SL Alerts-Modified version of Squeeze Momentum Indicator by @LazyBear.
-Converted to version 5,
-Taken inspiration from @KivancOzbilgic for its buy sell calculations,
-Used @Bunghole strategy template with Take Profit, Stop Loss and Enable/Disable Toggles
-Added Custom Date Backtesting Module
------------------------------------------------------------------------------------------------------------------------
All credit goes to above
Problem with original version:
The original Squeeze Momentum Strategy did not have buy sell signals and there was alot of confusion as to when to enter and exit.
There was no proper strategy that would allow backtesting on which further analysis could be carried out.
There are 3 aspects this strategy:
1 ) Strategy Logic (easily toggleable from the dropdown menu from strategy settings)
- LazyBear (I have made this simple by using Kivanc technique of Momentums Moving Average Crossover, BUY when MA cross above signal line, SELL when crossdown signal line)
- Zero Crossover Line (BUY signal when crossover zero line, and SELL crossdown zero line)
2) Long Short TP and SL
- In strategies there is usually only 1 SL and 1 TP, and it is assumed that if a 2% SL giving a good profit %, then it would be best for both long and short. However this is not the case for many. Many markets/pairs, go down with much more speed then they go up with. Hence once we have a profitable backtesting setting, then we should start optimizing Long and Short SL's seperately. Once that is done, we should start optimizing for Long and Short TP's separately, starting with Longs first in both cases.
3) Enable and Disable Toggles of Long and Short Trades
- Many markets dont allow short trades, or are not suitable for short trades. In this case it would be much more feasible to disable "Short" Trading and see results of Long Only as a built in graphic view of backtestor provides a more easy to understand data feed as compared to the performance summary in which you have to review long and short profitability separately.
4) Custom Data Backtesting
- One of most crucial aspects while optimizing for backtesting is to check a strategies performance on uptrends, downtrend and sideways markets seperately as to understand the weak points of strategy.
- Once you enable custom date backtesting, you will see lines on the chart which can be dragged left right based on where you want to start and end the backtesting from and to.
Note:
- Not a financial advise
- Open to feedback, questions, improvements, errors etc.
- More info on how the squeeze momentum works visit LazyBear indicator link:
Happy Trading!
Cheers
M Tahreem Alam @mtahreemalam

Mean Reversion — BB + Z-Score + RSI + EMA200 (TP at Opposite Z)This is a systematic mean-reversion framework for index futures and other liquid assets.
This strategy combines Bollinger Bands, Z-Score dislocation, RSI extremes, and a trend-filtering EMA200 to capture short-term mean-reversion inefficiencies in NQ1!. It is designed for high-volatility conditions and uses a precise exit model based on opposite-side Z-Score targets and dynamic mid-band failure detection.
🔍 Entry Logic (Mean Reversion) :
The strategy enters trades only when multiple confluence signals align:
Long Setup
Price at or below the lower Bollinger Band
Z-Score ≤ –Threshold (deep statistical deviation)
RSI ≤ oversold level
Price below the EMA-200 (countertrend mean-reversion only)
Cooldown must be completed
No open position
Short Setup
Price at or above the upper Bollinger Band
Z-Score ≥ Threshold
RSI ≥ overbought level
Price above the EMA-200
Cooldown complete
No open position
This multi-signal gate filters out weak reversions and focuses on mature dislocations.
🎯 Take-Profit Model: Opposite-Side Z-Score Target :
Once in a trade, take-profit is set by solving for the price where the Z-Score reaches the opposite side:
Long TP = Z = +Threshold
Short TP = Z = –Threshold
This creates a symmetric statistical exit based on reverting to equilibrium plus overshoot.
🛡️ Stop-Loss System (Volatility-Aware) :
Stop losses combine:
A fixed base stop (points)
A standard-deviation volatility component
This adapts the SL to regime changes and avoids being shaken out during rare volatility spikes.
⏳ Half-Life Exit :
If a trade has not reverted within a fixed number of bars, it automatically closes.
This prevents “mean-reversion traps” during trending periods.
📉 Advanced Mid-Band Exit Logic (BB Basis Failure) :
This is the unique feature of the system.
After entry:
Wait for price to cross the Bollinger Basis (middle band) in the direction of the mean.
Start a 5-bar delay timer.
After 5 bars, the strategy becomes “armed.”
Once armed:
If price fails back through the mean, exit immediately.
Intrabar exits trigger precisely (with tick-level precision if Bar Magnifier is enabled).
This protects profits and exits trades at the first sign of mean-failure.
⏱️ Cooldown System :
After each closed trade, a cooldown period prevents immediate re-entry.
This avoids clustering and improves statistical independence of trades.
🖥️ What This Strategy Is Best For :
High-volatility intraday NQ conditions
Statistical mean reversion with structured confluence
Traders who want clean, rule-based entries
Avoiding trend-day traps using EMA and half-life logic
📊 Included Visual Elements :
Bollinger Bands (Upper, Basis, Lower)
BUY/SELL markers at signal generation
Optional alerts for automated monitoring
🚀 Summary :
This is a precision mean-reversion system built around volatility bands, statistical dislocation, and price-behavior confirmation. By combining Z-Score, RSI, EMA200 filtering, and a sophisticated mid-band failure exit, this model captures high-probability reversions while avoiding the common pitfalls of naive band-touch systems.

SCALPING PRO V2 - INTERMÉDIANT (Dashboard + TP/SL + Alerts)//@version=5
indicator("SCALPING PRO V2 - INTERMÉDIANT (Dashboard + TP/SL + Alerts)", overlay=true, max_labels_count=500)
// ---------------- INPUTS ----------------
emaFastLen = input.int(9, "EMA Fast")
emaSlowLen = input.int(21, "EMA Slow")
atrLen = input.int(14, "ATR Length")
atrMultSL = input.float(1.2, "SL = ATR *")
tp1mult = input.float(1.0, "TP1 = ATR *")
tp2mult = input.float(1.5, "TP2 = ATR *")
tp3mult = input.float(2.0, "TP3 = ATR *")
minBars = input.int(3, "Min bars between signals")
showDashboard = input.bool(true, "Show Dashboard")
// ---------------- INDICATORS ----------------
emaFast = ta.ema(close, emaFastLen)
emaSlow = ta.ema(close, emaSlowLen)
atr = ta.atr(atrLen)
bullTrend = emaFast > emaSlow
bearTrend = emaFast < emaSlow
crossUp = ta.crossover(emaFast, emaSlow) and bullTrend
crossDown = ta.crossunder(emaFast, emaSlow) and bearTrend
var int lastSignal = na
okSignal = na(lastSignal) or (bar_index - lastSignal > minBars)
buySignal = crossUp and okSignal
sellSignal = crossDown and okSignal
if buySignal or sellSignal
lastSignal := bar_index
// ---------------- TP & SL ----------------
var float sl = na
var float tp1 = na
var float tp2 = na
var float tp3 = na
if buySignal
sl := close - atr * atrMultSL
tp1 := close + atr * tp1mult
tp2 := close + atr * tp2mult
tp3 := close + atr * tp3mult
if sellSignal
sl := close + atr * atrMultSL
tp1 := close - atr * tp1mult
tp2 := close - atr * tp2mult
tp3 := close - atr * tp3mult
// ---------------- ALERTS ----------------
alertcondition(buySignal, title="BUY", message="BUY Signal")
alertcondition(sellSignal, title="SELL", message="SELL Signal")
alertcondition(ta.cross(close, tp1), title="TP1", message="TP1 Hit")
alertcondition(ta.cross(close, tp2), title="TP2", message="TP2 Hit")
alertcondition(ta.cross(close, tp3), title="TP3", message="TP3 Hit")
alertcondition(ta.cross(close, sl), title="SL", message="Stop Loss Hit")
// ---------------- DASHBOARD ----------------
if showDashboard
var table dash = table.new(position.top_right, 1, 5)
if barstate.islast
table.cell(dash, 0, 0, "SCALPING PRO V2", bgcolor=color.new(color.black, 0), text_color=color.white)
table.cell(dash, 0, 1, "Trend: " + (bullTrend ? "Bull" : bearTrend ? "Bear" : "Neutral"))
table.cell(dash, 0, 2, "ATR: " + str.tostring(atr, format.mintick))
table.cell(dash, 0, 3, "Last Signal: " + (buySignal ? "BUY" : sellSignal ? "SELL" : "NONE"))
table.cell(dash, 0, 4, "EMA Fast/Slow OK")

Levels S/R Boxes + Gaps + SL/TPWhat It Does:
Automatically identifies and displays:
🟦 Support/Resistance zones (horizontal boxes)
🟨 Price gaps (unfilled gaps from market open/close)
🎯 Stop Loss levels (where to protect trades)
💰 Take Profit levels (where to exit trades)
Purpose: Shows you exactly where price is likely to bounce, reverse, or break through.
Best Practices:
✅ Trade at the boxes - Don't chase price
✅ Use SL/TP lines - Automatic risk management
✅ Wait for confirmation - Candle pattern + S/R level
✅ Gaps get filled - Trade towards yellow boxes
✅ Solid lines = stronger - Prefer 3+ touch levels
❌ Don't ignore SL - Always protect yourself
❌ Don't trade middle - Wait for S/R zones
❌ Don't fight strong levels - Respect solid boxes
Settings (Quick Reference):
S/R Strength: 10 (default) - Lower = more levels, Higher = fewer stronger levels
Max Levels: 5 (default) - Number of S/R boxes to show
Show Gaps: ON - Display yellow gap boxes
Show SL/TP: ON - Display entry/exit suggestions

Buy/Sell/SL/TP + MTF + Candle-close (v6)This indicator provides clean Buy/Sell signals with automatic Stop-Loss and Take-Profit levels, multi-timeframe filtering, and confirmed candle-close alerts to avoid false signals. SL/TP can be calculated using percentage or ATR.
It includes full alertconditions for Buy, Sell, SL hit, and TP hit, plus optional JSON webhook alerts for automation (WhatsApp, Telegram, bots, etc.).
Ideal for intraday and swing traders who want simple entries, clear risk management, and fast automated notifications.

UTS CORE + BOS + CHOCH – RR/TP/SL 📊 Indicator Working Principle
### 🔹 1. BOS (Break of Structure)
* **Definition:** Occurs when the price breaks the previous swing high or swing low level.
* **Interpretation:**
* If the last high is broken upwards → **Bullish BOS** (confirmation of uptrend).
* If the last low is broken downwards → **Bearish BOS** (confirmation of downtrend).
---
### 🔹 2. CHOCH (Change of Character)
* **Definition:** Indicates a trend reversal.
* **Interpretation:**
* In an uptrend, if the last low is broken downwards → **CHOCH↓** (start of downtrend).
* In a downtrend, if the last high is broken upwards → **CHOCH↑** (start of uptrend).
* **Chart:** Blue “CHOCH↑” labels on the chart mark trend reversals.
---
### 🔹 3. FVG (Fair Value Gap)
* **Definition:** A price gap formed between 3 candles.
* **Logic:**
* If the low of one candle stays above the high of the candle two bars back, a gap is created.
* Price tends to return to these gaps to “fill” them.
* **Chart:** The indicator highlights these gaps automatically (green/purple lines).
---
### 🔹 4. Signal Generation (BUY / SELL)
* A valid BOS or CHOCH confirmation + presence of FVG → **signal is triggered.**
* **Rules:**
* Upward break → **BUY signal**
* Downward break → **SELL signal**
* **Chart:** Red “SELL” and green “BUY” labels represent these trade signals.
---
### 🔹 5. RR – TP/SL Management
* When a trade is opened, the indicator automatically calculates **Entry, Stop Loss (SL), and Take Profits (TP1, TP2, TP3).**
* **Risk/Reward ratios:**
* TP1 = 1R
* TP2 = 2R
* TP3 = 3R
* If TP1 is hit and “Breakeven” option is enabled → SL moves to entry (risk-free trade).
---
👉 In short: this indicator tracks **market structure (BOS/CHOCH)**, detects **imbalances (FVG)**, and combines them with **risk/reward management (TP/SL)** to give you a ready-made trade

Golden Cross + Support/Resistance + SL/TP + SignalsGolden Cross + Support/Resistance + SL/TP + Signals
Golden Cross + Support/Resistance + SL/TP + Signals

EMA 1/8 Cross - Fixed Pip TP/SLEMA 1/8 Cross – Fixed Pip TP/SL
This strategy is based on the crossover between EMA 8 and EMA 14 as trading signals:
Long entry → when EMA 1 crosses above EMA 8
Short entry → when EMA 1 crosses below EMA 8
Features:
Fixed pip Take Profit (TP) and Stop Loss (SL), fully adjustable in the settings.
Customizable EMA Fast/Slow lengths for optimization.
Pip size input to match different broker definitions (e.g., XAUUSD often uses 0.10 as one pip).
Suitable for testing scalping or swing trading across multiple timeframes.
⚠️ Disclaimer:
This script is intended for backtesting and educational purposes only. Please optimize parameters and apply proper risk management before using it on live accounts.

ORB 5M + VWAP + Braid Filter + TP 2R o Niveles PreviosORB 5-Minute Breakout Strategy Summary
Strategy Name:
ORB 5M + VWAP + Braid Filter + TP 2R or Previous Levels
Timeframe:
5-minute chart
Trading Window:
9:35 AM to 11:00 AM (New York time)
✅ Entry Conditions:
Opening Range: Defined from 9:30 to 9:35 AM (first 5-minute candle).
Breakout Entry:
Long trade: Price breaks above the opening range high.
Short trade: Price breaks below the opening range low.
Confirmation Filters (All must be met):
Strong candle (green for long, red for short).
VWAP in the direction of the trade.
Braid Filter by Mango2Juice supports the breakout direction (green for long, red for short).
📉 Stop Loss:
Placed at the opposite side of the opening range.
🎯 Take Profit (TP):
+2R (Risk-to-Reward Ratio of 2:1),
or
Closest of the following: previous day’s high/low or premarket levels.
⚙️ Additional Rules:
Only valid signals between 9:35 and 11:00 AM.
Only one trade per breakout direction per day.
Filter out "trap candles" (very small or indecisive candles).
Avoid trading after 11:00 AM.
📊 Performance Goals:
Maintain a high Profit Factor (above 3 ideally).
Focus on tickers with good historical performance under this strategy (e.g., AMZN, PLTR, CVNA).

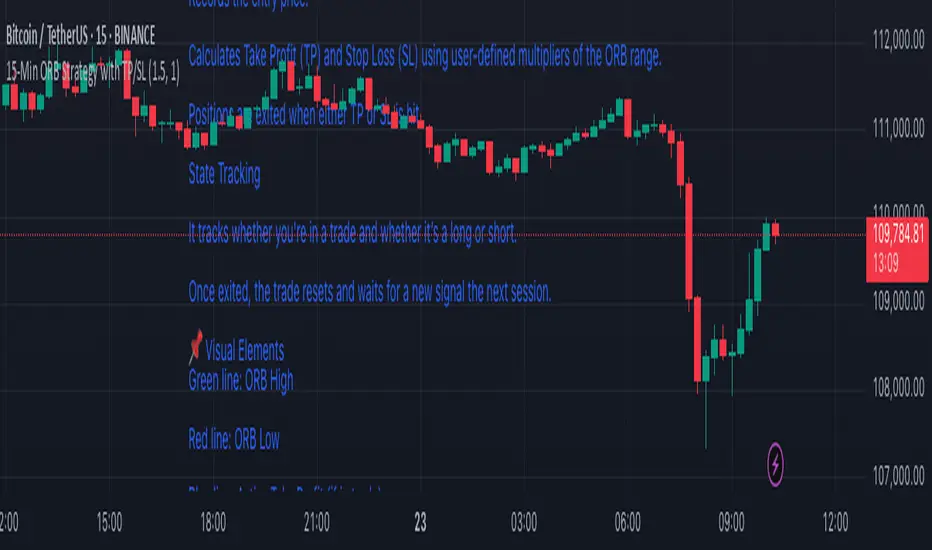
15-Min ORB Strategy with TP/SL
🔧 How It Works
Opening Range Defined
At market open, it tracks the first 15-minute candle.
The high and low of that candle form the Opening Range.
Breakout Detection
A Buy Signal is triggered when price closes above the ORB high (with confirmation).
A Sell Signal is triggered when price closes below the ORB low.
Trade Management
On a confirmed breakout, the script:
Records the entry price.
Calculates Take Profit (TP) and Stop Loss (SL) using user-defined multipliers of the ORB range.
Positions are exited when either TP or SL is hit.
State Tracking
It tracks whether you're in a trade and whether it’s a long or short.
Once exited, the trade resets and waits for a new signal the next session.
📌 Visual Elements
Green line: ORB High
Red line: ORB Low
Blue line: Active Take Profit (if in trade)
Orange line: Active Stop Loss (if in trade)
Buy/Sell Labels: Signal markers below/above candles for clear entry visibility
⚙️ Customizable Inputs
Take Profit Multiplier (default 1.5× ORB range)
Stop Loss Multiplier (default 1.0× ORB range)
Session Start/End time for ORB definition
✅ Ideal For:
Traders who want clean, rule-based signals with no indicators
Quick intraday setups using price action only
Adaptation to almost any liquid market (just adjust session times)
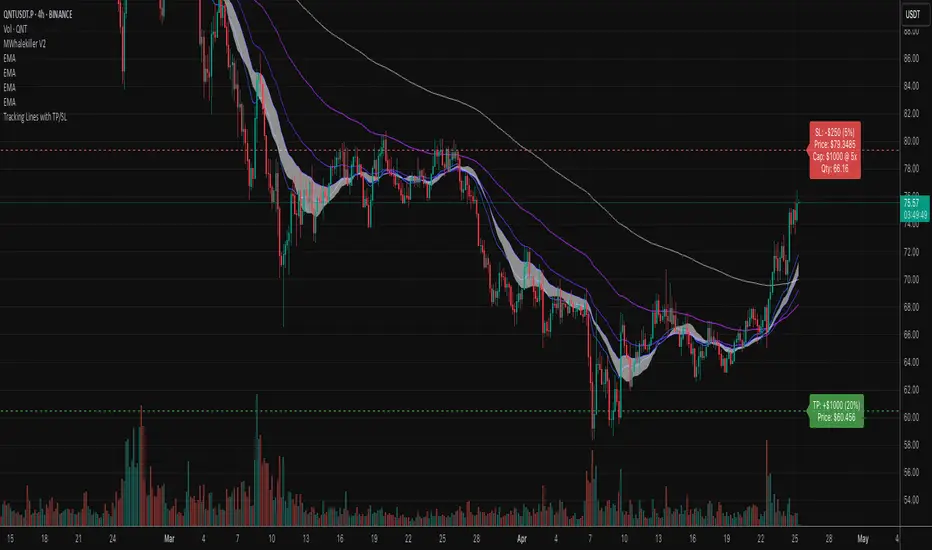
Tracking Lines with TP/SL + Labels at LeftA simple indicator so you can set your TP and SL tolerance along with capital and leverage.
A red line and green line will represent where current TP and SL would be on the chart along with the number of tokens you need to trade to meet the USD capital to be trades.
Just gives a visual representation of SL to key zones on the chart so you can judge scalp entries a little better :)
Scalping 15min: EMA + MACD + RSI + ATR-based SL/TP📈 Strategy: 15-Minute Scalping — EMA + MACD + RSI + ATR-based SL/TP
This scalping strategy is designed for 15-minute charts and combines trend-following and momentum confirmation with dynamic stop loss and take profit levels based on volatility.
🔧 Indicators Used:
EMA 50 — identifies the main trend
MACD Histogram — confirms momentum direction
RSI (14) — filters overbought/oversold conditions
ATR (14) — dynamically sets SL and TP based on market volatility
📊 Entry Conditions:
Long Entry:
Price is above EMA 50
MACD histogram is positive
RSI is above 50 but below 70
Short Entry:
Price is below EMA 50
MACD histogram is negative
RSI is below 50 but above 30
🛑 Risk Management:
Stop Loss: 1×ATR (user-configurable)
Take Profit: 2×ATR (user-configurable)
These values can be adjusted in the script inputs depending on your risk/reward preference or market conditions.
⚠️ Notes:
Strategy is optimized for scalping fast-moving pairs (e.g. crypto, forex).
Works best in trending markets.
Use backtesting and forward testing before live trading.

BTCUSD with adjustable sl,tpThis strategy is designed for swing traders who want to enter long positions on pullbacks after a short-term trend shift, while also allowing immediate short entries when conditions favor downside movement. It combines SMA crossovers, a fixed-percentage retracement entry, and adjustable risk management parameters for optimal trade execution.
Key Features:
✅ Trend Confirmation with SMA Crossover
The 10-period SMA crossing above the 25-period SMA signals a bullish trend shift.
The 10-period SMA crossing below the 25-period SMA signals a bearish trend shift.
Short trades are only taken if the price is below the 150 EMA, ensuring alignment with the broader trend.
📉 Long Pullback Entry Using Fixed Percentage Retracement
Instead of entering immediately on the SMA crossover, the strategy waits for a retracement before going long.
The pullback entry is defined as a percentage retracement from the recent high, allowing for an optimized entry price.
The retracement percentage is fully adjustable in the settings (default: 1%).
A dynamic support level is plotted on the chart to visualize the pullback entry zone.
📊 Short Entry Rules
If the SMA(10) crosses below the SMA(25) and price is below the 150 EMA, a short trade is immediately entered.
Risk Management & Exit Strategy:
🚀 Take Profit (TP) – Fully customizable profit target in points. (Default: 1000 points)
🛑 Stop Loss (SL) – Adjustable stop loss level in points. (Default: 250 points)
🔄 Break-Even (BE) – When price moves in favor by a set number of points, the stop loss is moved to break-even.
📌 Extra Exit Condition for Longs:
If the SMA(10) crosses below SMA(25) while the price is still below the EMA150, the strategy force-exits the long position to avoid reversals.
How to Use This Strategy:
Enable the strategy on your TradingView chart (recommended for stocks, forex, or indices).
Customize the settings – Adjust TP, SL, BE, and pullback percentage for your risk tolerance.
Observe the plotted retracement levels – When the price touches and bounces off the level, a long trade is triggered.
Let the strategy manage the trade – Break-even protection and take-profit logic will automatically execute.
Ideal Market Conditions:
✅ Trending Markets – The strategy works best when price follows strong trends.
✅ Stocks, Indices, or Forex – Can be applied across multiple asset classes.
✅ Medium-Term Holding Period – Suitable for swing trades lasting days to weeks.

BuyTheDips Trade on Trend and Fixed TP/SL
This strategy is designed to trade in the direction of the trend using exponential moving average (EMA) crossovers as signals while employing fixed percentages for take profit (TP) and stop loss (SL) to manage risk and reward. It is suitable for both scalping and swing trading on any timeframe, with its default settings optimized for short-term price movements.
How It Works
EMA Crossovers:
The strategy uses two EMAs: a fast EMA (shorter period) and a slow EMA (longer period).
A buy signal is triggered when the fast EMA crosses above the slow EMA, indicating a potential bullish trend.
A sell signal is triggered when the fast EMA crosses below the slow EMA, signaling a bearish trend.
Trend Filtering:
To improve signal reliability, the strategy only takes trades in the direction of the overall trend:
Long trades are executed only when the fast EMA is above the slow EMA (bullish trend).
Short trades are executed only when the fast EMA is below the slow EMA (bearish trend).
This filtering ensures trades are aligned with the prevailing market direction, reducing false signals.
Risk Management (Fixed TP/SL):
The strategy uses fixed percentages for take profit and stop loss:
Take Profit: A percentage above the entry price for long trades (or below for short trades).
Stop Loss: A percentage below the entry price for long trades (or above for short trades).
These percentages can be customized to balance risk and reward according to your trading style.
For example:
If the take profit is set to 2% and the stop loss to 1%, the strategy operates with a 2:1 risk-reward ratio. BINANCE:BTCUSDT

VAWSI and Trend Persistance Reversal Strategy SL/TPThis is a completely revamped version of my "RSI and ATR Trend Reversal Strategy."
What's New?
The RSI has been replaced with an original indicator of mine, the "VAWSI," as I've elected to call it.
The standard RSI measures a change in an RMA to determine the strength of a movement.
The VAWSI performs very similarly, except it uses another original indicator of mine, the VAWMA.
VAWMA stands for "Volume (and) ATR Weight Moving Average." It takes an average of the volume and ATR and uses the ratio of each bar to weigh a moving average of the source.
It has the same formula as an RSI, but uses the VAWMA instead of an RMA.
Next we have the Trend Persistence indicator, which is an index on how long a trend has been persisting for. It is another original indicator. It takes the max deviation the source has from lowest/highest of a specified length. It then takes a cumulative measure of that amount, measures the change, then creates a strength index with that amount.
The VAWSI is a measure of an emerging trend, and the Trend Persistence indicator is a measure of how long a trend has persisted.
Finally, the 3rd main indicator, is a slight variation of an ATR. Rather than taking the max of source - low or high- source and source - source , it instead takes the max of high-low and the absolute value of source - the previous source. It then takes the absolute value of the change of this, and normalizes it with the source.
Inputs
Minimum SL/TP ensures that the Stop Loss and Take Profit still exist in untrendy markets. This is the minimum Amount that will always be applied.
VAWSI Weight is a divided by 100 multiplier for the VAWSI. So value of 200 means it is multiplied by 2. Think of it like a percentage.
Trend Persistence weight and ATR Weight are applied the same. Higher the number, the more impactful on the final calculation it is.
Combination Mult is an outright multiplier to the final calculation. So a 2.0 = * 2.0
Trend Persistence Smoothing Length is the length of the weighted moving average applied to the Trend Persistence Strength index.
Length Cycle Decimal is a replacement of length for the script.
Here we used BlackCat1402's Dynamic Length Calculation, which can be found on his page. With his permission we have implemented it into this script. Big shout out to them for not only creating, but allowing us to use it here.
The Length Cycle Decimal is used to calculate the dynamic length. Because TradingView only allows series int for their built-in library, a lot of the baseline indicators we use have to be manually recreated as functions in the following section.
The Strategy
As usual, we use Heiken Ashi values for calculations.
We begin by establishing the minimum SL/TP for use later.
Next we determine the amount of bars back since the last crossup or crossdown of our threshold line.
We then perform some normalization of our multipliers. We want a larger trend or larger VAWSI amount to narrow the threshold, so we have 1 divide them. This way, a higher reading outputs a smaller number and vice versa. We do this for both Trend Persistence, and the VAWSI.
The VAWSI we also normalize, where rather than it being a 0-100 reading of trend direction and strength, we absolute it so that as long as a trend is strong, regardless of direction, it will have a higher reading. With these normalized values, we add them together and simply subtract the ATR measurement rather than having 1 divide it.
Here you can see how the different measurements add up. A lower final number suggests imminent reversal, and a higher final number suggests an untrendy or choppy market.
ATR is in orange, the Trend Persistence is blue, the VAWSI is purple, and the final amount is green.
We take this final number and depending on the current trend direction, we multiply it by either the Highest or Lowest source since the last crossup or crossdown. We then take the highest or lowest of this calculation, and have it be our Stop Loss or Take Profit. This number cannot be higher/lower than the previous source to ensure a rapid spike doesn't immediately close your position on a still continuing trend. As well, the threshold cannot be higher/ lower than the the specified Stop Loss and Take Profit
Only after the source has fully crossed these lines do we consider it a crossup or crossdown. We confirm this with a barstate.isconfirmed to prevent repainting. Next, each time there is a crossup or crossdown we enter a long or a short respectively and plot accordingly.
I have the strategy configured to "process on order close" to ensure an accurate backtesting result. You could also set this to false and add a 1 bar delay to the "if crossup" and "if crossdown" lines under strategy so that it is calculated based on the open of the next bar.
Final Notes
The amounts have been preconfigured for performance on RIOT 5 Minute timeframe. Other timeframes are viable as well. With a few changes to the parameters, this strategy has backtested well on NVDA, AAPL, TSLA, and AMD. I recommend before altering settings to try other timeframes first.
This script does not seem to perform nearly as well in typically untrendy and choppy markets such as crypto and forex. With some setting changes, I have seen okay results with crypto, but overfitting could be the cause there.
Thank you very much, and please enjoy.

SL and TP - ATRThis indicator is using ATR ( Average True Range ) to set the Target point and Stop loss.
Use the pink number as target, always.
If you are in Long position, use the green number as stop loss, so the red number is not useful in Buys.
If you are in Short position, use the Red number as stop loss, so the green number is not useful in Sells.
** Need to enter the numbers in ticks --> VERY IMPORTANT: Write it completely, even the numbers after the point sign but DO NOT WRITE the point sign itself. e.g. : if the target tick on indicator is 123.75, you have to write 12375 ticks for your TP. ( one more example: If the number is 0.0001203 , write 1203 ticks. )
Enter the information of the opening candle.
Most of the times, risk/reward ratio is a bit higher than 1.
Works on multi timeframes. P.S: Haven't checked the weekly timeframe.
Not trying to oversell the indicator, but this is perhaps the best TP/SL specifier.
For beauty purposes, change (Sl @ buy) and (TP @ sell) to histograms.
Histograms are only for visual purposes. Customize the indicator as you want :)) Hope you enjoy