Reversal WaveThis is the type of quantitative system that can get you hated on investment forums, now that the Random Walk Theory is back in fashion. The strategy has simple price action rules, zero over-optimization, and is validated by a historical record of nearly a century on both Gold and the S&P 500 index.
Recommended Markets
SPX (Weekly, Monthly)
SPY (Monthly)
Tesla (Weekly)
XAUUSD (Weekly, Monthly)
NVDA (Weekly, Monthly)
Meta (Weekly, Monthly)
GOOG (Weekly, Monthly)
MSFT (Weekly, Monthly)
AAPL (Weekly, Monthly)
System Rules and Parameters
Total capital: $10,000
We will use 10% of the total capital per trade
Commissions will be 0.1% per trade
Condition 1: Previous Bearish Candle (isPrevBearish) (the closing price was lower than the opening price).
Condition 2: Midpoint of the Body The script calculates the exact midpoint of the body of that previous bearish candle.
• Formula: (Previous Open + Previous Close) / 2.
Condition 3: 50% Recovery (longCondition) The current candle must be bullish (green) and, most importantly, its closing price must be above the midpoint calculated in the previous step.
Once these parameters are met, the system executes a long entry and calculates the exit parameters:
Stop Loss (SL): Placed at the low of the candle that generated the entry signal.
Take Profit (TP): Calculated by projecting the risk distance upward.
• Calculation: Entry Price + (Risk * 1).
Risk:Reward Ratio of 1:1.
About the Profit Factor
In my experience, TradingView calculates profits and losses based on the percentage of movement, which can cause returns to not match expectations. This doesn’t significantly affect trending systems, but it can impact systems with a high win rate and a well-defined risk-reward ratio. It only takes one large entry candle that triggers the SL to translate into a major drop in performance.
For example, you might see a system with a 60% win rate and a 1:1 risk-reward ratio generating losses, even though commissions are under control relative to the number of trades.
My recommendation is to manually calculate the performance of systems with a well-defined risk-reward ratio, assuming you will trade using a fixed amount per trade and limit losses to a fixed percentage.
Remember that, even if candles are larger or smaller in size, we can maintain a fixed loss percentage by using leverage (in cases of low volatility) or reducing the capital at risk (when volatility is high).
Implementing leverage or capital reduction based on volatility is something I haven’t been able to incorporate into the code, but it would undoubtedly improve the system’s performance dramatically, as it would fix a consistent loss percentage per trade, preventing losses from fluctuating with volatility swings.
For example, we can maintain a fixed loss percentage when volatility is low by using the following formula:
Leverage = % of SL you’re willing to risk / % volatility from entry point to exit or SL
And if volatility is high and exceeds the fixed percentage we want to expose per trade (if SL is hit), we could reduce the position size.
For example, imagine we only want to risk 15% per SL on Tesla, where volatility is high and would cause a 23.57% loss. In this case, we subtract 23.57% from 15% (the loss percentage we’re willing to accept per trade), then subtract the result from our usual position size.
23.57% - 15% = 8.57%
Suppose I use $200 per trade.
To calculate 8.57% of $200, simply multiply 200 by 8.57/100. This simple calculation shows that 8.57% equals about $17.14 of the $200. Then subtract that value from $200:
$200 - $17.14 = $182.86
In summary, if we reduced the position size to $182.86 (from the usual $200, where we’re willing to lose 15%), no matter whether Tesla moves up or down 23.57%, we would still only gain or lose 15% of the $200, thus respecting our risk management.
Final Notes
The code is extremely simple, and every step of its development is detailed within it.
If you liked this strategy, which complements very well with others I’ve already published, stay tuned. Best regards.
Buscar en scripts para "tp"

Profitable Pair Correlation Divergence Scanner v6This strategy identifies divergence opportunities between two correlated assets using a combination of Z-Score spread analysis, trend confirmation, RSI & MACD momentum checks, correlation filters, and ATR-based stop-loss/take-profit management. It’s optimized for positive P&L and realistic trade execution.
Key Features:
Pair Divergence Detection:
Measures deviation between returns of two assets and identifies overbought/oversold spread conditions using Z-Score.
Trend Alignment:
Trades only in the direction of the primary asset’s trend using a fast EMA vs slow EMA filter.
Momentum Confirmation:
Confirms trades with RSI and MACD to reduce false signals.
Correlation Filter:
Ensures the pair is strongly correlated before taking trades, avoiding noisy signals.
Risk Management:
Dynamic ATR-based stop-loss and take-profit ensures proper reward-to-risk ratio.
Exit Conditions:
Automatically closes positions when Z-Score normalizes, or ATR-based exits are hit.
How It Works:
Calculate Returns:
Computes returns for both assets over the selected timeframe.
Z-Score Spread:
Calculates the spread between returns and normalizes it using moving average and standard deviation.
Trend Filter:
Only takes long trades if the fast EMA is above the slow EMA, and short trades if the fast EMA is below the slow EMA.
Momentum Confirmation:
Confirms trade direction with RSI (>50 for longs, <50 for shorts) and MACD alignment.
Correlation Check:
Ensures the pair’s recent correlation is strong enough to validate divergence signals.
Trade Execution:
Opens positions when Z-Score crosses thresholds and all conditions align. Positions close when Z-Score normalizes or ATR-based SL/TP is hit.
Plot Explanation:
Z-Score: Blue line shows divergence magnitude.
Entry Levels: Red/Green lines mark long/short thresholds.
Exit Zone: Gray lines show normalization zone.
EMA Trend Lines: Purple (fast), Orange (slow) for trend alignment.
Correlation: Teal overlay shows current correlation strength.
Usage Tips:
Use highly correlated pairs for best results (e.g., EURUSD/GBPUSD).
Run on higher timeframe charts (1h or 4h) to reduce noise.
Adjust ATR multiplier based on volatility to avoid premature stops.
Combine with alerts for automated notifications or webhook execution.
Conclusion:
The Profitable Pair Correlation Divergence Scanner v6 is designed for traders who want systematic, low-risk, positive P&L trading opportunities with minimal manual monitoring. By combining trend alignment, momentum confirmation, correlation filters, and dynamic exits, it reduces false signals and improves execution reliability.
Run it on TradingView and watch how it captures divergence opportunities while maintaining positive P&L across trades.

MeanReversion_tradeALERTOverview The Apex Reversal Predictor v2.5 is a specialized mean reversion strategy designed for scalping high-volatility assets like NQ (Nasdaq), ES (S&P 500), and Crypto. While most indicators chase breakouts, this system hunts for "Liquidity Sweeps"—moments where the market briefly breaks a key level to trap retail traders before snapping back to the true value (VWAP).
This is not just a signal indicator; it is a full Trade Manager that calculates your Entry, Stop Loss, and Take Profit levels automatically based on volatility (ATR).
The Logic: Why This Works Markets act like a rubber band. They can only stretch so far from their average price before snapping back. This script combines three layers of logic to identify these snap-back points:
The Stretch (Sigma Score): Measures how far price is from the VWAP relative to ATR. If the score > 2.0, the "rubber band" is overextended.
The Trap (Liquidity Sweep): Identifies Pivot Highs/Lows. It waits for price to break a pivot (luring in breakout traders) and then immediately reverse (trapping them).
The Exhaustion (RSI): Confirms that momentum is Overbought/Oversold to prevent trading against a strong trend.
Key Features
Dynamic Lines: Automatically draws Blue (Entry), Red (SL), and Green (TP) lines on the chart for active trades.
Smart Targets: Two modes for taking profit:
Mean Reversion: Targets the VWAP line (High Win Rate).
Fixed Ratio: Targets a specific Risk:Reward (e.g., 1:2).
Live Dashboard: Tracks Win Rate, Net Points, and the live "Stretch Score" in the bottom right corner.
Alert Ready: Formatted JSON alerts for easy integration with Discord or trading bots.
How & When to Use (User Guide)
1. Best Timeframes
5-Minute (5m): Best for NQ and volatile stocks (TSLA, NVDA). Filters out 1-minute noise but catches the intraday reversals.
15-Minute (15m): Best for Forex or slower-moving indices (ES).
2. The Setup Checklist Before taking a trade, look at the Dashboard in the bottom right:
Step 1: Check the "Stretch (Sigma)". Is it Orange or Red? This means price is extended and ripe for a reversal. If it's Green, the market is calm—be careful.
Step 2: Wait for the Signal.
"Apex BUY" (Green Label): Price swept a low and closed green.
"Apex SELL" (Red Label): Price swept a high and closed red.
Step 3: Execute. Enter at the close of the signal candle. Set your stop loss at the Red Line provided by the script.
3. Warning / When NOT to Use
Strong Trending Days: If the market is trending heavily (e.g., creating higher highs all day without looking back), do not fight the trend.
News Events: Avoid using this during CPI, FOMC, or NFP releases. The "rubber band" logic breaks during news because volatility expands indefinitely.

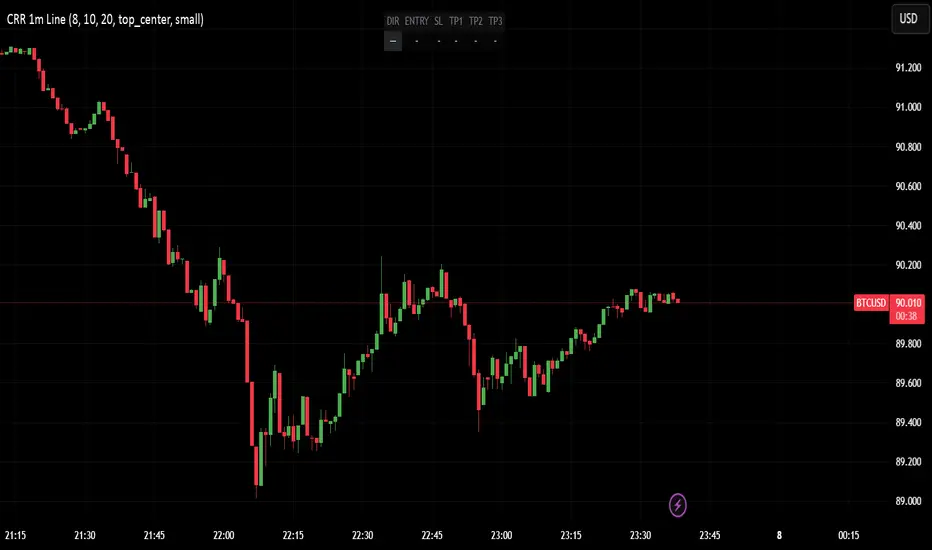
CRR - Entry SIN RETROUse in 1 minute:
EMA 15, 30, 200 → strong trend.
VWAP → institutional fair price.
RSI (8) → strength (Bull > 60, Bear < 40).
MACD → momentum direction.
Volume vs. average → ensure sufficient liquidity.
FVG (optional) → liquidity gap in your favor.
2️⃣ Signals WITHOUT PULLBACK
BUY WITHOUT PULLBACK when:
EMA15 > EMA30 > EMA200 (strong bullish trend)
MACD bullish, RSI > 60
High volume
Price above EMA15 and VWAP
(Optional) Bullish FVG in your favor
SELL WITHOUT PULLBACK when everything above is reversed (bearish).
Generate alerts:
CRR BUY 1m WITHOUT PULLBACK
CRR SELL 1m WITHOUT PULLBACK
3️⃣ Single-line HUD
When a signal appears, everything is automatically set up:
DIR: BUY / SELL / —
ENTRY: entry price
SL: 1× ATR
TP1, TP2, TP3: 1×, 2×, and 3× ATR
Everything is displayed in a compact HUD (configurable position).
🧠 In simple terms:
It's your engine for quick entries in 1M when the market is moving at full speed, without pullbacks, with everything filtered by trend, strength, volume, and FVG, and it provides you with the ENTRY–SL–TPs ready to go.
CRAZY RAY RAY - Dashboard 1-5-15-1D + SMC + Clock + Candles PRO OANDA:XAUUSD This script is essentially your institutional "nuclear power plant" for scalping and swing trading: it combines the 1-5-15-1D dashboard, SMC, PRO candles, money flow times, institutional filters, Bull/Bear 12C, Liquidity HUD, Fibo Move, and Target Trend with SL + 3 TPs into a single indicator. 1. Dashboard 1–5–15–1D (Central HUD)
Calculates across 4 timeframes: 1m, 5m, 15m, and 1D:
Trend with EMAs 15/30/200.
RSI (strength >50 buy, <50 sell).
MACD (crossover in favor or against).
For each timeframe it shows:
TREND → BULLISH / BEARISH / NEUTRAL.
ACTION → BUY / SELL / WAIT.
If all 4 timeframes align:
MODE = BULLISH BUY
MODE = BEARISH SELL
Filters and displays on the HUD if buys or sells are blocked by SMC context (BLOCKED BUY / BLOCKED SELL).
Also draws 2 simple moving averages on the chart:
SMA 20 white (you can use it as a micro-trend).
SMA 200 red (macro trend and institutional reference).
2. Real-Time Clock + Trading Hours
Calculates the real time for:
New York / Miami
London
Tokyo
using current time and real time zone.
Also calculates GMT time to know which session is dominant.
Marks your trading hours:
LONDON 3:00–5:30 (London time) → goodLondon
NY OPEN 8:30–10:00 (NY time) → goodNYOpen
ASIA 20:00–23:00 (Tokyo) → goodAsiaScalp
Displays a message on the HUD:
LONDON 3:00–5:30 (1–2 TRADES)
NY OPEN 8:30–10:00 (1 TRADE)
ASIA 20–23 (SCALP)
NO TRADE ROLL / DEAD / LATE
ONLY A+ SETUPS (when not in strong trading hours).
3. Institutional Power (volume + ATR + session)
Filter that evaluates whether the moment is institutional or retail:
Checks:
If you are in a strong trading session (London / NY). If the volume is above the average × multiplier.
If the ATR is above the average × multiplier.
If it passes the filters → INST ON, otherwise → RETAIL ZONE.
Used internally to block buys/sells and for the HUD.
4. Micro-signal “NO RETRACEMENT” on 1m (BUY SR / SELL SR)
On the 1-minute timeframe, it detects a very aggressive entry:
Clean trend (15/30/200 EMAs aligned).
Price crosses the 200 EMA.
MACD turns in favor.
Marks on the candle:
BUY SR (buys without retracement below the EMA200).
SELL SR (sales without retracement above the EMA200).
This state is also reflected in the HUD as the “SR” row.
5. SMC Block: HH/HL/LH/LL + BMS + ChoCH + Fibo + Zones
This is the SMC brain of the script:
Detects swings with pivots:
Paints HH, HL, LH, LL (if you activate showHHLL).
Marks BOS (break of structure).
Marks BMS and ChoCH (with strong or weak filter using ATR, volume, MACD, gaps).
Draws:
Internal Fibo of the last range (38–50–61).
Fibo entry zone 38–78% as a green discount/premium box.
Institutional mitigation zones (simple OB type green/red boxes).
Current range with dotted yellow lines.
Calculates logic for:
antiStupidBuy: blocks purchases when the context is very bearish (LL–LL–LH, bearish ChoCH, premium, EQH, etc.).
antiStupidSell: symmetrical for sales.
From this comes:
allowBuyInst
allowSellInst
buyBlockerOn / sellBlockerOn
buyTrapDetected (BUY SR signal but context blocks it → BUY TRAP).
All this feeds the HUD and institutional alerts.
6. PRO Candles (candlestick + smart color)
Candlestick pattern system:
Detects:
Hammer, Inverted Hammer. Doji.
Strong bullish/bearish candle.
Bullish/bearish engulfing.
Uses a trend EMA to determine if the pattern is with or against the trend.
Colors the candles according to the pattern (if you enable useColorCandles).
Defines texts:
patternText (pattern name).
biasText (reversal, momentum, indecision).
Updates the HUD with the current pattern (“CANDLE: Engulf Bull”, etc.).
7. Institutional PRO Combo + Reversals
Connects everything:
fullBuySetup:
allowBuyInst TRUE (SMC + Fibo + mitigation OK).
Institutional candles in favor (engulfing, hammer, etc.).
MultiTF aligned (1m, 5m in favor, 15/1D not strongly against).
Strong session (London or NY).
No blockages.
fullSellSetup: the same for sales.
Marks on the chart:
BUY PRO, SELL PRO.
BUY REV LL → reversal from a LL, at Fibo discount, with an institutional candle and above EMA200.
SELL REV HH → reversal from HH, at Fibo premium, with an institutional candle and below EMA200.
And generates alerts for all of this.
8. Dynamic Main HUD
On barstate.islast, updates the HUD:
Changes “BUY / SELL” to:
BUY BLOCK / SELL BLOCK when the context blocks that direction.
Writes:
Current candle pattern.
Time message.
Global status:
BUY TRAP ❌, BUY REV LL ✅, SELL REV HH ✅, BUY PRO ✅, SELL PRO ✅,
BUY BLOCK, SELL BLOCK, BUY/SELL OK.
9. Bull/Bear 12C HUD (Small right HUD)
12-confirmation bull/bear engine:
Calculates:
Sweep, 5th leg, mitigation, HL/LH, strong BOS.
Volume pattern (high-low-high).
ATR rising.
MACD crossover.
Liquidity.
Fear & Greed (SMA50).
Gap/imbalance. Bull/Bear 180 weak.
Count how many are ON:
bullScore /12
bearScore /12
Define a regime:
INSTITUTIONAL → many confirmations + rvol + ATR.
NORMAL
RETAIL
Show on right HUD:
List 1 to 12 with green/red dots BULL / BEAR.
Summary: “Regime: INSTITUTIONAL / NORMAL / RETAIL”.
10. Liquidity HUD XAU SCALP
Calculates RVOL, normalized ATR, spread vs ATR, current range vs average range.
Generates score and classifies:
LOW / MED / HIGH / INS.
Only moves up one level if you are in London/NY session (depending on sessions)

Options Scalper v2 - SPY/QQQHere's a comprehensive description of the Options Scalper v2 strategy:
---
## Options Scalper v2 - SPY/QQQ
### Overview
A multi-indicator confluence-based scalping strategy designed for trading SPY and QQQ options on short timeframes (1-5 minute charts). The strategy uses a scoring system to generate high-probability CALL and PUT signals by requiring alignment across multiple technical indicators before triggering entries.
---
### Core Logic
The strategy operates on a **scoring system (0-9 points)** where both bullish (CALL) and bearish (PUT) conditions are evaluated independently. A signal only fires when:
1. A recent EMA crossover occurred (within the last 3 bars)
2. The direction's score meets the minimum threshold (default: 4 points)
3. The signal's score is higher than the opposite direction
4. Enough bars have passed since the last signal (cooldown period)
5. Price action occurs during valid trading sessions
---
### Indicators Used
| Indicator | Purpose | CALL Condition | PUT Condition |
|-----------|---------|----------------|---------------|
| **9/21 EMA Cross** | Primary trigger | Fast EMA crosses above slow | Fast EMA crosses below slow |
| **200 EMA** | Trend filter | Price above 200 EMA | Price below 200 EMA |
| **RSI (14)** | Momentum filter | RSI between 45-65 | RSI between 35-55 |
| **VWAP** | Institutional level | Price above VWAP | Price below VWAP |
| **MACD (12,26,9)** | Momentum confirmation | MACD line > Signal line | MACD line < Signal line |
| **Stochastic (14,3)** | Overbought/Oversold | Oversold or K > D | Overbought or K < D |
| **Volume** | Participation confirmation | Spike on green candle | Spike on red candle |
| **Price Structure** | Breakout detection | Higher high formed | Lower low formed |
---
### Scoring Breakdown
**CALL Score (Max 9 points):**
- Recent EMA cross up: +2 pts
- EMA alignment (fast > slow): +1 pt
- RSI in bullish range: +1 pt
- Above VWAP: +1 pt
- MACD bullish: +1 pt
- Volume spike on green candle: +1 pt
- Stochastic setup: +1 pt
- Above 200 EMA: +1 pt
- Breaking higher high: +1 pt
**PUT Score (Max 9 points):**
- Recent EMA cross down: +2 pts
- EMA alignment (fast < slow): +1 pt
- RSI in bearish range: +1 pt
- Below VWAP: +1 pt
- MACD bearish: +1 pt
- Volume spike on red candle: +1 pt
- Stochastic setup: +1 pt
- Below 200 EMA: +1 pt
- Breaking lower low: +1 pt
---
### Risk Management
The strategy uses **ATR-based dynamic stops and targets**:
| Parameter | Default | Description |
|-----------|---------|-------------|
| Stop Loss | 1.5x ATR | Distance below entry for longs, above for shorts |
| Take Profit | 2.0x ATR | Creates a 1:1.33 risk-reward ratio |
Positions are also closed on:
- Opposite direction signal (flip trade)
- Take profit or stop loss hit
---
### Session Filtering
Trades are restricted to high-liquidity periods by default:
- **Morning Session:** 9:30 AM - 11:00 AM EST
- **Afternoon Session:** 2:30 PM - 3:55 PM EST
This avoids choppy midday price action and captures the highest volume periods.
---
### Input Parameters
| Parameter | Default | Description |
|-----------|---------|-------------|
| Fast EMA | 9 | Fast moving average period |
| Slow EMA | 21 | Slow moving average period |
| Trend EMA | 200 | Long-term trend filter |
| RSI Length | 14 | RSI calculation period |
| RSI Overbought | 65 | Upper RSI threshold |
| RSI Oversold | 35 | Lower RSI threshold |
| Volume Multiplier | 1.2x | Volume spike detection threshold |
| Min Signal Strength | 4 | Minimum score required to trigger |
| Crossover Lookback | 3 | Bars to consider crossover "recent" |
| Min Bars Between Signals | 5 | Cooldown period between signals |
---
### Visual Elements
**Chart Plots:**
- Green line: 9 EMA (fast)
- Red line: 21 EMA (slow)
- Gray line: 200 EMA (trend)
- Purple dots: VWAP
**Signal Markers:**
- Green triangle up + "CALL" label: Buy call signal
- Red triangle down + "PUT" label: Buy put signal
- Small circles: EMA crossover reference points
**Info Table (Top Right):**
- Real-time CALL and PUT scores
- RSI, MACD, Stochastic values
- VWAP and 200 EMA position
- Recent crossover status
- Current signal state
---
### Alerts
| Alert Name | Trigger |
|------------|---------|
| CALL Entry | Standard call signal fires |
| PUT Entry | Standard put signal fires |
| Strong CALL | Call signal with score ≥ 6 |
| Strong PUT | Put signal with score ≥ 6 |
---
### Recommended Usage
| Setting | 0DTE Scalping | Intraday Swings |
|---------|---------------|-----------------|
| Timeframe | 1-2 min | 5 min |
| Min Signal Strength | 5-6 | 4 |
| ATR Stop Mult | 1.0 | 1.5 |
| ATR TP Mult | 1.5 | 2.0 |
| Option Delta | 0.40-0.50 | 0.30-0.40 |
---
### Key Improvements Over v1
1. **Requires actual crossover** - Eliminates false signals from simple trend continuation
2. **Balanced scoring** - Both directions evaluated equally, highest score wins
3. **Signal cooldown** - Prevents overtrading with minimum bar spacing
4. **Multi-indicator confluence** - 8 factors must align for signal generation
5. **Volume-candle alignment** - Volume spikes only count when matching candle direction
---
### Disclaimer
This strategy is for educational purposes. Backtest thoroughly before live trading. Options trading involves significant risk of loss. Past performance does not guarantee future results.

Liquidity Sweep Indicator (Signal-based SL + BE/TP)I created a more advanced version of my Liquidity Sweep Indicator. Open source, but I dont recommend to create a TV-strategy from the code because you should combine it with price action an chart analysis! Have fun :)

SMC Pre-Trade Checklist (Mozzys)Here is a **clean, professional description** you can use when publishing your TradingView script.
It clearly explains what the indicator does and why traders use it—perfect for the public library.
---
# **📌 Script Description (for Publishing)**
**SMC Pre-Trade Checklist (Compact Edition)**
This indicator provides a **smart, compact on-chart checklist** designed for traders who use **Smart Money Concepts (SMC)**.
Instead of guessing or rushing entries, the checklist helps you confirm the essential SMC conditions *before* taking a trade.
The checklist displays as a **small 3-column panel** in the corner of your chart, making it easy to scan without covering price action.
All items are controlled through indicator settings, where you can tick each condition as you validate it in your analysis.
---
## **🔥 What This Tool Helps You Do**
This script helps you stay disciplined by verifying the core components of an SMC setup:
### **1. Higher-Timeframe (HTF) Bias**
* Market direction clarity
* Premium vs. discount zones
* HTF POIs and liquidity targets
### **2. Liquidity Conditions**
* Liquidity sweeps
* Liquidity-based take-profit targets
### **3. Market Structure**
* BOS/CHOCH confirmation
* Displacement
* Clean pullback into POI
### **4. Entry Validation**
* Quality POI
* LTF confirmation
* Logical SL/TP and RR
### **5. Risk Management**
* Correct position sizing
* Avoiding high-impact news
* Spread/volatility conditions
### **6. Trader Discipline**
* Trade matches your model
* No revenge or emotional trading
---
## **🎯 Why Traders Love This**
Most losses come from **breaking rules**, not market randomness.
This checklist forces consistency, clarity, and patience—especially in fast environments like FX, indices, and crypto.
* Prevents emotional entries
* Reduces impulsive trades
* Keeps you aligned with your SMC plan
* Works with any strategy or SMC style
* Clean, minimal, non-intrusive layout
---
## **📌 Features**
* Compact 3-column layout
* Customizable from the indicator settings
* Works on all timeframes and assets
* Zero chart clutter
* Perfect for rule-based traders
---
## **🚀 Who This Indicator Is For**
* SMC traders
* ICT-style traders
* Liquidity-based traders
* Anyone who wants more discipline & consistency
* Backtesters who want structured trade evaluation
--


EMA + Sessions + RSI Strategy v1.0A professional trading strategy that combines multiple technical indicators for high-probability entries. This system uses EMA crossovers, RSI zone filtering, and trend confirmation to identify optimal trading opportunities while managing risk with advanced position management tools.
Key Features:
✅ Dual Entry Signals (EMA21 + EMA100 crossover conditions)
✅ Trend Filter EMA750 (trade only with the major trend)
✅ Complete Risk Management (SL 1%, TP 3% default)
✅ Trailing Stop & Breakeven (maximize profits, protect capital)
✅ Compact Statistics Table (real-time performance metrics)
✅ RSI & Session Filters (avoid low-probability setups)
✅ Optional Pyramiding (scale into winning positions)
Perfect for swing trading and trend-following on any timeframe. Fully customizable to match your trading style.

Jon Secret SauceJon Secret Sauce — Advanced Trend + Momentum Entry Signals
A premium trade-timing engine that combines MA trend confirmation, volatility filters, RSI momentum, and smart volume validation to identify high-probability long & short entries on your preferred timeframe.
Includes auto-managed exits (TP / SL / technical breakdown), professional visuals, and alert notifications so you catch the move and protect profits — without overcrowding your chart.

Apex Trend & Liquidity Master with TP/SLThe Apex Trend & Liquidity Master is a systematic trading framework that identifies trend direction and key structural price levels for entry and exit decisions. The system uses a volatility-adaptive trend detection mechanism built on Hull Moving Averages with ATR-based bands to filter consolidation periods and isolate directional moves.
The liquidity detection engine identifies potential reversal zones by marking swing highs and lows that meet statistical significance thresholds. These zones represent areas where institutional order flow previously caused price rejection. Zones remain active until price closes through them, indicating mitigation of the level.
This implementation is an enhanced derivative of the original system with fully automated risk management. Stop losses are calculated using ATR multiples with entry candle wick protection as a minimum threshold, while take profits maintain a fixed 3:1 risk-reward ratio. An additional exit mechanism closes profitable positions when price reaches opposing supply or demand zones, providing early profit-taking at probable reversal points before full target completion.
Entry signals generate only on trend changes when volume exceeds average levels, reducing false breakouts in ranging conditions. The system includes complete position tracking with three distinct exit types: take profit hits, stop loss hits, and profitable zone contact exits. All calculations use confirmed historical data with no forward-looking bias, though supply/demand zone identification operates with a confirmation lag inherent to pivot point detection.

FUSED 9.5 INSTITUTIONAL [FINAL] - AgTradezInstitutional style Indicator that gives you trend direction, MSS, with Tp levels and much more.

[CT] ATR Ratio MTFThis indicator is an enhanced, multi-timeframe version of the original “ATR ratio” by RafaelZioni. Huge thanks to RafaelZioni for the core concept and base logic. The script still combines an ATR-based ratio (Z-score style reading of where price sits within its recent ATR envelope) with an ATR Supertrend, but expands it into a more flexible trade-decision and visual context tool.
The ATR ratio is normalized so you can quickly see when price is pressing into extended bullish or bearish territory, while the Supertrend defines directional bias and a dynamic support-resistance trail. You can choose any higher timeframe in the settings, allowing you to run the ATR ratio and Supertrend from a larger anchor timeframe while trading on a lower chart.
Upgrades include a full Pine Script v6 rewrite, multi-timeframe support for both the ATR ratio and Supertrend, user-controlled colors for the Supertrend in bull and bear modes, and optional bar coloring so price bars automatically reflect Supertrend direction. Entry, pyramiding and take-profit logic from the original script are preserved, giving you a familiar framework with more control over timeframe, visuals and trend bias.
This indicator is designed to give you a clean directional framework that blends volatility, trend, and timing into one view. The ATR ratio side of the script shows you where price sits inside a recent ATR-based envelope. When the ATR ratio pushes up and sustains above the bullish threshold, it signals that price is trading in an extended, momentum-driven zone relative to recent volatility. When it drops and holds below the bearish threshold, it shows the opposite: sellers have pushed price down into an extended bearish zone. The optional background coloring simply makes these bullish and bearish environments easier to see at a glance.
On top of that, the Supertrend and bar colors tell you what side of the market to favor. The Supertrend is calculated from ATR on whatever timeframe you choose in the settings. If you set the MTF input to a higher timeframe, the Supertrend and ATR ratio become your higher time frame bias while you trade on a lower chart. When price is above the MTF Supertrend, the line uses your bullish color and, if bar coloring is enabled, candles adopt your bullish bar color. That is your “long only” environment: you generally look for buys when price is above the Supertrend and the ATR ratio is either turning up from neutral or already in a bullish zone. When price is below the MTF Supertrend, the line uses your bearish color and candles can shift to your bearish bar color; that is where you focus on shorts, especially when the ATR ratio is rolling over or holding in the bearish zone.
The built-in long and short conditions are meant as signal prompts, not rigid rules. Long signals fire when the ATR ratio crosses up through a positive level while the Supertrend is bullish. Short signals fire when the ATR ratio crosses down through a negative level while the Supertrend is bearish. The script tracks how many longs or shorts have been taken in sequence (pyramiding) and will only allow a new signal up to the limit you set, so you can control how aggressively you stack positions in a trend. The take-profit logic then watches the percentage move from your last entry and flags “TP” when that move has reached your take-profit percent, helping you standardize exits instead of eyeballing them bar by bar.
In practice you typically start by choosing your anchor timeframe for the MTF setting, for example a 1-hour or 4-hour Supertrend and ATR ratio while watching a 5-minute or 15-minute chart. You then use the Supertrend direction and bar colors as your bias filter, only taking signals in the direction of the trend, and you use the ATR ratio behavior to judge whether you are entering into strength, fading an extreme, or trading inside a neutral consolidation. Over time this gives you a consistent way to answer three questions on every chart: which side am I allowed to trade, how extended is price within its recent volatility, and where are my structured entries and exits based on that framework.

KAMA Flip strategyI built this strategy because I wanted something that doesn’t overcomplicate trading.
No 20 indicators, no guessing, no “maybe I should close here.”
Just a clear momentum flip, a defined stop, and a defined take profit. (for me on 1D BTC chart it works best with 6% stoploss and 3% takeprofit, lookback should be 40, everything else standard)
The idea is simple: when momentum shifts, I want to be on the right side of it.
KAMA is good for this because it speeds up when the market moves and slows down when it doesn’t.
I normalize it so it becomes a clean zero-line oscillator.
Above zero means momentum is turning up. Below zero means it’s turning down.
That’s the entire entry logic. A flip is a flip.
The exit logic is just as simple: one stop loss, one take profit, both fixed percentages from the entry.
The position closes 100% at the target or the stop. No scaling in, no scaling out, no trailing.
It’s straightforward and easy to analyze because every trade has the exact same structure.
I originally made this for BTC on the daily chart, but nothing stops you from trying it on other charts.
If you want it only to go long, only to go short, or take both sides, you can set that.
All the KAMA parameters are open so you can play with how reactive the signal is.
The visuals and SL/TP lines can be turned on or off depending on how clean you want your chart.
This isn’t financial advice. It’s just a system I like because it’s simple, objective, and does exactly what it’s supposed to do.
Test it, adjust it, break it, rebuild it — do whatever fits your own approach.

Best Entry Swing MASTER v3 PUBLIC (S.S)Strategy Description (English)
Best Entry Swing MASTER v3 – Quality Mode
The Best Entry Swing MASTER v3 is a structured swing trading and trend-following strategy designed to identify high-probability long and short entries during directional markets.
It combines three core setup types commonly used by momentum and breakout traders:
Breakout (BO)
Pullback Reversal (PB)
Volatility Contraction Pattern (VCP)
The strategy applies multiple layers of confirmation, including multi-EMA trend structure, volatility contraction, volume filters, and an optional market regime filter.
It is suitable for swing trading on higher timeframes (4H, Daily), as well as medium-term trend continuation setups.
Core Concepts
1. Trend Structure
A trend is considered valid when:
Uptrend: Price > EMA20 > EMA50 > EMA100
Downtrend: Price < EMA20 < EMA50 < EMA100
In addition, a simple but effective trend-strength metric is calculated using the percentage spread between EMA20 and EMA100.
This helps avoid signals during sideways or low-volatility environments.
2. Market Regime Filter
The market environment is determined using a higher timeframe benchmark (default: SPY on Daily).
Only long trades are allowed in bullish market conditions
Only short trades in bearish conditions
This significantly reduces false signals in counter-trend conditions.
Entry Logic
Breakout (BO)
A long breakout triggers when:
Price closes above the highest high of the lookback period
Volume exceeds its 20-period average
Trend and market regime confirm
(Optional A+ mode): true volatility contraction is required
Similar logic applies for short breakdowns.
Pullback (PB)
A pullback entry triggers after:
At least two corrective candles
A strong reversal candle (close above previous high for long)
Volume confirmation
Price interacts with EMA20
This structure models classical trend-reentry conditions.
Volatility Contraction Pattern (VCP)
A VCP entry triggers when:
True range contracts over multiple bars
Price holds near the breakout zone
Volume contracts
Trend and market regime are aligned
This setup aims to capture explosive continuation moves.
Quality Modes
The strategy offers two modes:
Balanced Mode
Moderate signal frequency
Broader trend-strength allowance
Suitable for more active traders
A+ Only Mode
Strict confirmation requirements
Only high-quality setups with multiple confluences
Designed to avoid low-probability trades entirely
Risk Management
Risk is managed using an ATR-based stop and target:
Long SL = Close − ATR × 1.5
Long TP = Close + ATR × 3
(Equivalent logic for short positions)
This provides a balanced reward-to-risk profile and avoids overly tight stops.
Early Entry Signals (Optional)
The script offers optional “Early Entry” markers that highlight when a setup is forming but not yet confirmed.
These are not entry signals and are disabled by default for public use.
Intended Use
This strategy is designed for:
Swing trading
Momentum continuation
Trend-following
Multi-day to multi-week trades
It performs best on:
4H
Daily
High-liquidity equities, indices, and futures
Disclaimer
This script is intended for educational and research purposes.
Past performance does not guarantee future results.
Always backtest thoroughly and use appropriate risk management.

G-BOT ENGULFING CANDLE - FIXED SL & TP // Description:
This Pine Script strategy identifies bullish and bearish engulfing candle patterns over a defined lookback period and places trades based
on recent market highs and lows. It calculates stop loss and take profit levels using the Average True Range (ATR) multiplied by a user-defined factor, with the ability to adjust the risk-to-reward ratio for each trade.

ATR Based TMA Bands [NeuraAlgo]ATR-Based TMA Bands
ATR-Based TMA Bands is a volatility-adaptive channel system built around a smoothed Triangular Moving Average (TMA).
It identifies trend direction, momentum shifts, and reversal opportunities using a combination of TMA structure and ATR-driven channel expansion.
Perfect for traders who want a clean, intelligent, and adaptive market framework.
Made by NeuraAlgo.
🔷 How It Works
1. 🔹 TMA Midline (Core Trend)
The indicator builds a smooth and stable midline using:
📐 Triangular Moving Average
🔄 Additional EMA smoothing
This creates a low-noise trend curve that reacts cleanly to real momentum changes.
2. 📈 Volatility-Adjusted Bands
The channels are built from:
📊 Standard Deviation × Expansion Multiplier
📏 Three ATR-based outer layers
These bands:
Expand in high volatility
Contract in stable markets
Reveal pullbacks, breakout zones, and exhaustion points
3. 🔁 Trend Tilt Algorithm
Slope is measured using an ATR-normalized tilt formula:
atrBase = ta.atr(smoothLen)
tilt = (midline - midline ) / (0.1 * atrBase)
This classifies the trend into:
Bullish
Bearish
Neutral
The bar colors and midline adjust automatically to match market direction.
4. 🔄 Reversal Detection (Turn Signals)
The indicator flags directional flips:
Turn Up → bearish → bullish shift
Turn Down → bullish → bearish shift
These are early reversal alerts ideal for swing traders.
5. 🎯 Flip Buy / Flip Sell Signals
Deep volatility extensions create high-probability re-entry zones:
Flip Buy → price rebounds from oversold ATR zone
Flip Sell → price rejects from overbought ATR zone
Great for:
Mean-reversion entries
Trend re-tests
Pullback trades
Exhaustion signals
📌 How to Use This Indicator
✔ Trend Trading
Follow trend using tilt-colored candles
Use midline as dynamic trend filter
Use channels for breakout/pullback entries
✔ Reversal Trading
Watch for Turn Up / Turn Down labels
Flip signals show where the market is over-stretched
✔ Risk Management
ATR channels automatically adjust to volatility
Helps with smarter SL/TP placement
⭐ Best For
Trend traders
Swing traders
Reversal hunters
Volatility lovers
Anyone wanting a smart, clean technical framework
💡 Core Features
TMA-smoothed trend detection
Multi-layer ATR expansion channels
Intelligent trend tilt algorithm
Turn Up / Turn Down reversal markers
Flip Buy / Flip Sell exhaustion signals
Adaptive bar coloring
Clean and professional visual design

First Fvg Strategy with CHoCH Exits, Adaptive TP & Entry TimerA strategy that is purely based off of prices reaction to the first presented fair value gap at 9:30 market open. Works best on NASDAQ one minute timeframe. Experimental indicator for me to back test first presented fair value gap.

Session Open Range, Breakout & Trap Framework - TrendPredator OBSession Open Range, Breakout & Trap Framework — TrendPredator Open Box
Stacey Burke’s trading approach combines concepts from George Douglas Taylor, Tony Crabel, Steve Mauro, and Robert Schabacker. His framework focuses on reading price behaviour across daily templates and identifying how markets move through recurring cycles of expansion, contraction, and reversal. While effective, much of this analysis requires real-time interpretation of session-based behaviour, which can be demanding for traders working on lower intraday timeframes.
The TrendPredator indicators formalize parts of this methodology by introducing mechanical rules for multi-timeframe bias tracking and session structure analysis. They aim to present the key elements of the system—bias, breakouts, fakeouts, and range behaviour—in a consistent and objective way that reduces discretionary interpretation.
The Open Box indicator focuses specifically on the opening behaviour of major trading sessions. It builds on principles found in classical Open Range Breakout (ORB) techniques described by Tony Crabel, where a defined time window around the session open forms a structural reference range. Price behaviour relative to this range—breaking out, failing back inside, or expanding—can highlight developing session bias, potential trap formation, and directional conviction.
This indicator applies these concepts throughout the major equity sessions. It automatically maps the session’s initial range (“Open Box”) and tracks how price interacts with it as liquidity and volatility increase. It also incorporates related structural references such as:
* the first-hour high and low of the futures session
* the exact session open level
* an anchored VWAP starting at the session open
* automated expansion levels projected from the Open Box
In combination, these components provide a unified view of early session activity, including breakout attempts, fakeouts, VWAP reactions, and liquidity targeting. The Open Box offers a structured lens for observing how price transitions through the major sessions (Asia → London → New York) and how these behaviours relate to higher-timeframe bias defined in the broader TrendPredator framework.
Core Features
Open Box (Session Structure)
The indicator defines an initial session range beginning at the selected session open. This “Open Box” represents a fixed time window—commonly the first 30 minutes, or any user-defined duration—that serves as a structural reference for analysing early session behaviour.
The range highlights whether price remains inside the box, breaks out, or rejects the boundaries, providing a consistent foundation for interpreting early directional tendencies and recognising breakout, continuation, or fakeout characteristics.
How it works:
* At the session open, the indicator calculates the high and low over the specified time window.
* This range is plotted as the initial structure of the session.
* Price behaviour at the boundaries can illustrate emerging bias or potential trap formation.
* An optional secondary range (e.g., 15-minute high/low) can be enabled to capture early volatility with additional precision.
Inputs / Options:
* Session specifications (Tokyo, London, New York)
* Open Box start and end times (e.g., equity open + first 30 minutes, or any custom length)
* Open Box colour and label settings
* Formatting options for Open Box high and low lines
* Optional secondary range per session (e.g., 15-minute high/low)
* Forward extension of Open Box high/low lines
* Number of historic Open Boxes to display
Session VWAPs
The indicator plots VWAPs for each major trading session—Asia, London, and New York—anchored to their respective session opens. These session-specific VWAPs assist in tracking how value develops through the day and how price interacts with session-based volume distributions.
How it works:
* At each session open, a VWAP is anchored to the open price.
* The VWAP updates throughout the session as new volume and price data arrive.
* Deviations above or below the VWAP may indicate balance, imbalance, or directional control.
* Viewed together, session VWAPs help identify transitions in value across sessions.
Inputs / Options:
* Enable or disable VWAP per session
* Adjustable anchor and end times (optionally to end of day)
* Line styling and label settings
* Number of historic VWAPs to draw
First Hour High/Low Extensions
The indicator marks the high and low formed during the first hour of each session. These reference points often function as early control levels and provide context for assessing whether the session is establishing bias, consolidating, or exhibiting reversal behaviour.
How it works:
* After the session starts, the indicator records the highest and lowest prices during the first hour.
* These levels are plotted and extended across the session.
* They provide a visual reference for observing reactions, targets, or rejection zones.
Inputs / Options:
* Enable or disable for each session
* Line style, colour, and label visibility
* Number of historic sessions displayed
EQO Levels (Equity Open)
The indicator plots the opening price of each configured session. These “Equity Open” levels represent short-term reference points that can attract price early in the session.
Once the level is revisited after the Open Box has formed, it is automatically cut to avoid clutter. If not revisited, the line remains as an untested reference, similar to a naked point of control.
How it works:
* At session open, the open price is recorded.
* The level is plotted as a local reference.
* If price interacts with the level after the Open Box completes, the line is cut.
* Untested EQOs extend forward until interacted with.
Inputs / Options:
* Enable/disable per session
* Line style and label settings
* Optional extension into the next day
* Option for cutting vs. hiding on revisit
* Number of historic sessions displayed
OB Range Expansions (Automatic)
Range expansions are calculated from the height of the Open Box. These levels provide structured reference zones for identifying potential continuation or exhaustion areas within a session.
How it works:
* After the Open Box is formed, multiples of the range (e.g., 1×, 2×, 3×) are projected.
* These expansion levels are plotted above and below the range.
* Price reactions near these areas can illustrate continuation, hesitation, or potential reversal.
Inputs / Options:
* Enable or disable per session
* Select number of multiples
* Line style, colour, and label settings
* Extension length into the session
Stacey Burke 12-Candle Window Marker
The indicator can highlight the 12-candle window often referenced in Stacey Burke’s session methodology. This window represents the key active period of each session where breakout attempts, volatility shifts, and reversal signatures often occur.
How it works:
* A configurable window (default 12 candles) is highlighted from each session open.
* This window acts as a guide for observing active session behaviour.
* It remains visible throughout the session for structural context.
Inputs / Options:
* Enable/disable per session
* Configurable window duration (default: 3 hours)
* Colour and transparency controls
Concept and Integration
The Open Box is built around the same multi-timeframe logic that underpins the broader TrendPredator framework.
While higher-timeframe tools track bias and setups across the H8–D–W–M levels, the Open Box focuses on the H1–M30 domain to define session structure and observe how early intraday behaviour aligns with higher-timeframe conditions.
The indicator integrates with the TrendPredator FO (Breakout, Fakeout & Trend Switch Detector), which highlights microstructure signals on lower timeframes (M15/M5). Together they form a layered workflow:
* Higher timeframes: context, bias, and developing setups
* TrendPredator OB: intraday and intra-session structure
* TrendPredator FO: microstructure confirmation (e.g., FOL/FOH, switches)
This alignment provides a structured way to observe how daily directional context interacts with intraday behaviour.
See the public open source indicator TP FO here (click on it for access):
Practical Application
Before Session Open
* Review previous session Open Box, Open level, and VWAPs
* Assess how higher-timeframe bias aligns with potential intraday continuation or reversal
* Note untested EQO levels or VWAPs that may function as liquidity attractors
During Session Open
* Observe behaviour around the first-hour high/low and higher-timeframe reference levels
* Monitor how the M15 and 30-minute ranges close
* Track reactions relative to the session open level and the session VWAP
After the Open Box completes
* Assess price interaction with Open Box boundaries and first-hour levels
* Use microstructure signals (e.g., FOH/FOL, switches) for potential confirmation
* Refer to expansion levels as reference zones for management or target setting
After Session
* Review how price behaved relative to the Open Box, EQO levels, VWAPs, and expansion zones
* Analyse breakout attempts, fakeouts, and whether intraday structure aligned with the broader daily move
Example Workflow and Trade
1. Higher-timeframe analysis signals a Daily Fakeout Low Continuation (bullish context).
2. The New York session forms an Open Box; price breaks above and holds above the first-hour high.
3. A Fakeout Low + Switch Bar appears on M5 (via FO), after retesting the session VWAP triggering the entry.
4. 1x expansion level serves as reference targets for take profit.
Relation to the TrendPredator Ecosystem
The Open Box is part of the TrendPredator Indicator Family, designed to apply multi-timeframe logic consistently across:
* higher-timeframe context and setups
* intraday and session structure (OB)
* microstructure confirmation (FO)
Together, these modules offer a unified structure for analysing how daily and intraday cycles interact.
Disclaimer
This indicator is for educational purposes only and does not guarantee profits.
It does not provide buy or sell signals but highlights structural and behavioural areas for analysis.
Users are solely responsible for their trading decisions and outcomes.

Dual MACD AccelerationDual MACD Acceleration Indicator – Synopsis
Purpose:
This indicator identifies early momentum shifts in the market by comparing a fast MACD (8/20/6) with a slower MACD (12/26/9). It highlights potential strong buy and sell signals when the faster MACD crosses the slower MACD, allowing traders to catch trend accelerations before the full move develops.
Components
Fast MACD (8/20/6)
Responds quickly to short-term price changes.
Detects early momentum shifts.
Slow MACD (12/26/9)
Captures the dominant trend.
Provides a smoother reference for comparison.
Acceleration Signals
Long (▲): Fast MACD crosses above Slow MACD → potential bullish acceleration.
Short (▼): Fast MACD crosses below Slow MACD → potential bearish acceleration.
Zero Line
Optional visual reference for overall trend direction.
Crosses above zero = bullish trend, below zero = bearish trend.
Key Features
Clean, minimal chart display.
Optional toggles to show/hide each MACD line.
Label markers indicate crossovers.
Built-in alert conditions for automated notifications.
Trading Use
Trend Confirmation:
Best used with higher timeframe filters (VWAP or EMAs) to avoid fakeouts.
Entry Timing:
Enter on the first pullback after a crossover signal.
Only trade in the direction of the dominant trend.
Stops & Risk:
Use recent swing lows/highs for stop placement.
TP levels can be structure-based or trailing with price momentum.
Synopsis Summary:
The Dual MACD Acceleration Indicator is a lightweight, early-momentum tool designed for scalpers and short-term traders. It captures fast shifts in trend by comparing a faster and slower MACD, highlighting strong buy and sell opportunities while remaining clean and easy to read. For higher accuracy, combine with trend filters like VWAP or EMAs.

Supertrend + DEMA Strategy ( customised & Switchable, Fixed TP)Supertrend line – a moving line that follows the price and shows whether the market is trending up or down.
If the price goes above this line, it usually means the market is going up.
If the price goes below, it usually means the market is going down.
DEMA (Double Exponential Moving Average) – another line that smooths out price movements to spot trends more clearly.
It calculates an average of prices but reacts faster than a normal moving average.
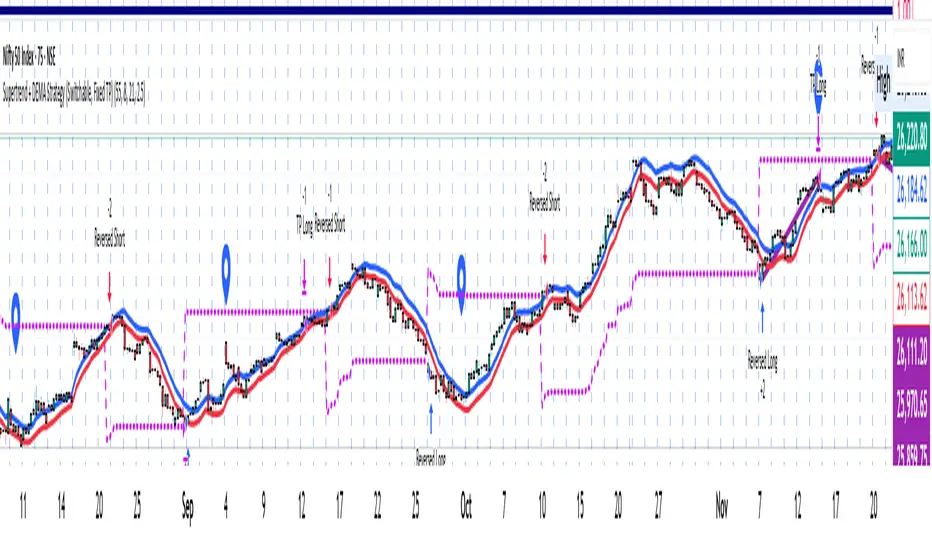
Nifty Breakout Levels Strategy (v7 Hybrid)Nifty Breakout Levels Strategy (v7 Hybrid – Compounding from Start Date)
Instrument / TF: Designed for current-month NIFTY futures on 1-hour timeframe, with at most 1 trade per day.
Entry logic: Uses a 10-bar breakout box with a 0.3% buffer, plus EMA-based trend + proximity filter.
Longs: price in breakout-high zone, above EMA50/EMA200 and within proximityPts.
Shorts: price in breakout-low zone and strong downtrend (EMA10 < EMA20 < EMA50 < EMA200, price below EMA200).
Trades only when ATR(14) > atrTradeThresh and during regular hours (till 15:15).
Risk / exits: Stop loss is ATR-adaptive – max of slBasePoints (100 pts) and ATR * atrSLFactor; TP is fixed (tpPoints, e.g. 350 pts).
Longs have stepped trailing profit levels (100/150/200/250/320 pts) that lock in gains on pullbacks.
Shorts have trailing loss-reduction levels (80/120/140 pts) to cut improving losses.
Additional exit: 1H EMA50 2-bar reversal against the position, plus optional EOD flatten at 3:15 PM.
Compounding engine: From a chosen start date, equity is rebased to startCapital, and lot size scales dynamically as equity / capitalPerLot, with automatic lot reductions at three drawdown thresholds (ddCut1 / 2 / 3).
Automation: All entries and exits are exposed via alertconditions (long/short entry & exit) so the strategy can be connected to broker/webhook automation.
