Bollinger Bands + EMA 9A 1 minute scalping strategy.
Uses Bollinger Bands (no basis line) and a 9 period EMA.
Waits for price to close below the lower Bollinger Band and the next candle to close bullish above the lower Bollinger Band but below the 9 Period EMA.
If all conditions are met, the script enters a long position with TP at the 9 Period EMA.
Buscar en scripts para "the script"

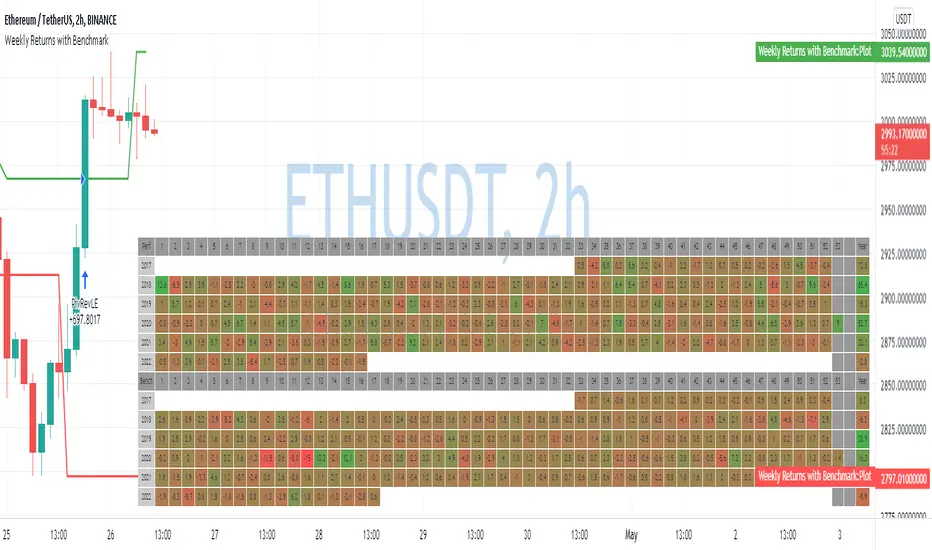
Weekly Returns with BenchmarkSome time ago I published Monthly returns table. Now It's time for weekly one.
To get it work you need a pretty big screen, but I hope it will be useful for some of you.
Features of this table includes:
Display weekly returns of your strategy, benchmark, and alpha over this benchmark.
Select benchmark to be another instrument
Select the date from which you want to compute monthly returns
Show/hide benchmark and alpha
Choose colors for gradient for gain/loss values
Use it with any type of strategy
Use it with replay
Thanks to @MUQWISHI to help me coding it.
It's not about the strategy itself but the way you display returns on your chart. So pls don't critique my choice of the strategy and its performance 🙂
Disclaimer
Please remember that past performance may not be indicative of future results.
Due to various factors, including changing market conditions, the strategy may no longer perform as well as in historical backtesting.
This post and the script don’t provide any financial advice.
MA cross strategyI created an sma (10/30) strategy.
The script is under construction and can be changed, since i'm looking for a more profitable strategy.
If you have ideas to make it more profitable, please comment.
It is possible to change everything to your own needs.
Small short for CryptoThis is the third modification of VuMAnChu cipher B indicator designed only for short sales.
The trigger signal is called sommi bearish diamond (according to my due diligence it has the best performance)
You can either fix a stop loss value or close position after crossing sma line.
Take profit also can be tuned.
Keep in mind that short positions are very risky, so deposit your money to the market only after your research. I guess this indicator has potential for repainting, so track backtests/forward tests carefully. The script is for entertainment purposes only.
Good luck and have fun!

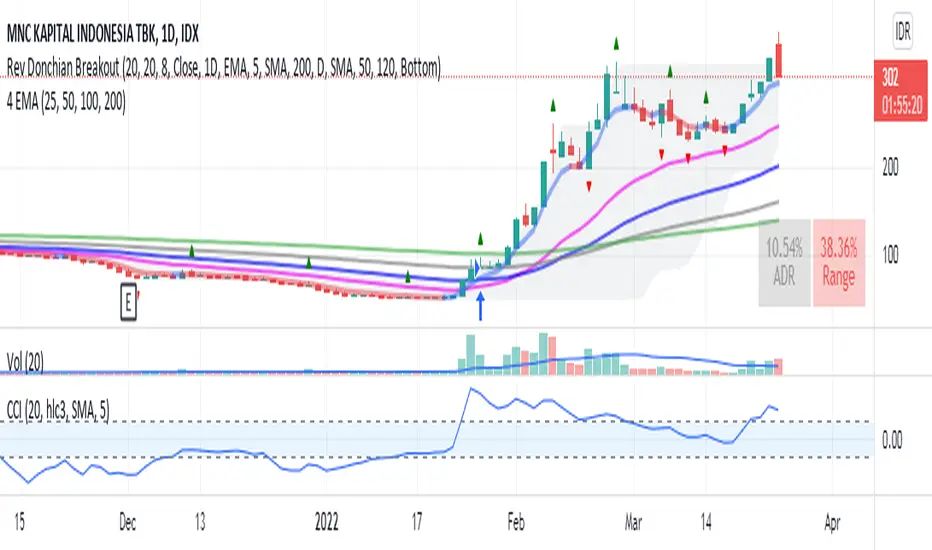
Donchian Breakout no repaintdonchian breakout strategy which i revise the script for no repaint signal
Day of Week Custom Buy/Sell StrategyThis strategy was made for bitcoin and allows you to back test longing or shorting for various days of the week. The price may tend to go in one direction or another for each week day, and this strategy allows you to test days across a range of dates to capitalize on this.
Make sure you are on the daily time frame while viewing the performance and trade history to ensure the script works as intended and you have the most historical data as possible from Trading View.

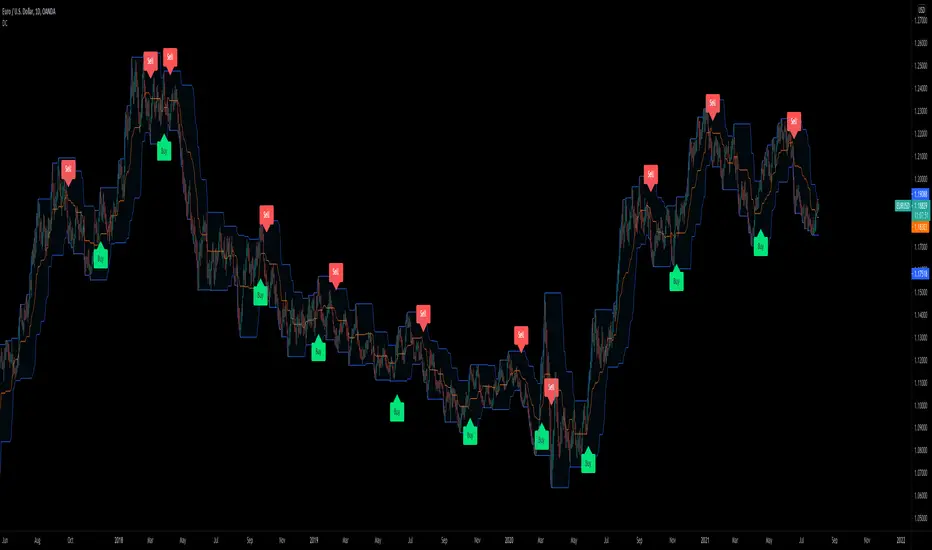
Donchian Channels strategy with backtestHere's another trading strategy for you. This one is based on the standard Donchian Channels.
This one will - by default - wait for 2 consecutive higher highs (or lower lows) before taking a position. This can be disabled so the script will take a new trade without waiting for the 2nd high or low.
This is useful to avoid getting into a trade when market makers are aiming for a swing-failure pattern (= taking out stop/losses below the last low or above the last high)
For people who don't like to short, there's also the option to exclude shorts.
Enjoy!
EmperorBTC's VWAP StrategyEmperorBTC's VWAP Indicator & Strategy
v2.1
coded by Bogdan Vaida
This indicator was created after EmperorBTC's conditions.
Good timeframes for it: 30', 15', 5'
To convert from strategy to study switch the commented lines in the beginning
and at the end of the script and vice versa.
What this indicator does is to check if:
o Pivot Point was crossed
o Stoch-RSI and VWAP were crossed in current or previous candle
o Candle (or previous candle) close is in the trend direction
If all these are true then it will go long or short based on direction.

Companion::InsurgentCompanion::Insurgent is a combined indicators strategy. Performances are pretty good on 1D, 4H and 1H timeframes and it can be used on Bitcoin and Altcoin markets.
Mainly, it is a trategy based on Ehlers formulas.
Used indicators:
- Ehlers Instantaneous Trend: trendline analysis;
- Ehlers Super Bandpass Filter: momentum detection;
- EMA: Long/Short time selector.
What the script does:
- determines trendlines combining mulitple indicators;
- automaticlally calculates Take profit and Stop Loss levels;
- permits automation generating Autoview signals (create an alert with {{strategy.order.alert_message}} in message text field to trap Autoview commands;
- supports for margin trading. Spot trading will be added in the future.
BACKTESTING
Backtest is not leveraged. Defaults are set as follow:
Capital: 10000
Percent of equity used for trades: 10%
Commission: 0.18% this is Bitfinex commission on orders
Change them accordingly on how you trade to get a more realistic backtest results.

ABUs EurorampThis strategy backtests the opening ramp of Europe at 9am European time, which is 2am Chicago time ( CME ES timezone ) on the ES Futures Contract.
The following conditions are embedded in the strategy:
- Market entry at 2 am Chicago time
- Size = 2 contracts
- Stop = -5 points
- TP 1 = +3 points (1 Contract)
- Stop to Break even (entry + 0.5) after TP 1 is reached
- Set a TP 2 stop to +5 if entry is +10 points
- Close all positions EOD RTH
As the script entry / stops / TPs work on candle closes, best is to use the strategy on the 5min chart.

Companion::DivergentCompanion::Divergent is a combined indicators strategy optimized for Bitcoin Markets and tested on Bitfinex.
Mainly, it is an Ichimoku based strategy.
Used indicators:
- Ichimoku (displayed on chart): trendline analysis;
- Double Hull MA (displayed on chart): trendline analysis;
- MACD (not displayed): confirmative/momentum detection;
- CCI (not displayed): confirmative/momentum detection;
- ATR: used toghether with Ichimoku to determine Stop Loss/Take Profit levels;
- VWMA: For implementing trailing stop orders based on volumes.
What the script does:
- determines trendlines combining mulitple indicators;
- automaticlally calculates Take profit and Stop Loss levels;
- permits automation generating Autoview signals;
- supports for margin trading. Spot trading will be added in the future.
It can be used on 1D or 1H timeframes but it can be adapted for other time frames tweaking the parameters. I used it a lot on Bitfinex on 1H timeframes. Please check parameters: if you will use the strategy on D or higher timeframes, the "Legacy Chikou analysis" option should be checked.
BACKTESTING
Backtest is not leveraged. Defaults are set as follow:
Capital: 10000
Percent of equity used for trades: 10%
Commission: 0.18% this is Bitfinex commission on orders
Change them accordingly on how you trade to get a more realistic backtest results.

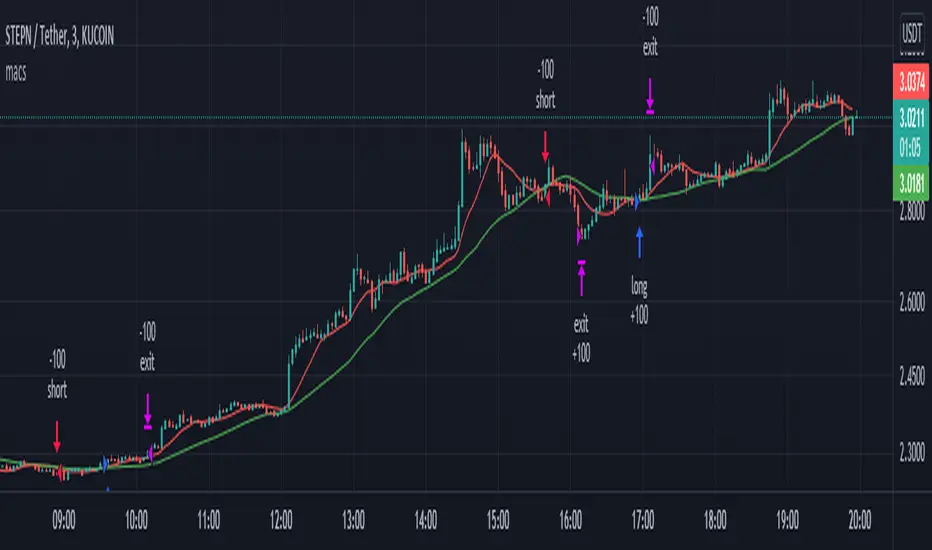
Simple and efficient MACD crypto strategy with risk managementToday I am glad to bring you another great creation suited for crypto markets.
MARKET
Its a simple and efficient strategy, designed for crypto markets( btcusd , btcusdt and so on), and suited for for higher time charts : like 1hour, 4hours, 1 day and so on.
Preferably to use 1h time charts.
COMPONENTS
MACD with simple moving average
ENTRY DESCRIPTION
For entries we have :
We check the direction with MACD . Depending if its an uptrend and positive level on histogram of MACD we go long, otherwise we go short.
RISK MANAGEMENT
In this strategy we use a stop loss based on our equity. For this example I choosed a 2% risk .That means if our account has 100.000 eur, it will automatically close the trade if we lose 2.000.
We dont use a take profit level.
In this example also we use a 100.000 capital account, risking 5% on each trade, but since its underleveraged, we only use 5000 of that ammount on every trade. With leveraged it can be achieved better profits and of course at the same time we will encounter bigger losses.
The comission applied is 5$ and a slippage of 5 points aswell added.
For any questions or suggestions regarding the script , please let me know.

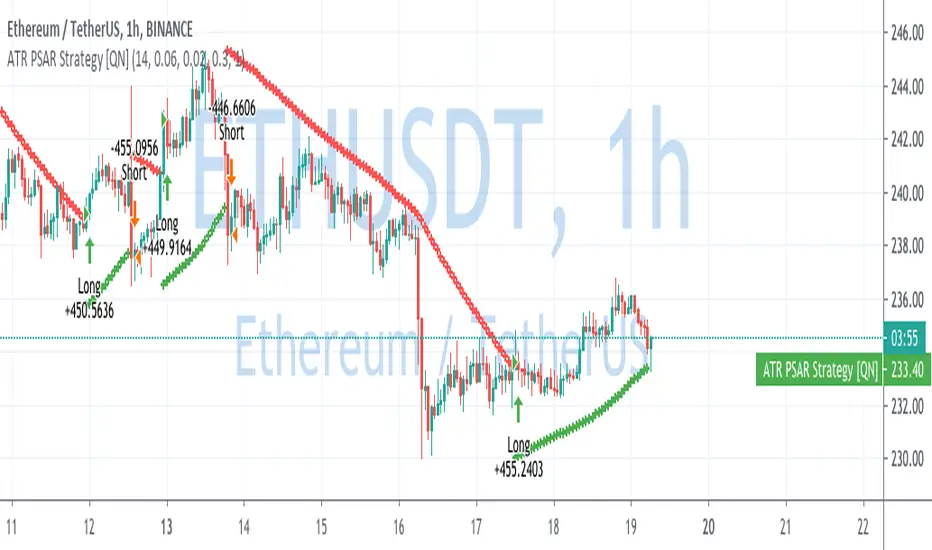
ATR Parabolic SAR Strategy [QuantNomad]I created a version of Parabolic SAR when I accelerate it not based on the difference from the extreme point but based on current ATR. So the idea is that for a more volatile market it should move faster.
Performance is calculated based on 25% equity invested and 0.1% commission.
What do you think about it? Does it make sense to do something like that?
Do you have in mind other ways I can accelerate it when the market starts to be more volatile?
Disclaimer
Please remember that past performance may not be indicative of future results.
Due to various factors, including changing market conditions, the strategy may no longer perform as good as in historical backtesting.
This post and the script don’t provide any financial advice.
Donchian Strat EXMOThis is simple test of Turtle Trading strategy by Richard Dennis. The script meant to place orders on Donchian Channel borders. It's best to test and use on mid-term charts like 1H and more.
I've chosen Kraken XBT/USDT chart because this market opened in december 2019. The main problem of crypto trading strategy testing is the bullish market of 2017 year. That enormous growth gives unrealisting expectations to all trend-following strategies tested.

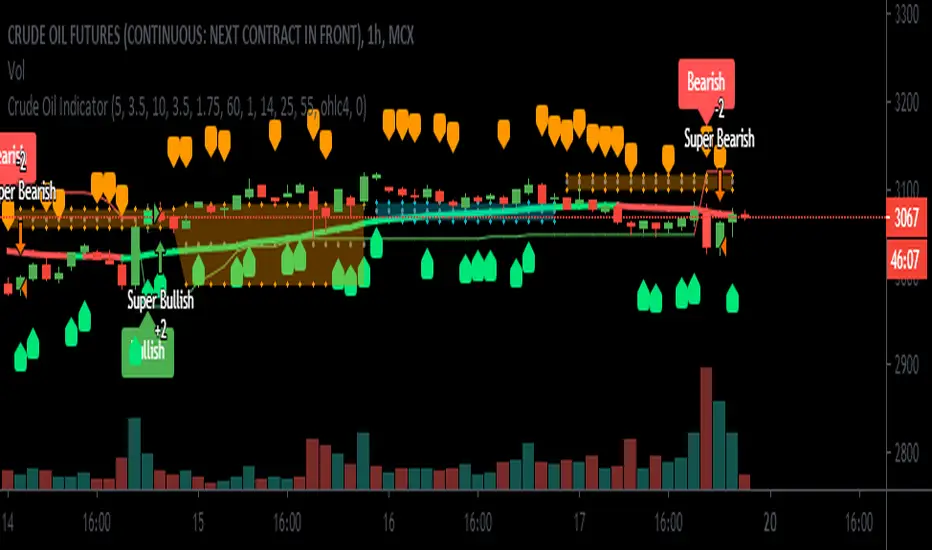
Crude Oil Indicator [SIDD]Crude Oil Indicator is giving two signal Bullish and Bearish . Bullish signal is used to take long trade and Bearish signal is used to close existing long trade and take new short trade and so on.
To get More signal of Bullish and Bearish user must enable More Signals check box that will check crossover and cross down of price close with Gaps.
I am using 2 ATR and one ADX and Gaps and VWMA to make signal profitable with 15 minutes 1 hr ,2hr,3hr,4hr chart time frame.
I have checked last few years data for back testing. Based on past performance it doesn't work well in 30 minute and 1 day chart time frame as results are not good in back testing. I have designed this indicator for Indian crude oil context though it can be used with other market as well.
1st ATR used to find trend with price crossover.
2nd ATR ADX is used to find the trend change details only. I have taken VWMA and ATR both to consider trend change.
Highlight Gap Up and Gap Down is used to know daily market opening gap up and gap down area. Gaps act as support and resistance .
VWMA Plotted as Blue line. Rising VWMA considered as uptrend and falling VWMA considered as downtrend.
Flat VWMA considered as no trend zone. In no trend zone every second third candles cross VWMA .
User must keep the default setting for getting better results as results are back tested. If setting changed then result may vary.
I have added here back tested performance user can see those results. I have added commission and slippage as well. Past year performance not guarantee for future years result so before taking any trade trader must take conscious decision.
This indicator is available on Subscription.
PM/ DM for more information about the script access.
Use the link below to obtain access to this indicator.
Ichimoku Kinko Hyo StrategyStrategy based on the Ishimoku Kinko Hyo system, using the different indicators it provides to build signals.
This strategy could be better as it should ideally use the position of the price line compared to Chikou to determine if signals should be looked for, but I've been unable to fully implement this so far (an imperfect implementation is provided, but disable by default). I'll update the script once I figure it out, but it still gives good results without this.
