CE_ZLSMA_5MIN_CANDLECHART-- Overview
The "CE_ZLSMA_5MIN_CANDLECHART" strategy, developed by DailyPanda, is a comprehensive trading strategy designed for analyzing trading on 5-minute candlestick charts.
It aims to use some indicators calculated from a Hekin Ashi chart, while running it on a normal candlestick chart, making sure that no price distortion affects the strategy results .
It also brings a feature to show, on the candlestick chart, where the entries would take place on the HA chart, to also be able to study the effect that the price distortion would make on your backtest.
-- Credit
The code in this script is based on open-source indicators originally written by veryfid and everget, I've made significant changes and additions to the scripts but all credit for the idea goes to them, I just built on top of it:
-- Key Features
It incorporate already built indicators (ZLSMA) and CandelierExit (CE)
-- Zero Lag Least Squares Moving Average (ZLSMA) - by veryfid
The ZLSMA is used to detect trends with minimal lag, improving the accuracy of entry and exit signals.
It incorporates a double-smoothed linear regression to minimize lag and enhance trend-following capabilities.
Buy signals are generated when the price closes above the ZLSMA together with the CE signal.
It is calculated based on the HA candlestick pattern.
-- Chandelier Exit (CE) - by everget
The Chandelier Exit indicator is used to dynamically manage stop-loss levels based on the Average True Range (ATR).
It ensures that stop-loss levels are adaptive to market volatility, protecting profits and limiting losses.
The ATR period and multiplier can be customized to fit different trading styles and risk tolerances.
It is calculated based on the HA candlestick pattern.
-- Heikin Ashi Candles
The strategy leverages Heikin Ashi candlesticks to be able identify trends more clearly and leverage this to stay on winning trades longer.
Traders can choose to display Heikin Ashi candlesticks and order fills on the chart for better visualization.
-- Risk Management
The strategy includes multiple risk management options to protect traders' capital.
Maximum intraday loss limit based on a percentage of equity.
Maximum stop-loss in points to filter out entries with excessive risk.
Daily profit target to stop trading once the goal is achieved.
Options to use fixed contract sizes or dynamically adjust based on a percentage of equity.
These features help traders manage risk and ensure sustainable trading practices.
Moving Averages
Several moving averages (EMA 9, EMA 20, EMA 50, EMA 72, EMA 200, SMA 200, and SMA 500) are plotted to provide additional context and trend confirmation.
A "Zone of Value" is highlighted between the EMA 200 and SMA 200 to identify potential support and resistance areas.
-- Customizable Inputs
The strategy includes various customizable inputs, allowing traders to tailor it to their specific needs.
Start and stop trading times.
Risk management parameters (e.g., maximum stop-loss, daily drawdown limit, and daily profit target).
Display options for Heikin Ashi candles and moving averages.
ZLSMA length and offset.
-- Usage
-- Setting Up the Strategy
Configure the start year for the strategy and the trading hours using the input fields. The first candle of each day will be filled black for easy identification, while candles that are outside the allowed time range will be filled purple.
Customize the risk management parameters to match your risk tolerance and trading style.
Enable or disable the display of Heikin Ashi candlesticks and moving averages as desired.
-- Interpreting Signals
Buy signals are indicated by a "Buy" label when the Heikin Ashi close price is above the ZLSMA and the Chandelier Exit indicates a long position.
The strategy will automatically enter a long position with a stop-loss level determined the swing low.
Positions are closed when the close price falls below the ZLSMA.
-- Risk Management
The strategy monitors the maximum intraday loss and stops trading if the loss limit is reached.
If enabled, also stops trading once the daily profit target is achieved, helping to lock in gains.
You have the option to filter operations based on a maximum accepted stop-loss level, based on your risk tolerance.
You can also operate with a fixed amount of contracts or dynamically adjust it based on your allowed risk per trade, ensuring optimal protection of capital.
-- Visual Aids
The strategy plots various moving averages to provide additional trend context.
The "Zone of Value" between the EMA 200 and SMA 200 highlights potential support and resistance areas.
Heikin Ashi candlesticks and order fills can be displayed to enhance the difference this strategy would take if you were to backtest it on a Heikin Ashi chart.
-- Table of results
This strategy also breaks down the results on a monthly basis for better understanding of your capital development along the way.
-- Conclusion
The "CE_ZLSMA_5MIN_CANDLECHART" strategy is a tool for intraday traders looking to understand and leaverage the Heikin Ashi chart while still using the normal candle chart. Traders can customize the strategy to fit their specific needs, making it a versatile addition to any trading toolkit.
Buscar en scripts para "the script"

Premium MTF Layered RSI - Bitcoin Bot [wbburgin]This the premium version of my MTF Layered RSI strategy, which improves significantly on the original strategy (publicly available on my profile). Improvements are below. This strategy will also appear as an overlay on your chart. It is completely non-repainting.
The MTF Layered RSI strategy uses the current timeframe and two configurable higher timeframes to enter a long position when Bitcoin is oversold on all three timeframes, and exit the long position when Bitcoin is overbought on the current timeframe. This hedges against situations where the RSI on higher timeframes never reaches the overbought level and we are left "holding the bag" so to speak with the classic "enter long at oversold and enter short at overbought" strategy.
IMPORTANT: This strategy does not work on ranges. It will work on all timeframes and assets, but does not work on ranges (Renko blocks and some other advanced types of charts).
********** My Background
I am an investor, trader, and entrepreneur with 10 years of cryptocurrency and equity trading experience and founder of two fintech startups. I am a graduate of a prestigious university in the United States and carry broad and inclusive interests in mathematical finance, computer science, machine learning / artificial intelligence, as well as other fields.
**********
Improvements over the original MTF RSI strategy include:
Filters for Uptrends and Downtrends → The Premium RSI strategy will adjust its buy and sell thresholds depending on whether the instrument is trending. This means that, in uptrends, the Premium strategy will buy more frequently, bringing in potentially greater profit, and in downtrends, the strategy will stop buying altogether. These filters and dynamic buy/sell thresholds have made this strategy more profitable in my backtesting across random timeframes, but I cannot guarantee that the strategy will be profitable for you on the default settings. To that end, I have enabled a number of different configurations that you can change in the settings of the strategy.
Stop Loss / Take Profit Calculation Per Tick → Stop loss and take profit are now both enabled in the script and each has their own alerts. You can specify what type of stop loss or take profit you want: percentage or ATR. If you have alerts configured, you will be alerted mid-bar, instead of at close. This helps prevent loss from abrupt falls in price between closing price and next bar open.
Customizable Alert Messages In-Strategy → In the settings, there will be text boxes where you can create your own alerts. All you will need to do is create an alert in the alert panel on Tradingview and leave the message box blank - if you fill out the alert boxes in the settings, these will automatically populate into your alerts. There are in total eight different customizable alerts messages: Entry, Exit, Stop loss, and Take profit alerts for both Long and Short sides. If you disable stop loss and/or take profit, these alerts will also be disabled. Similarly, if you disable shorts, all short alerts will be disabled.
**********
Display
Configuring Stop Loss or Take Profit will make their corresponding displays appear.
Separately from the trading boxes, background colors (green, red) signify extended uptrends and downtrends, respectively.
Configuring Alerts
In TradingView desktop, go to the ‘Alerts’ tab on the right panel. Click the “+” button to create a new alert. Select this strategy for the condition and one of the two options that includes alert() function calls. Name the alert what you wish and clear the default message, because your text in the settings will replace this message.
Now that the alert is configured, you can go to the settings of the strategy and fill in your chosen text for the specific alert condition. You will need to check “Long and Short” in the “Trade Direction” setting in order for any Short Alerts to become active. Similarly, you will need to check “Enable Stop Loss” for stop loss alerts to become active and “Enable Take Profit” for take profit alerts to become active.
**********
Disclaimer
Copyright by wbburgin.
The information contained in my Scripts/Indicators/Algorithms does not constitute financial advice or a solicitation to buy or sell any securities of any type. I will not accept liability for any loss or damage, including without limitation any loss of profit, which may arise directly or indirectly from the use of or reliance on such information.
All investments involve risk, and the past performance of a security, industry, sector, market, financial product, trading strategy, backtest, or individual's trading does not guarantee future results or returns. Investors are fully responsible for any investment decisions they make. Such decisions should be based solely on an evaluation of their financial circumstances, investment objectives, risk tolerance, and liquidity needs.
**********
Notes on the Strategy Performance below: This is 3% of equity per trade, with a pyramiding number of 3. I did not include fees because Binance US on Bitcoin/USD does not charge fees on the instrument; however, I heavily encourage you to include fees in your backtesting if you use a different brokerage. To mitigate fees, this strategy is designed with a high average %/trade. If your current fees are greater than the strategy's average %/trade, I encourage you to choose a higher RSI period, such as 14 or 28, which will result in less trades but potentially a higher %/trade.

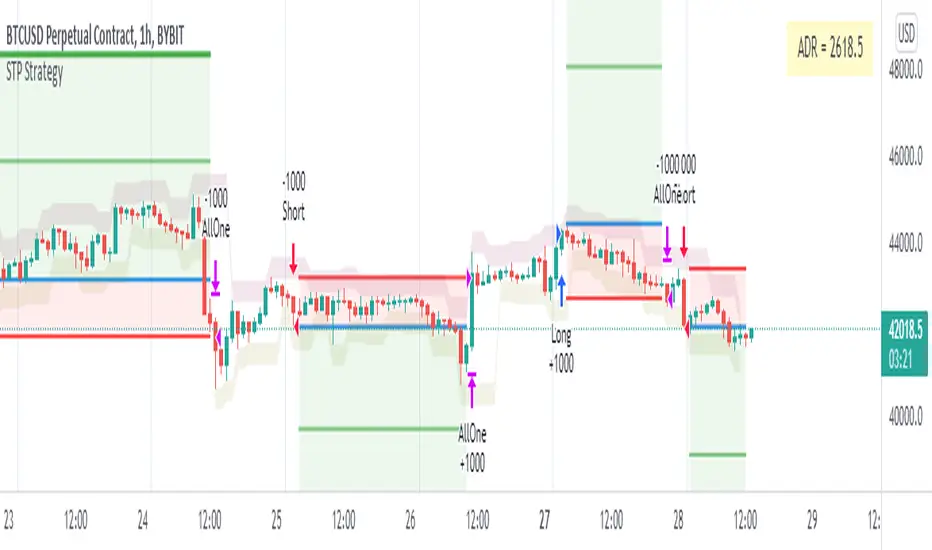
Wunder Trend Reversal botWunder Trend Reversal bot
1. Wunder Trend Reversal Bot - this has only one goal to find a reversal of the trend.
2. The strategy determines, based on the specified value for the filter, a market reversal based on the price actions of the previous bars.
3. A short EMA is used to filter false signals after the reversal signal was received. Crossing the EMA and changing its direction confirms the trend change.
4. There are 2 ways to calculate stop loss and take profit. You can choose one of them:
- Classic stop loss and take profit in a fixed percentage
- ATR stop loss and take pro
5. ATR uses risk reward (R:R) to calculate take profit. The script calculates the risk-reward based on a certain stop loss level and uses it to calculate the take profit
6. A function for calculating risk on the portfolio (your deposit) has been added to the script. When this option is enabled, you get a calculation of the entry amount in dollars relative to your Stop Loss. In the settings, you can select the risk percentage on your portfolio. The loss will be calculated from the amount that will be displayed on the chart.
For example. Deposit - $1000, you set the risk to 1%. SL 5%. Entry volume will be $200. The loss at SL will be $10.10$ this is your 1% risk or 1% of the deposit.
Important! The risk per trade must be less than the Stop Loss value. If the risk is greater than SL, then you should use leverage.
The amount of funds entering the trade is calculated in dollars. This option was created if you want to send the dollar amount from Tradingview to the exchange. However, putting your volume in dollars you get the incorrect net profit and drawdown indication in the backtest results, as TradingView calculates the backtest volume in contracts.
To display the correct net profit and drawdown values in Tradingview Backtest results, use the ”Volume in contracts” option.

Wunder Keltner botWunder Keltner bot
1. Wunder Keltner bot is based on the breakout of the Keltner channel. For calculation, 2 channels are used, one for long trades, and the other for short trades. The division into 2 channels is used for more accurate entry calculations depending on trend directions.
2. The ADX indicator is used to filter signals and determine the trend strength. ADX determines the strength of the trend and confirms the entry into the strategy if the value is greater than the level indicated in the settings.
3. There are 3 ways to calculate Stop Loss and Take Profit. You can choose one of them:
Classic Stop Loss and Take Profit in a fixed percentage
ATR Stop Loss
Keltner. Stop Loss, which is set on the opposite Keltner’s Channel Band from Keltner breakout.
4. ATR and Keltner use Risk Reward (R:R) to calculate Take Profit. The script calculates Risk Reward based on the determined Stop loss level and uses the ration to calculate Take Profit.
5. A function for calculating risk on the portfolio (your deposit) has been added to the script. When this option is enabled, you get a calculation of the entry amount in dollars relative to your Stop Loss. In the settings, you can select the risk percentage on your portfolio. The loss will be calculated from the amount that will be displayed on the chart.
For example. Deposit - $1000, you set the risk to 1%. SL 5%. Entry volume will be $200. The loss at SL will be $10.10$ this is your 1% risk or 1% of the deposit.
Important! The risk per trade must be less than the Stop Loss value. If the risk is greater than SL, then you should use leverage.
The amount of funds entering the trade is calculated in dollars. This option was created if you want to send the dollar amount from Tradingview to the exchange. However, putting your volume in dollars you get the incorrect net profit and drawdown indication in the backtest results, as TradingView calculates the backtest volume in contracts.
To display the correct net profit and drawdown values in Tradingview Backtest results, use the ”Volume in contract” option.

GT 5.1 Strategy═════════════════════════════════════════════════════════════════════════
█ OVERVIEW
People often look an indicator in their technical analysis to enter a position. We may also need to look at the signals of one or more indicators to verify the signals given by some indicators. In this context, I developed a strategy to test whether it really works by choosing some of the indicators that capture trend changes with the same characteristics. Also, since the subject is to catch the trend change, I thought it would be right to include an indicator using the heikin ashi logic. By averaging and smoothing the market noise, Heiken Ashi makes it easier to detect the direction of the trend helps to see possible reversal points on the chart. However, it should be noted that Heiken Ashi is a lagging indicator.
I picked 5 different indicators (but their purpose are similar) and combined them to produce buy and sell signals based on your choice(not repaint). First of all let's get some information about our indicators. So you will understand me why i picked these indicators and what is the meaning of their signals.
1 — Coral Trend Indicator by LazyBear
Coral Trend Indicator is a linear combination of moving averages, all obtained by a triple or higher order exponential smoothing. The indicator comes with a trend indication which is based on the normalized slope of the plot. the usage of this indicator is simple. When the color of the line is green that means the market is in uptrend. But when the color is red that means the market is in downtrend.
As you see the original indicator it is simple to find is it in uptrend or downtrend.
So i added a code to find when the color of the line change. When it turns green to red my script giving sell signals, when it turns red to green it gives buy signals.
I hide the candles to show you more clearly what is happening when you choose only Coral Strategy. But sometimes it is not enough only using itself. Even if green dots turn to red it continues in uptrend. So we need a to look another indicator to approve our signal.
2 — SSL channel by ErwinBeckers
Known as the SSL , the Semaphore Signal Level channel is an indicator that combines moving averages to provide you with a clear visual signal of price movement dynamics. In short, it's designed to show you when a price trend is forming. This indicator creates a band by calculating the high and low values according to the determined period. Simply if you decide 10 as period, it calculates a 10-period moving average on the latest 10 highs. Calculate a 10-period moving average on the latest 10 lows. If the price falls below the low band, the downtrend begins, if the price closes above the high band, the uptrend begins. Lets look the original form of indicator and learn how it using.
If the red line is below and the green band is above, it means that we are in uptrend, and if it is on the opposite side, it means that we are in downtrend. Therefore, it would be logical to enter a position where the trend has changed. So i added a code to find when the crossover has occured.
As you see in my strategy, it gives you signals when the trend has changed. But sometimes it is not enough only using this indicator itself. So lets look 2 indicator together in one chart.
Look circle SSL is saying it is in downtrend but Coral is saying it has entered in uptrend. if we just look to coral signal it can misleads us. So it can be better to look another indicator for validating our signals.
3 — Heikin Ashi RSI Oscillator by JayRogers
The Heikin-Ashi technique is used by technical traders to identify a given trend more easily. Heikin-Ashi has a smoother look because it is essentially taking an average of the movement. There is a tendency with Heikin-Ashi for the candles to stay red during a downtrend and green during an uptrend, whereas normal candlesticks alternate color even if the price is moving dominantly in one direction. This indicator actually recalculates the RSI indicator with the logic of heikin ashi. Due to smoothing, the bars are formed with a slight lag, reflecting the trend rather than the exact price movement. So lets look the original version to understand more clearly. If red bars turn to green bars it means uptrend may begin, if green bars turn to red it means downtrend may begin.
As you see HARSI giving lots of signal some of them is really good but some of them are not very well. Because it gives so much signals Now i will change time period and lets look same chart again.
Now results are better because of heikin ashi's logic. it is not suitable for day traders, it gives more accurate result when using the time period is longer. But it can be useful to use this indicator in short time periods using with other indicators. So you may catch the trend changes more accurately.
4 — MACD DEMA by ToFFF
This indicator uses a double EMA and MACD algorithm to analyze the direction of the trend. Though it might seem a tough task to manage the trades with the help of MACD DEMA once you know how the proper way to interpret the signal lines, it will be an easy task.
This indicator also smoothens the signal lines with the time series algorithm which eventually makes the higher time frame important. So, expecting better results in the lower time frame can result in big losses as the data reading from the MACD DEMA will not be accurate. In order to understand the function of this indicator, you have to know the functions of the EMA also.
The exponential moving average tends to give more priority to the recent price changes. So, expecting better results when the volatility is very high is a very risky approach to trade the market. Moreover, the MACD has some lagging issues compared to the EMA, so it is super important to use a trading method that focuses on the higher time frame only. What does MACD 12 26 Close 9 mean? When the DEMA-9 crosses above the MACD(12,26), this is considered a bearish signal. It means the trend in the stock – its magnitude and/or momentum – is starting to shift course. When the MACD(12,26) crosses above the DEMA-9, this is considered a bullish signal. Lets see this indicator on Chart.
When the blue line crossover red line it is good time to buy. As you see from the chart i put arrows where the crossover are appeared.
When the red line crossover blue line it is good time to sell or exit from position.
5 — WaveTrend Oscillator by LazyBear
This is a technical indicator that creates high and low bands between two values. It then creates a trend indicator that draws waves with highs and lows within these boundaries. WaveTrend is a widely used indicator for finding direction of an asset.
Calculation period: number of candles used to calculate WaveTrend, defaults to 10. Averaging period: number of candles used to average WaveTrend, defaults to 21.
As you see in chart when the lines crossover occured my strategy gives buy or sell signals.
═════════════════════════════════════════════════════════════════════════
█ HOW TO USE
I hope you understand how the indicators I mentioned above work and what they are used for. Now, I will explain in detail how to use the strategy I have created.
When you enter the settings section, you will see 5 types of indicators. If you want to use the signals of the indicators, simply tick the box next to the indicators. Also, under each option there is an area where you can set the "lookback". This setting is a field that will make the signals overlap when you select more than one option. If you are going to trade with only one option, you should make sure that this field is 0. Otherwise, it may continue to generate as many signals as you choose.
Lets see in chart for easy understanding.
As you see chart, if i chose only HARSI with lookback 0 (HARSI and CORAL should be 1 minumum because of algorithm-we looking 1 bar before, others 0 because we are looking crossovers), it will give signals only when harsı bar's color changed. But when i changed Lookback as 7 it will be like this in chart.
Now i will choose 2 indicator with settings of their lookback 0.
As you see it will give signals when both of them occurs same time. But HARSI is an indicator giving very early signal so we can enter position 5-6 bars after the first bar color change. So i will change HARSI Lookback settings as 7. Lets look what happens when we use lookback option.
So it wil be useful to change lookback settings to find best signals in each time period and in each symbol. But it shouldnt be too high. Because you can be late to catch trend's starting.
this is an image of MACD and WAVE trend used and lookback option are both 6.
Now lets see an example with 3 options are chosen with lookback option 11-1-5
Now lets talk about indicators settings. After strategy options you will see each indicators settings, you can change their settings as you desired. So each indicators signal will be changed according to your adjustment.
I left strategy options with default settings. You can change it manually as if you want.
═════════════════════════════════════════════════════════════════════════
█ LIMITATIONS: Don't rely on non-standard charts results. For example Heikin Ashi is a technical analysis method used with the traditional candlestick chart.Heikin Ashi vs. Candlestick Chart: The decisive visual difference between Heikin Ashi and the traditional chart is that Heikin Ashi flattens the traditional candlestick chart using a modified formula.
The primary advantage of Heikin Ashi is that it makes the chart more reader-friendly and helps users identify and analyze trends .
Because Heikin Ashi provides averaged price information rather than real-time price and reacts slowly to volatility — not suitable for scalpers and high-frequency traders. I added HARSI indicator as a supportive signal because it is useful with using CORAL and SSL channel indicators. If you change your candle types to Heikin Ashi , your profit will change in good way but dont rely on it.
═════════════════════════════════════════════════════════════════════════
█ THANKS:
Special thanks to authors of the scripts that i used.
@LazyBear and @ErwinBeckers and @JayRogers and @ToFFF
═════════════════════════════════════════════════════════════════════════
█ DISCLAIMER
Any trade decisions you make are entirely your own responsibility.

StochRSI + MA Strategy [Kintsugi Trading]What is the StochRSI + MA Strategy?
This premium indicator was inspired by my desire to find and place high probability forex trades in any market, direction, or time of day.
Why Forex?
The Forex markets operate 24 hours, 5.5 days a week
Access to meaningful leverage
Ability to easily trade long or short
High liquidity
How to use it!
----- First, start by choosing a Stop-Loss Strategy, Stop PIP Size, and Risk/Reward Ratio -----
- Stop-Loss Strategy
ATR Trail (No set Target Profit, only uses ATR Stop)
ATR Trail-Stop (Has set Target Profit, however, stop is based on ATR inputs)
Fixed PIP Size
**If you choose an ATR Stop-Loss Strategy - input the desired ATR period and Multiple you would like the stop to be calculated at**
**ATR Stop-Loss Strategies have a unique alert setup for Auto-Trading. See Auto-Trading Section**
- Stop PIP Size = How many PIPs will be representative of the max risk. i.e. - if you are risking $100 and you set the PIP stop to 10, that means 10 PIPs = $100.
- Risk/Reward Ratio = If you have a .5 risk/reward, it means you are risking $100 to make $50.
----- Next, we set the Session Filter. -----
Set the Timezone and Trade Session you desire. If no specific session is desired, simply set the Trade Session to 00:00 - 00:00.
----- Next, we set the Moving Average Cloud. -----
Enter the Moving Average Type:
Simple Moving Average
Exponential Moving Average
Hull Moving Average
Weighted Moving Average
Smoothed Moving Average
Double Exponential Moving Average
Triple Exponential Moving Average
Enter the fast, medium, and slow Moving Average Period you would like the Strategy to use. If you would like like to use (2) Moving Averages, simply set two of the Periods the same.
These inputs will determine whether the strategy looks for Long or Short positions.
**Boxes on the left of the fast, medium, and slow Moving Average Periods**
If you check any of these boxes, the strategy will ignore and set up where the price is trading below the checked moving average.
----- Next, we set the Stochastic RSI Parameters. -----
In combination with the Moving Average Cloud, the Stochastic RSI will help us determine when to take a trade and in what direction.
The strategy is essentially looking for small reversals going against the overall trend and placing a trade once that reversal ends and the price moves back in the direction of the overall trend.
The Stochastic RSI + MA Strategy utilizes confirmation between extreme RSI calculations and the overall trend as measured by (3) separate Moving Averages.
The Stochastic RSI is completely customizable by:
Long Entry Bar Cross Below
Short Entry Bar Cross Above
K
D
RSI Length
Stochastic Length
RSI Source
----- Finally, we backtest our ideas. -----
After using the 'Strategy Tester' tab on TradingView to thoroughly backtest your predictions you are ready to take it to the next level - Automated Trading!
This was my whole reason for creating the script. If you work a full-time job, live in a time zone that is hard to trade, or just don't have the patience, this will be a game-changer for you as it was for me.
Auto-Trading
When it comes to auto-trading this strategy I have included two options in the script that utilize the alert messages generated by TradingView.
*Note: Please trade on a demo account until you feel comfortable enough to use real money, and then please stick to 1%-2% of your total account value in risk per trade.*
AutoView
PineConnector
**ATR Auto-Trading Alert Setup**
How to create alerts on Stoch+MA Strategy
For Trailing Stops:
1) Adjust autoview/pineconnector settings
2) Click "add alert"
3) Select "Condition" = Strategy Name
4) Select "Order Fills Only" from the drop-down
3) Remove template message text from "message" box and place exact text. {{strategy.order.alert_message}}
4) Click "create"
For Fixed Pip Stop:
1) Adjust autoview/pineconnector settings
2) Click "add alert"
3) Select "Condition" = Strategy Name
4) Select "alert() function calls only"
5) I like to title my Alert Name the same thing I named it as an Indicator Template to keep track
Good luck with your trading!

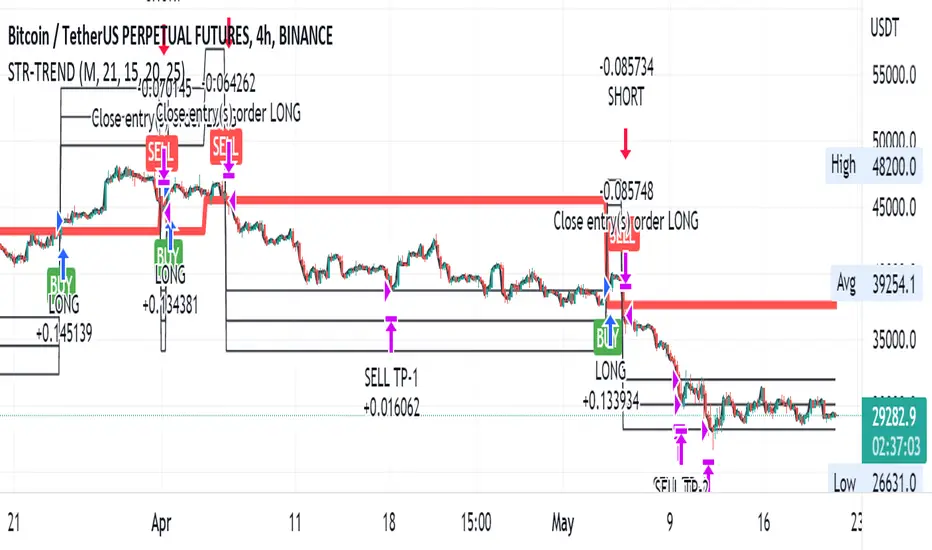
Straight Trend V1Hello everyone,
We are proud to present you our "Straight Trend" Strategy.
Strategy is use a specified timeline's opening price as reference and draw a line between the current price and trend line.
Trend line is smoothed with last X times of highest and lowest values ( Donchian Methodology) in order to create less noise and fake alerts , therefore creates a channel of current prices time based opening price.
The timeline can be adjusted according to your specifications in the settings.
------
Why opening price ?
We are traders ,no matter what we do ,we always make a benchmark at the end of a day , week or at the end of a specified time line.
Example :
X commodity's price increased %15 in last days or Y commodity's price dropped %30 in last 2 weeks etc. etc.
Thats why the opening price have a hidden and much more important role in our trading sessions.
------
After the channel is created we remove the unnecessary lines from our output by filtering the direction with closing price.
IF the closing price is higher than Chanel reference price and direction goes upward the script gives you a BUY signal.
The same methodology is applied for SELL operations.
When to Take Profit?
We put a setting for profit percentage in scripts setting you can adjust the ratio as your choices.
When to Stop Loss or change direction of the trade?
The Straight Trends previously mentioned channel's inverse line was set as STOP LOSS and direction changer in the strategy with "STR-X" Marker.
Note : Strategy is much more effective with heikin-ashi bars due methodology of heikin ashi and with this bars it creates less signals with more accuracy, use at your own discretion.
Please don't hesitate to write us if you need support or assistance, we also appreciate your feedbacks.
Please be advised that this strategy is published with Educational Purposes and it is not a investment advice.
Thank you in advance.
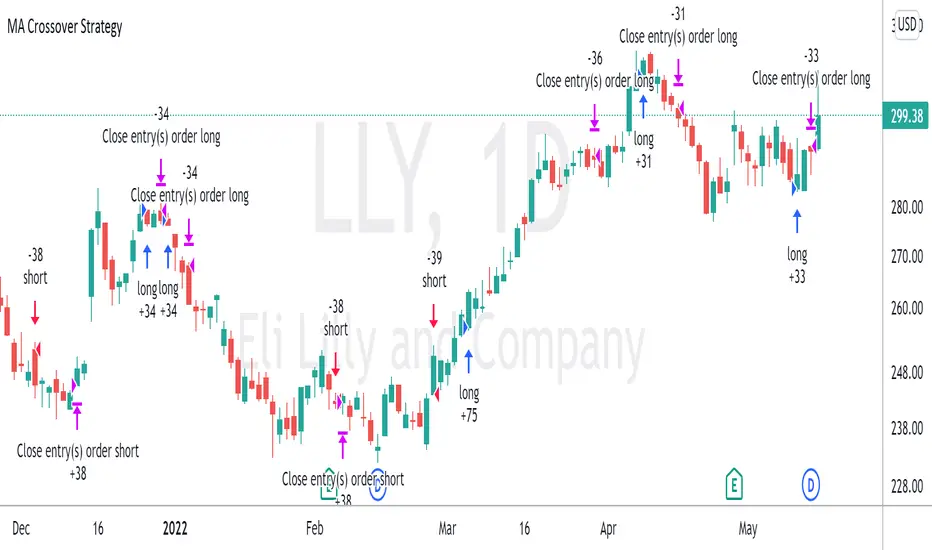
Moving Average Crossover StrategyThe Moving Average Crossover indicator uses 3 moving averages (2 simple moving averages and 1 exponential moving average ) to signal long and short opportunities based on moving average crossovers. This strategy serves as a backtest to that indicator. By taking entry and exit positions based on moving average crossovers, we are able to project profit with this script. You are given the option to select which moving average crossings trigger entry and exit signals. Fast refers to an EMA which should be your shortest MA. Slow refers to the first SMA which will serve as a signal line. Trend refers to a long SMA which will help determine if you should take long positions or short. You can also filter by extra conditions such as minimum volume or RSI. For example, you may have the script trigger a buy signal if the 5ema crosses the 20 sma while RSI reads 60 and sell if it crosses again.
This strategy starts with $100,000 and uses 10% of the account per trade.
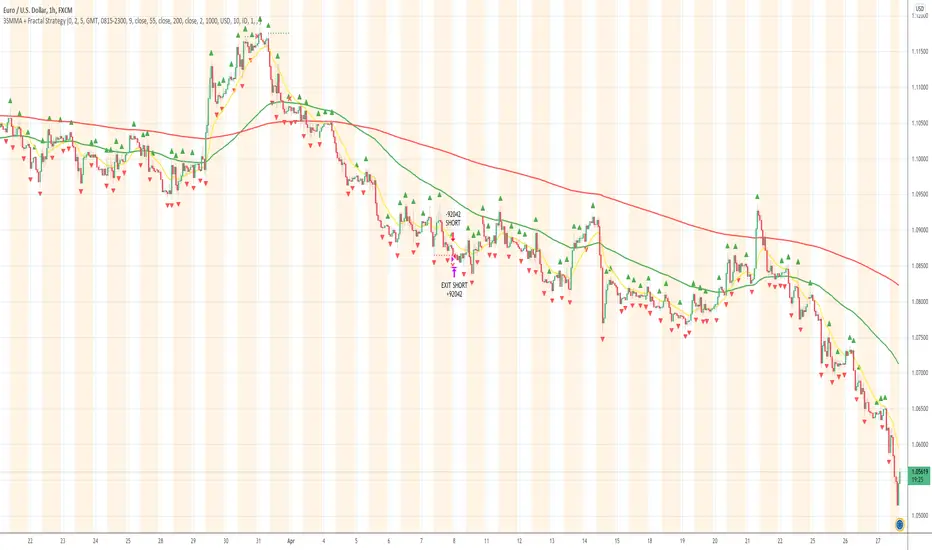
3SMMA + Fractal Strategy [Kintsugi Trading]What is the 3SMMA + Fractal Strategy?
This premium indicator was inspired by my desire to find and place high probability forex trades in any market, direction, or time of day.
Why Forex?
The Forex markets operate 24 hours, 5.5 days a week
Access to meaningful leverage
Ability to easily trade long or short
High liquidity
How to use it!
----- First, start by choosing Breakout Additional PIP Size, Stop Additional PIP Size, and Target Profit (TP) PIP Size. -----
- Breakout Additional PIP Size = Additional PIPs beyond the default strategy entry point.
- Stop Additional PIP Size = The default stop is above/below the signal candle, depending on trade direction. This input allows the user to target more or less PIPs as a stopping-out point.
- Target Profit (TP) PIP Size = Number of PIPs set at a target profit.
----- Next, we set the Session Filter. -----
Set the Timezone and Trade Session you desire. If no specific session is desired, simply leave the box unchecked.
----- Next, we set the Length of the 3 Smoothed Moving Averages. -----
Enter the Desired Moving Average Length:
Length 1 - Source
Length 2 - Source
Length 3 - Source
These inputs will determine whether the strategy looks for Long or Short positions.
----- Next, we set the Fractal Periods. -----
This user input re-programs the strategy to only allow for 'n' number of lower or higher candles on either side of a fractal signal.
For example: If the user inputs "5" for the number of Periods, Fractal indicator signals will only appear on candles with "5" candles higher or lower on both sides of the signal candle.
In combination with the 3 Smoothed Moving Averages, the Fractal signals help us determine when to take a trade and in what direction.
The strategy is essentially looking for trades going with the overall trend and placing potential trades after a low has been reached and is re-tested in the overall trend direction.
----- Finally, we backtest our ideas. -----
After using the 'Strategy Tester' tab on TradingView to thoroughly backtest your predictions you are ready to take it to the next level - Automated Trading!
This was my whole reason for creating the script. If you work a full-time job, live in a time zone that is hard to trade, or just don't have the patience, this will be a game-changer for you as it was for me.
Auto-Trading
When it comes to auto-trading this strategy I have included two options in the script that utilize the alert messages generated by TradingView.
*Note: Please trade on a demo account until you feel comfortable enough to use real money, and then please stick to 1%-2% of your total account value in risk per trade.*
AutoView
PineConnector
Good luck with your trading!
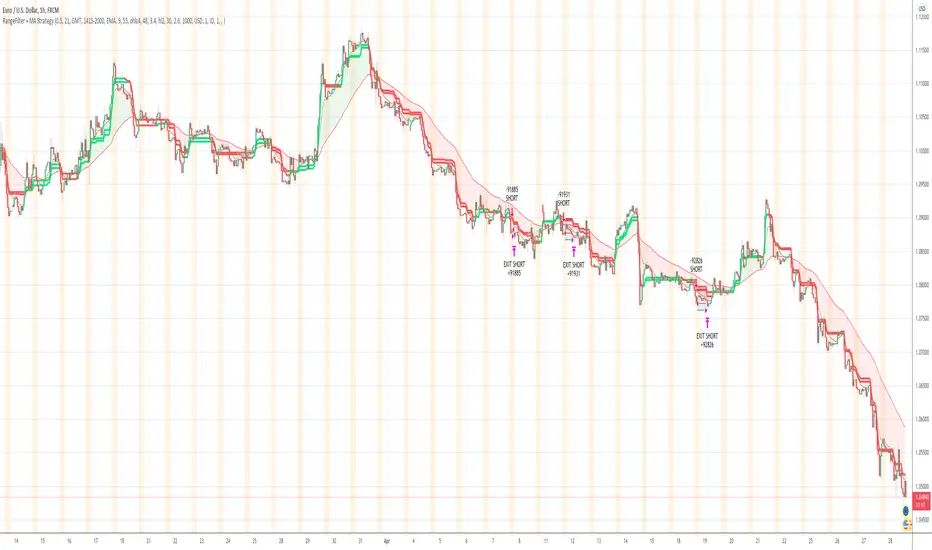
Range Filter + MA Strategy [Kintsugi Trading]What is the Range Filter + MA Strategy?
This premium indicator was inspired by my desire to find and place high probability forex trades in any market, direction, or time of day.
Why Forex?
The Forex markets operate 24 hours, 5.5 days a week
Access to meaningful leverage
Ability to easily trade long or short
High liquidity
How to use it!
----- First, start by choosing a Risk/Reward Ratio and Stop PIP Size. -----
- Risk/Reward Ratio = If you have a .5 risk/reward, it means you are risking $100 to make $50.
- Stop PIP Size = How many PIPs will be representative of the max risk. i.e. - if you are risking $100 and you set the PIP stop to 10, that means 10 PIPs = $100.
----- Next, we set the Session Filter. -----
Set the Timezone and Trade Session you desire. If no specific session is desired, simply leave the box unchecked.
----- Next, we set the Moving Average Cloud. -----
Enter the Moving Average Type:
Simple Moving Average
Exponential Moving Average
Hull Moving Average
Weighted Moving Average
Smoothed Moving Average
Enter the fast and slow Moving Average Period.
These inputs will determine whether the strategy looks for Long or Short positions.
----- Next, we set the Range Filters. -----
In combination with the Moving Average Cloud, the Range Filter will help us determine when to take a trade and in what direction.
The strategy is essentially looking for small reversals going against the overall trend and placing a trade once that reversal ends and the price moves back in the direction of the overall trend.
The Range filter utilizes confirmation between two entirely separate Range Filter calculations (or set them both equal to use one).
Each Range Filter is completely customizable by:
Source Calculation (open, high, low, close, hl2, hlc3, ohlc4, hlcc4)
Sampling Period
Range Multiplier
----- Finally, we backtest our ideas. -----
After using the 'Strategy Tester' tab on TradingView to thoroughly backtest your predictions you are ready to take it to the next level - Automated Trading!
This was my whole reason for creating the script. If you work a full-time job, live in a time zone that is hard to trade, or just don't have the patience, this will be a game-changer for you as it was for me.
Auto-Trading
When it comes to auto-trading this strategy I have included two options in the script that utilize the alert messages generated by TradingView.
*Note: Please trade on a demo account until you feel comfortable enough to use real money, and then please stick to 1%-2% of your total account value in risk per trade.*
AutoView
PineConnector
Good luck with your trading!
MATIC/USD 1H Bot for 3commas (works w/o 3commas too)This is a MATIC/USD or USDT specific implementation of my BNB/USD 1 hour bot. It should work out of the gate correctly for MATIC, at least based on what has been happening with it for the past seven weeks. You can fiddle with the following settings using the gear icon:
Fast and slow MACD length
The decision to use RSI thresholds as requirements for buys and/or sells, as well as the chart timeframe to use for that (make sure you use the same timeframe as your chart or a higher timeframe. You don't want to use a 1m RSI on a one hour chart but you can use a 4 hour RSI on a 1 hour chart with no issues.)
Buy and/or sell RSI threshold limits
Trailing stop loss %
Start date (for backtesting, I usually leave mine with 1-2 months trailing as those are usually better indicators than how they would have performed over the past few years)
Stress levels
Moving Average length and type
Linear regression amount
The gist of this bot is that it will use a smoothed EMA to make informed buys and sells. The smoothing prevents most noise from affecting your orders. It also allows you to set a trailing stop loss. If you don't want to use this feature set the value to 100 and it will effectively disable it.
Finally, you can disable RSI threshold point visibility. This won't affect bot operation, it just makes it cleaner to look at on your chart. Disabling RSI buys or sells will also disable visibility.
This bot takes a shotgun strategy to buys and sells. It makes a lot of buys and the majority of them are closed with little to no movement up or down. However, the ones that are profitable make a LOT as you will see once you start testing.
I make the full version of these bots available (though the script is protected) so users can test them, however if you want to use it with 3commas you will need access to the full script. Message me if you want the code and we can figure something out.

Intraday Grid trading exampleHello everyone,
This was a grid trading example for intraday trading.
Please be advised that every commodity have diferent kind of reaction and rate of change between periods therefore the percentages need to be adjusted acording to the commodities change %.
In order to specify the adjustment rate we add the Zig Zag in the script.
For Example ;
Last 3 days zigzag high points are %25 , %13 and %8 , the average %is about %9 therefore you have to put the adjustment ratios something like;
Z%1 = %3
Z%2 = %6
Z%3 = %9
Feel free to use the script with caution( it was not a investment advice), this was only a example of grid trading strategy on our trading platform.
Regards.
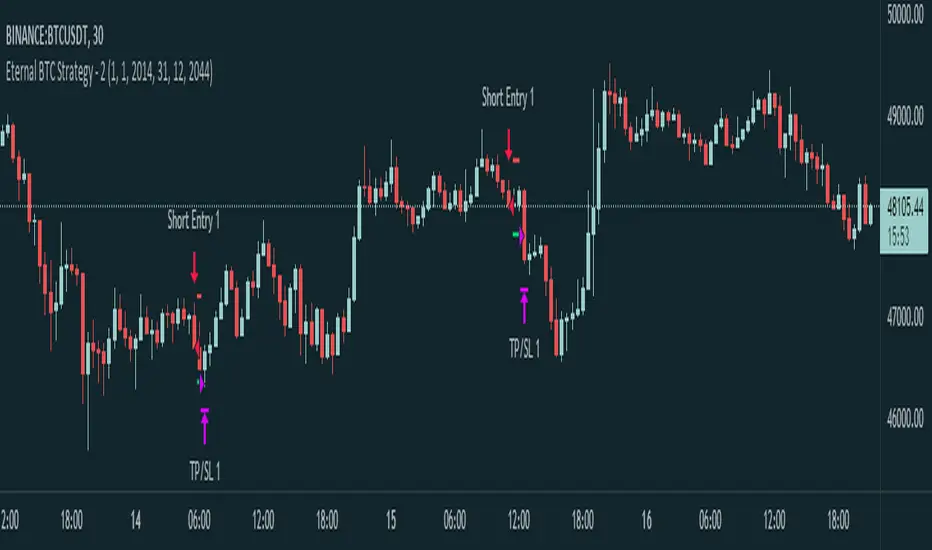
Eternal BTC Strategy - 2This is a summary of how this strategy works.
- Momentum, Volatility detection:
1. First of all detects market momentum
2. Uses volume indicators to make sure of the movement existence
- Trade execution:
3. Uses crossovers of some MAs
4. After crossovers, waits for trend analysis indicators signals to trigger the order
- Take profit & Stop loss:
5. Calculates SL and TP using a formula (combined of volume , MAs and others)
* This is just a simple representation of how this strategy works, It's coded in about a 2000 lines script.
This strategy works best on Bitcoin / TetherUS • BINANCE
No setting is needed to be applied by you, you'll just simply add the script and receive alarms.
Alarms are included opening of the trade, TP and SL touch.
BTC Strategy - EternalThis is a summary of how this strategy works.
- Momentum, Volatility detection:
1. First of all detects market momentum
2. Uses volume indicators to make sure of the movement existence
- Trade execution:
3. Uses crossovers of some MAs
4. After crossovers, waits for trend analysis indicators signals to trigger the order
- Take profit & Stop loss:
5. Calculates SL and TP using a formula (combined of volume , MAs and others)
* This is just a simple representation of how this strategy works, It's coded in about a 2000 lines script.
As you can see, it has a great performance, 71.59% win rate in 989 trades so it's a very confident result.
This strategy works best on Bitcoin / TetherUS • BINANCE
No setting is needed to be applied by you, you'll just simply add the script and receive alarms.
Alarms are included opening of the trade, TP and SL touch.

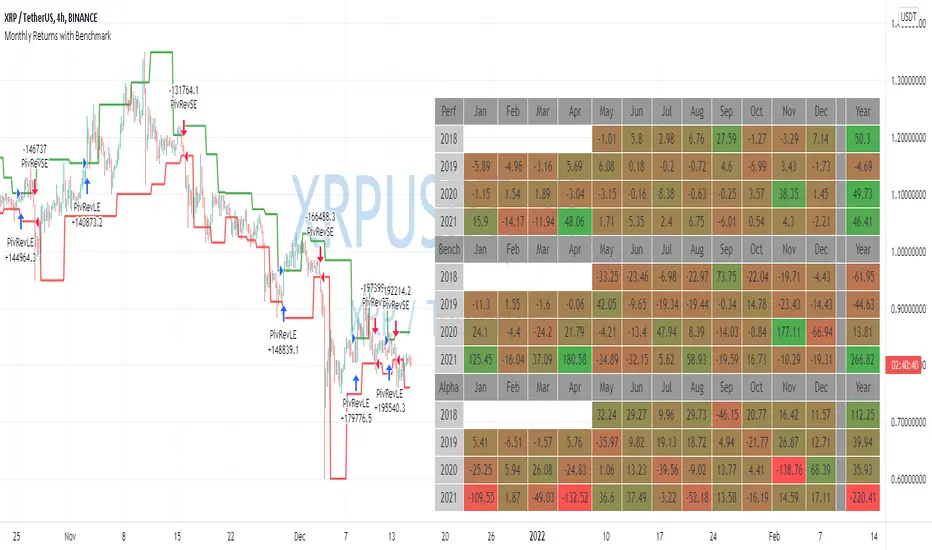
Monthly Returns with BenchmarkI keep working on trying to make TradingView strategies look fancier.
A few months ago I published the first version of the Monthly Returns for Strategies in Pine Script. I received quite a lot of good feedback and quite a lot of requests to update it.
This is a more advanced version of the Monthly Returns, in it, you can:
Display monthly returns of your strategy, benchmark, and alpha over this benchmark.
Select benchmark to be another instrument
Select the date from which you want to compute monthly returns
Show/hide benchmark and alpha
Choose colors for gradient for gain/loss values
Use it with any type of strategy
Use it with replay
I hope it will be useful for you.
It's not about the strategy itself but the way you display returns on your chart. So pls don't critique my choice of the strategy and its performance 🙂
Disclaimer
Please remember that past performance may not be indicative of future results.
Due to various factors, including changing market conditions, the strategy may no longer perform as well as in historical backtesting.
This post and the script don’t provide any financial advice.
Fractal Corridors BacktestFractal Corridors is a strategy developed a used by Vladimir Poltoratskiy. You can learn about this in his books from the series Trading Code Is Open which I recommend reading.
The strategy allegedly works best in a high-liquidity environment with little to no impactful events. The author likes to trade EURUSD, Copper, and USDCAD, I think, was another pair.
Logic is based on his 3-bar fractals and their fractures as they come. Basically, if the fractal level gets broken by a certain number of ticks (usually 6 - 14% Average Daily Range), a corridor is built and stop-market entry will be filled.
There are other rules you will find in the book. Most importantly - avoid trading during events and extremely choppy symbols which seem to follow no logic.
Lastly, the script includes 5 different definitions of Fractal Corridor. I think Mode 5 is the correct one but I was unable to confirm that exactly as it gets a little tricky. I am willing to disclose this part of the code to other Pinecoders, but it will not be available for everyone, because that could discourage people from getting the book.
Thanks to @mincho1010 for help with testing different versions as I worked on the script.
Have a good day!
TradePro's Trading Idea Cipher Divergence EMA Pb StrategyHere I present you on of Trade Pro's Trading Idea: Cipher B+ Divergence EMA Pullback Strategy.
Optimized the crypto pairBTC/USDT in the 30 minute chart.
There is the possibility to switch between short and long positions.
You can choose between 2 different take profit/stop loss types: The Lowest Low/ Highest High Stop Loss/ Take Profit and the ATR Take Profit/ Stop Loss.
-----------------------------------------------------------------------------------
How does the strategy work?
ENTRY
Long
The price must be above the 200 EMA .
The price needs to make a pullback into the 50 EMA .
Right after that, the Cipher B indicator must give a buy signal, it must be below the zero line and the Money Flow cloud must be green.
Short
Contrary to the premise of long positions.
EXIT
Lowest Low/ Highest High Exit
The Lowest Low (long) / highest high (short) serves as the stop loss. The TP is formed on the basis of a factor.
(Long for example: *Lowest Low* multiplied by *Profitfactor* = TP).
ATR Exit
The value of ATR at the time of buying is multiplied by the value entered in "Profit factor ATR" and "Stop factor ATR". As soon as the price reaches this value, it is closed.
Important
The script must be optimized for each coin or currency pair. However, only the values for the profit factor, the stop loss and Lowest Low / Highest High are relevant.
Also, by changing the Chanel Length and the Chanel Average, you can create strong profit changes.
The results of the strategy are without commissions and leverage.
If you have any questions or feedback, please let me know in the comments.
If you need more information about the strategy and want to know exactly how to apply it, check out my profile. There I have created a tutorial for the function of the script.

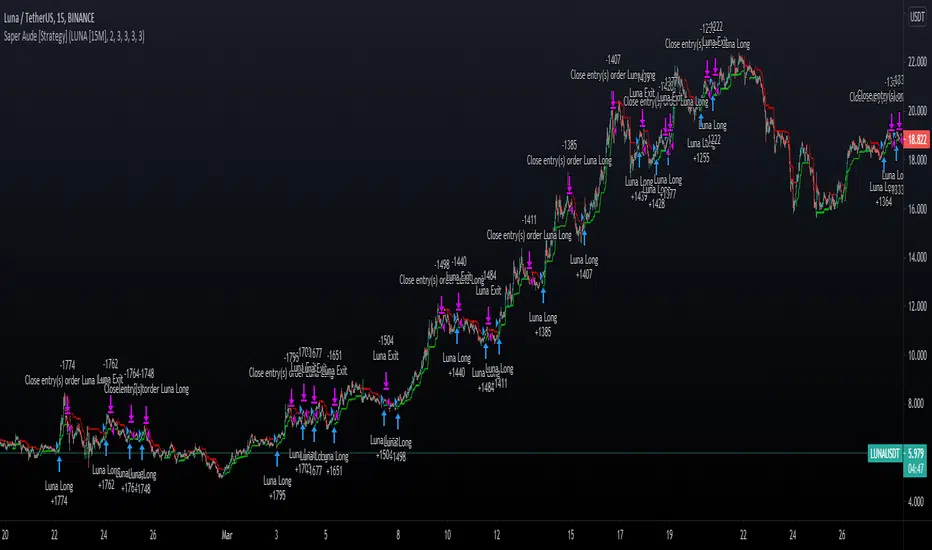
Saper Aude [Strategy]Sapere Aude Strategy
Trend based scalping strategy, to work on lower timeframes (15Minute - 1 Hour)
Calculations on ATR, strategy uses extra conditions to help filter out bad trades.
How to use the strategy?
Simple as when green line shows below, that can be either a good entry point or a signal to start building limit orders on the plot.
I use the ATR as a trailing stop loss for exit.
vica versa for entering shorts. The strategy is only set up to take long positions though.
This is a great scalping strategy for bots in Ranging or up trending markets.
This scripts has 5 variations built within it which are fitted for certain coins & their timeframes
The coins included are
BTC/USDT 1 Hour
ETH/USDT 1 Hour
ADA/USDT 30 Minutes
DOGE/USDT 15 Minutes
LUNA/USDT/15 Minutes
The Strategy backtest results includes Fess and there is NO Repaint! The script is written in Version 4
There is an option in the settings cog to choose from the 5 coins and their timeframes where they have been optimised
There is also an option to change the backtesting range
The stop Losses are also adjustable and listed under the settings
The strategy performs best on the Binance listings
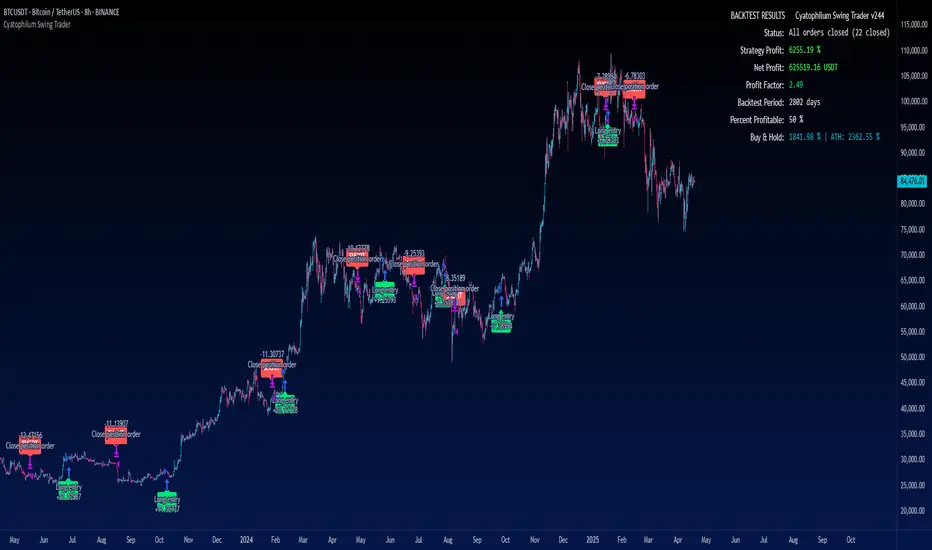
Cyatophilum Swing Trader [BACKTEST]This is an indicator for swing trading which allows you to build your own strategies, backtest and alert. This version is the backtest which allows to use the Strategy Tester. The alert version can be found in my profile scripts page.
The particularity of this indicator is that it contains several indicators, including a custom one, that you can choose in a drop down list, as well as a trailing stop loss and take profit system.
The current indicators are :
CYATO AI: a custom indicator inspired by Donchian Channels that will catch each big trend and important reversal points .
The indicator has two major "bands" or channels and two minor bands. The major bands are bigger and are always displayed.
When price reaches a major band, acting as a support/resistance, it will either bounce on it or break through it. This is how "tops" and "bottoms", and breakouts are caught.
The minor bands are used to catch smaller moves inside the major bands. A combination of volume, momentum and price action is used to calculate the signals.
Advantages of this indicator: it should catch top and bottoms better than other swing trade indicators.
Cons of this indicator: Some minor moves might be ignored. Sometimes the script will catch a fakeout due to the Bands design.
Best timeframes to use it : 2H~4H
Sample:
Other indicators available:
SARMA: A combination of Parabolic Stop and Reverse and Exponential Moving Average (20 and 40) .
SAR: Regular Parabolic Stop and Reverse .
QQE: An indicator based on Quantitative Qualitative Estimation .
SUPERTREND: A reversal indicator based on Average True Range .
CHANNELS: The classic Donchian Channels .
More indicators might be added in the future.
About the signals: each entry (long & short) is calculated at bar close to avoid repainting. Exits (SL & TP) can either be intra-bar or at bar close using the Exit alert type parameter.
STOP LOSS SYSTEM
The base indicators listed above can be used with or without TP/SL.
TP and SL can be both turned on and off and configured for both directions.
The system can be configured with 3 parameters as follows:
Stop Loss Base % Price: Starting Value for LONG/SHORT stop loss
Trailing Stop % Price to Trigger First parameter related to the trailing stop loss. Percentage of price movement in the right direction required to make the stop loss line move.
Trailing Stop % Price Movement: Second parameter related to the trailing stop loss. Percentage for the stop loss trailing movement.
Another option is the "Reverse order on Stop Loss". Use this if you want the strategy to trigger a reverse order when a stop loss is hit.
TAKE PROFIT SYSTEM
The system can be configured with 2 parameters as follows:
Take Profit %: Take profit value in percentage of price.
Trailing Profit Deviation %: Percent deviation for the trailing take profit.
Combining indicators and Take Profit/Stop Loss
One thing to note is that if a reversal signal triggers during a trade, the trade will be closed before SL or TP is reached.
Indeed, the base indicators are reversal indicators, they will trigger long/short signals to follow the trend.
It is possible to use a takeprofit without stop loss, like in this example, knowing that the signal will reverse if the trade goes badly.
The base indicators settings can be changed in the "Advanced Parameters" section.
Configuration used for this snapshot:
BACKTEST SETTINGS
· Initial Capital: 10 000 $
· Order Size: 10% equity (to avoid compounding effect)
· Commission : 0.1% per order (total commission paid: 244.41 €)
· Slippage: 5 ticks
Oldest trade: 2014-04-01
Backtest Period: From 2014-04-01 to 2020-09-04
Use the link below to obtain access to this indicator.
Tradespot Quant - Strategy & AlertsTradespot - Quant is an extensive trading algorithm, signal generator and technicals screener packed into one beautifully designed, functional indicator. The script is very customisable to not limit the trader using it but does have some very respectable default settings for BTCUSD on the 4H and 15M charts that we run in an automated fashion here a Tradespot round the clock on Binance Futures.
What does Tradespot Quant do?
Trade following signals generated via our bespoke algorithm
Full customisation to allow a deeper use of the indicator across different assets
Full risk management with take profit and stop loss levels (configurable) built in
Presets for BTCUSD & ETHUSD on the 4H/15M timeframes avaliable instantly for your use.
Innovative trade panel that illustrates key information such as what trade the algorithm is looking for next
More features being added all the time, we have great ideas and our only limitation is how fast we can program it!
Cornix compatible alerts - with the easiest of configurations you can automate this execution of this strategy.
Do you do a free trial?
Yes! Get in touch for a complimentary 48 hour free trial to the indicator, no strings attached.
Who are you?
Tradespot has been creating scripts for years on TradingView that we use to leverage our social trading and signal group offerings. We currently have over $200K in assets trading with our strategies across over 300 users.
You can learn more about us on our website. Please reach out to me or see the link on our profile.
Breakout Trend Follower StrategyThis strategy goes long when highs are broken and uses a trailing stop that follows swing lows. User can configure a back test date range and choose whether or not to only take trades above a selected moving average.
The desire for me to make this script was to try to capture those extreme breakouts that can occur after a consolidation/equilibrium pattern. This catches those using stop-buys as the entry. Out of all the scripts I have made thus far, this one is the one that has the best results. Time frames might vary due to commission structures, etc. I currently use this strategy on stocks on the 30-min time frame and crypto (with Coinbase's high fees) on the 2-hr time frame.

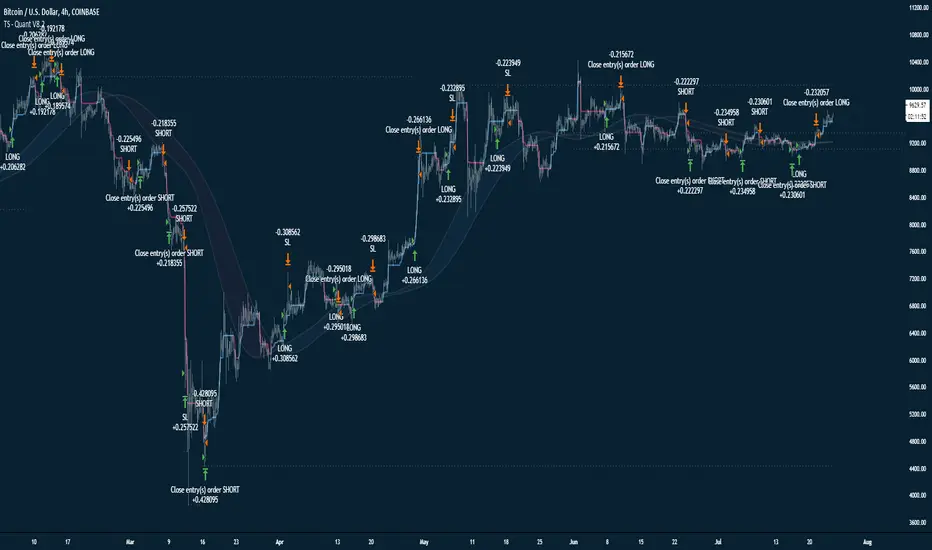
TS - Trading Algorithm Strategy - Crypto, Forex & StocksWhat does the TS - Algorithm do?
-- Plots trend following, high probability signals.
-- These signals do not repaint and can be used confidently to enter or exit a trade.
What markets can this indicator be used on?
-- Forex
-- Stocks
-- Commodities
-- Cryptocurrencies
What time-frames can this indicator be used on?
-- This indicator can be used on 1m, 3m , 5m, 10m, 15m, 30m, 1hr, 2hr, 3hr, 4hr, 6hr, 8hr, 12hr, Daily, Weekly, Bi-Weekly and Monthly time-frames.
-- This is a trend following algorithm, so low as there is good volume , volatility and price history of an asset, the model can perform.
Does this indicator repaint?
-- No
Premium Tradespot Script - Trial access and Information
-- Trial access offered
-- PM me directly to request trial access to the scripts or for more information.

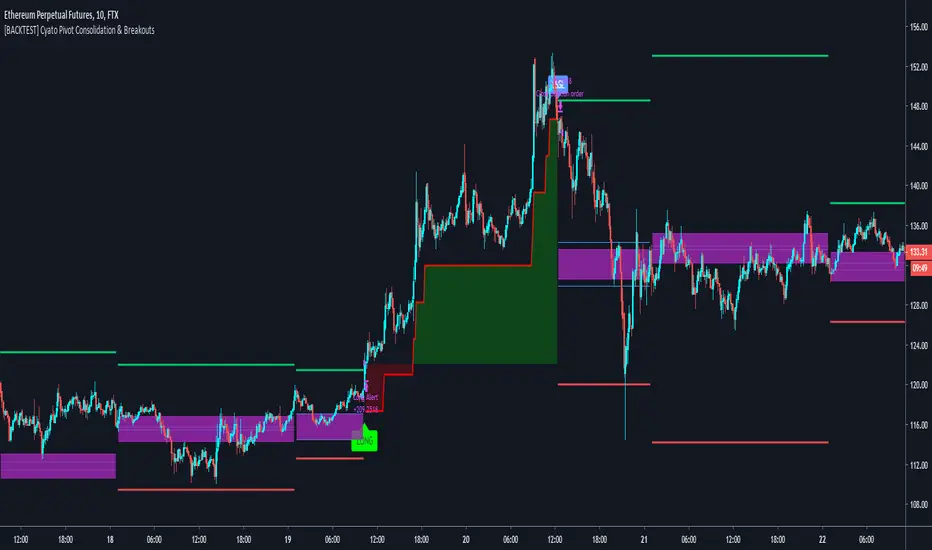
Cyatophilum Pivot Consolidation & Breakouts [BACKTEST]Intraday Strategy built on Pivot Points Standard and Pivot Range.
The idea is to wait for a consolidation period AND a breakout. This really strong condition allows to set a 1/1 Risk/Reward ratio.
Starting from there we secure the profits with a Trailing Stop loss and/or Take Profit system integrated in the script.
This is the Backtest version and you can see the results below. Default settings work great on the 15m chart.
You can change the timeframe of the pivot points as well as the consolidation band in the settings. The SL/TP system is also configurable. This script includes a DCA feature.
To get the indicator, please use the link below, thanks!