Buscar en scripts para "technical"

Pivot Points (with Mid-Pivots)Brief Description
Pivot points are horizontal support and resistance lines placed on a price chart. They make strong levels of support and resistance because banks, financial institutions and many traders use them.
The indicator is set to the Daily Pivot Range by default (no support for weekly, monthly, quarterly, or yearly Pivots).
Indicator Settings
Show Mid-Pivots?
Show R3 and S3 levels?

Adjustable Starting VWAPIn this script it's possible adjust the start where the VWAP (technically is a VWMA) starts to calculate.
Use this to try to show where is the suport and resistance.
I coded 6 lines.
Use low sources for suport.
Use high sources for resistance.
Stochastic + Stochastic RSIJust a basic indicator I rigged up to help reduce screen real estate that ended up providing more insight than expected; overlays both the stochastic and stochastic RSI. While I initially made this to save space, I've begun to pick up on some interesting patterns in cryptocurrencies based on the divergence of stochastic from the stochastic RSI, and the comparison of their swing lows.
Left all settings modifiable, since this is simply a combination indicator I've left the source code open unlike other proprietary indicators I use.
Happy trading!
Austin Doyle
CTO
Crypto Playhouse

Donchian Channel Width The Donchian Channel was developed by Richard Donchian and it could be compared
to the Bollinger Bands. When it comes to volatility analysis, the Donchian Channel
Width was created in the same way as the Bollinger Bandwidth technical indicator was.
As was mentioned above the Donchian Channel Width is used in technical analysis to measure
volatility. Volatility is one of the most important parameters in technical analysis.
A price trend is not just about a price change. It is also about volume traded during this
price change and volatility of a this price change. When a technical analyst focuses his/her
attention solely on price analysis by ignoring volume and volatility, he/she only sees a part
of a complete picture only. This could lead to a situation when a trader may miss something and
lose money. Lets take a look at a simple example how volatility may help a trader:
Most of the price based technical indicators are lagging indicators.
When price moves on low volatility, it takes time for a price trend to change its direction and
it could be ok to have some lag in an indicator.
When price moves on high volatility, a price trend changes its direction faster and stronger.
An indicator's lag acceptable under low volatility could be financially suicidal now - Buy/Sell signals could be generated when it is already too late.
Another use of volatility - very popular one - it is to adapt a stop loss strategy to it:
Smaller stop-loss recommended in low volatility periods. If it is not done, a stop-loss could
be generated when it is too late.
Bigger stop-loss recommended in high volatility periods. If it is not done, a stop-loss could
be triggered too often and you may miss good trades.

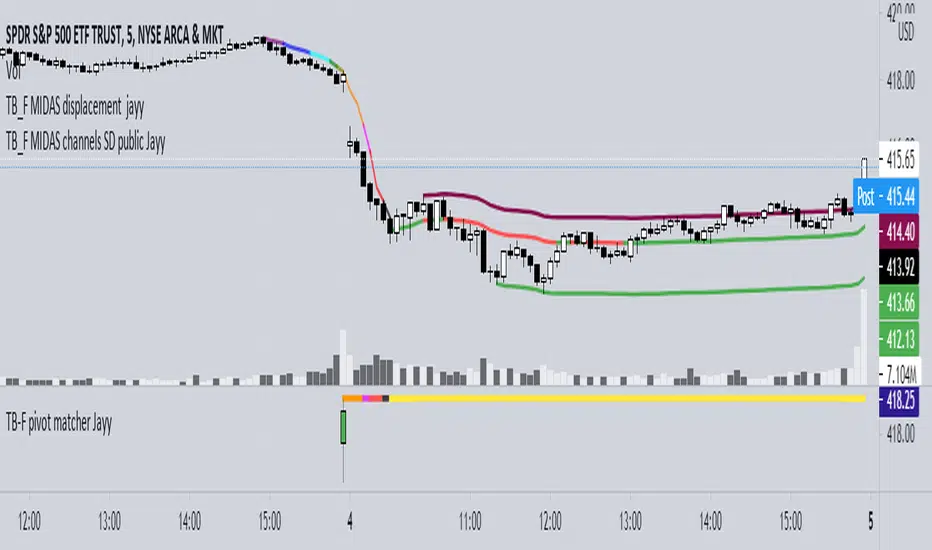
Top Bottom Finder Public version- Jayy This script plots a 6 algos from the Coles/Hawkins "Midas Technical Analysis" book:
Top finder / Bottom Finder (Levine Algo by Bob English)* - onlinelibrary.wiley.com
MIDAS VWAP Gen-1) -
MIDAS VWAP average and deltas
VWAP (Gen-1) using a date or a bar n number can be initiated at bar 0 - useful for a new IPO
Standard Deviation of MIDAS VWAP
MIDAS Displacement Channels (Coles) - edmond.mires.co
An%20Anchored%20VWAP%20Channel%20For%20Congested%20Markets.pdf
* for better results with topfinder and bottomfinder use the companion TB-F Matcher script.
See wiki for a synopsis: en.wikipedia.org
Relevant info can be found in: Midas Technical Analysis: A VWAP Approach to Trading and Investing in Today’s Markets by
Andrew Coles, David G. Hawkins Copyright © 2011 by Andrew Coles and David G. Hawkins.
Appendix C: TradeStation Code for the MIDAS Topfinder/Bottomfinder Curves ported to Tradingview
This script requires a working understanding of "Midas Technical Analysis" Google "Midas Technical Analysis" and a variety of information will appear.
To find fit the curve as described in the Midas book a companion script is required that will after a few manual iterative inputs guide you to the appropriate D value for the for input into this program ( see the TB-F Matcher script). You might also try the Midas average and Deltas as described in the book. I have added the 2nd, 3rd and 4th multiples of Delta.
The advantage is that there is no curve fitting. You still need to select a starting point for Midas or the topfinder bottomfinder (TB_F)
or the VWAP.
////////////////////////////////////////////////////////////////////////////////////////////////////////////////////////////
See the notes in the script below
Cheers Jayy
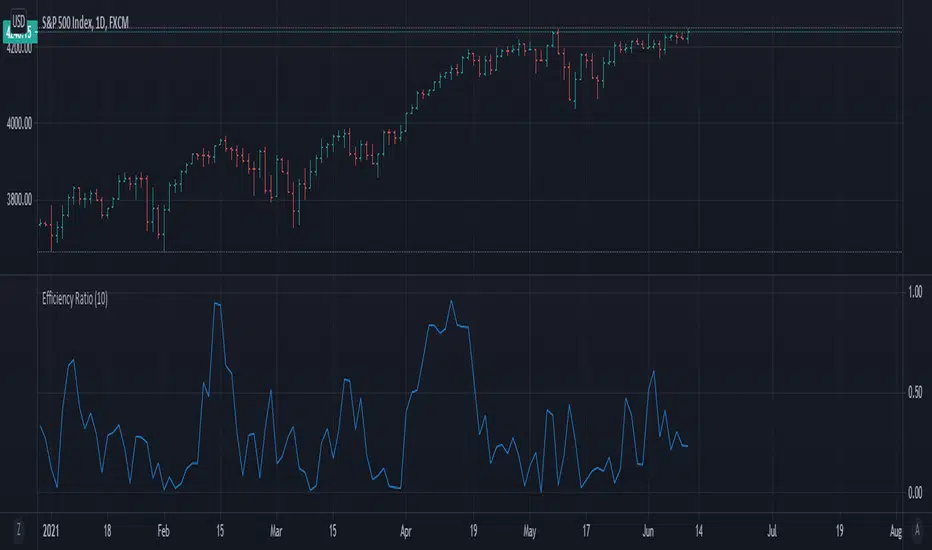
Efficiency Ratio (Kaufman)or "Generalized fractal efficiency"
Measures price trend effectiveness. Where 1.00 is trending and 0.00 not.
Calculation:
ER = Change / Sum of absolute changes
where "Change" is a price change over specified period and "Sum of Changes" sum of absolute price movements within that period
As an example, to calculate 5-day ER you have to calculate 5-day change and then calculate absolute sum of each day movements:
5-day ER = 5-day change / (|day 1 change| + |day 2 change| + |day 3 change| + |day 4 change| + |day 5 change|)
Source: www.marketvolume.com
Price Volume Rank [LazyBear]Price-Volume Rank, designed by Anthony J. Macek, compares the direction of the change in price (up or down) to the direction of the change in volume and assigns a number to that specific relationship. By quantifying price/volume interaction, P-V rank seeks to determine our position within a typical market cycle.
The various modes shown on the chart above or explained below. Also, read on for a little trick using the new Pine feature that you can use in your script.
How to read the PVR?
-------------------
The most desirable market condition occurs when both price and volume are moving up, that phenomenon is assigned a PVR of 1.
The next most desirable condition, when prices are still moving up but volume is diminishing, is given a PVR of 2. Although still technically healthy, this relationship between price and volume issues a warning that market momentum is weakening.
The worst-case scenario, seen when selling pressure is greatest with prices dropping and volume
increasing, is given PVR's weakest designation, 4.
Finally, even though prices are still moving down, volume begins to diminish as selling pressure abates. This price/volume relationship is assigned a PVR of 3, often alerting us to a potential buying opportunity ahead.
What do the modes mean?
----------------------
1) Histogram Mode: This plots PVR along with helpful ranges. Be careful when PVR is trending at turn-around points.
2) MA Crossover Mode: This plots a slow/fast MA of PVR. Default is 5/10 SMA. Buy is signalled when slow MA falls below fast MA. Sell is signalled when slow MA crosses up fast MA. There is a warning line at 2.5 that can be used for more confirmation.
3) Double Smoothed Crossover Mode: Same as MA crossover, but PVR is smoothed more. Warning line (2.5 level) is very useful in this mode. Use slow MA as the signal and fast MA of PVR for tracking the market.
Misc notes:
-----------
This won't work for Forex and other instruments for which TradingView doesn't expose volume. Thanks to the new Text rendering feature of PlotShape(), I can actually let users know of that :) Good use-case, eh? I will post a sample chart below in the comments.
Feel free to use any part of this code in your indicators.
More info:
--------
Stocks & Commodities V. 12:6 (235-239): Price-Volume Rank by Anthony J. Macek
Complete list of my indicators:
-----------------------------
docs.google.com

Trade Archer - Moving Averages - v1A group of four moving averages used for price smoothing. It also creates a cloud between Fast Ma and Medfast MA, Medfast MA and Medslow MA, and Medslow MA and Slow MA. Originally only Exponential Moving Averages were available, however the option to choose SMA, EMA (default), RMA, WMA, and VWMA were added. Also added was the option to choose the source of input. If any interesting additions are added, please let me know so I can update the script.

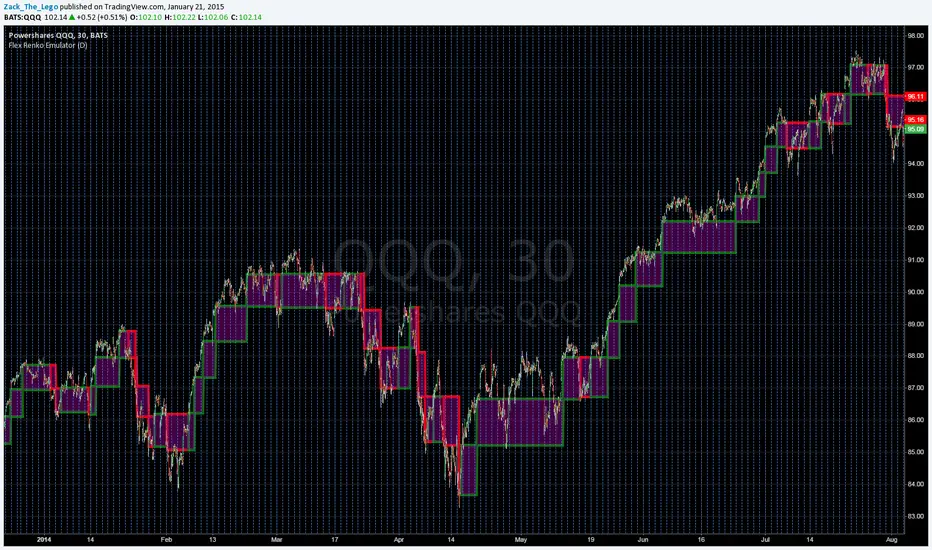
Flex Renko Emulatorupdate:
As far as my algorithm design will take me this is it. So It's complete in my eyes. Here is a "working" version of something I've been looking for for a long time: "Flex" Renko Charting.
Bricks' sizes are determined by ATR and are set by simply choosing a resolution for the ATR calculation. No need to go in and choose renko granulation(resolution) AND brick size. Renko granulation is current chart resolution. Feel free to send me feedback on how to manage the reversal bricks' calculation or any other thoughts and ideas.
Replace the "close" in the main body of the renko calculation with 'high' and 'low' to get more consistent paintings across different aggregations since renkos aren't technically based off closing prices but where the price has been. Of course it's all a matter of preference:
Brick1 = high >
nz(Brick1) + BrickSize ? nz(Brick1) + BrickSize : low <
nz(Brick1) - BrickSize ?
nz(Brick1) - BrickSize
: nz(Brick1)
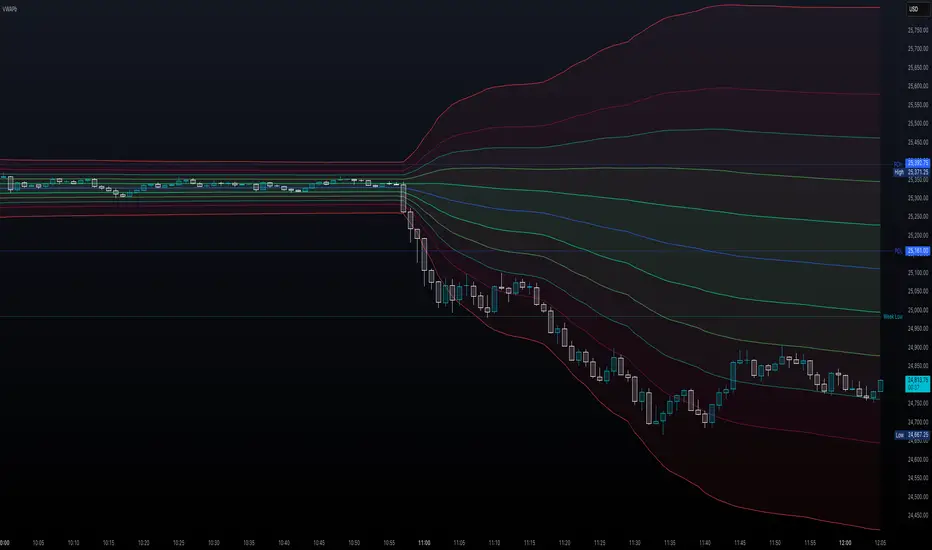
Volume Weighted Average Price Band Extension## Volume Weighted Average Price Band Extension (VWAPb)
**Volume Weighted Average Price Band Extension** is an enhanced VWAP indicator that extends the traditional three-band system to include up to **five configurable standard deviation bands**, making it particularly well-suited for analyzing volatile market conditions where price action frequently extends beyond conventional boundaries.
### Key Features
**Extended Band System**
Unlike standard VWAP indicators that typically offer three bands, this indicator provides five independently configurable bands with customizable multipliers (default: 0.5x, 1.0x, 1.5x, 2.0x, and 3.0x). Each band can be toggled on or off, allowing traders to adapt the display to current market volatility and their specific trading strategy.
**Dual Calculation Modes**
The indicator offers flexibility in how bands are calculated:
- **Standard Deviation Mode**: Traditional statistical approach measuring price dispersion from the VWAP
- **Percentage Mode**: Distance calculated as a percentage of VWAP (1 multiplier = 1%), useful for comparing relative moves across different price levels
**Flexible Anchor Periods**
Calculate VWAP from multiple timeframes and events:
- Time-based: Session, Week, Month, Quarter, Year, Decade, Century
- Event-based: Earnings reports, Dividend announcements, Stock splits
- Customizable source (default: hlc3)
**Visual Clarity**
Color-coded bands with semi-transparent fills between upper and lower boundaries help identify key support and resistance zones at a glance. The indicator automatically hides on daily and higher timeframes when enabled, keeping charts clean.
### Ideal For
- **Volatile Markets**: The extended band system captures extreme price movements that often exceed traditional 2-3 standard deviation bounds
- **Scalping & Day Trading**: Multiple bands provide granular entry and exit zones for short-term trades
- **Mean Reversion Strategies**: Identify overextended price action relative to volume-weighted fair value
- **Institutional Order Flow Analysis**: VWAP remains a key benchmark for institutional execution
### How It Works
The Volume Weighted Average Price represents the average price weighted by volume throughout the selected anchor period. The surrounding bands act as dynamic support and resistance levels, with each successive band representing areas of increasing deviation from the volume-weighted mean. In volatile conditions, price may regularly test the outer bands (2.0x, 3.0x), which would be invisible on standard three-band implementations.
**Trading Applications:**
- Price near outer bands (±2.0x, ±3.0x) may signal exhaustion and potential reversal opportunities
- Price oscillating between inner bands (±0.5x, ±1.0x) indicates consolidation
- VWAP itself acts as a dynamic pivot point—bullish above, bearish below
### Settings Overview
- **VWAP Settings**: Anchor period selection, source input, offset capability, option to hide on D/W/M timeframes
- **Bands Settings**: Toggle each of the five bands independently, adjust multipliers, choose between Standard Deviation or Percentage calculation mode
---
**Note**: This indicator requires volume data to function properly. A runtime error will display if volume data is unavailable for the selected symbol.
**Disclaimer**: This indicator is designed for technical analysis and should be used in conjunction with other forms of analysis and proper risk management. Past performance and indicator signals do not guarantee future results.
Multiple Smoothed Moving AveragesMultiple Smoothed Moving Averages (SMMAs)
This indicator displays up to 5 Smoothed Moving Averages (SMMAs) on your chart, providing a comprehensive view of multiple trend timeframes simultaneously.
═══════════════════════════════════════
WHAT IS A SMOOTHED MOVING AVERAGE?
═══════════════════════════════════════
The Smoothed Moving Average (SMMA), also known as the Running Moving Average (RMA), is a type of moving average that provides more smoothing than a Simple Moving Average (SMA).
Unlike SMA which gives equal weight to all values in the period, SMMA uses a recursive formula that gives more weight to previous SMMA values, resulting in:
- Smoother price action with less noise
- Slower response to recent price changes
- Better identification of longer-term trends
- Reduced false signals in choppy markets
CALCULATION METHOD:
- First value: Simple Moving Average of the initial period
- Subsequent values: (Previous SMMA × (Length - 1) + Current Price) / Length
This recursive nature makes SMMA particularly effective for identifying sustained trends while filtering out short-term volatility.
═══════════════════════════════════════
FEATURES
═══════════════════════════════════════
✓ 5 Independent SMMAs: Each with its own configurable period length
✓ Individual Toggles: Show/hide each SMMA independently
✓ Distinct Colors: Easy visual identification of each moving average
✓ Customizable Lengths: Adjust each period to match your trading strategy
✓ Shared Source: All SMMAs calculate from the same price source (default: close)
✓ Overlay Display: Plots directly on the price chart
═══════════════════════════════════════
DEFAULT SETTINGS
═══════════════════════════════════════
- SMMA 1: 30 periods (Blue)
- SMMA 2: 50 periods (Orange)
- SMMA 3: 100 periods (Green)
- SMMA 4: 200 periods (Purple)
- SMMA 5: 300 periods (Red)
All SMMAs are enabled by default.
═══════════════════════════════════════
HOW TO USE
═══════════════════════════════════════
TREND IDENTIFICATION:
- Price above all SMMAs = Strong uptrend
- Price below all SMMAs = Strong downtrend
- Price between SMMAs = Transitional phase or consolidation
SUPPORT & RESISTANCE:
- SMMAs often act as dynamic support in uptrends
- SMMAs often act as dynamic resistance in downtrends
- Longer-period SMMAs (200, 300) provide stronger S/R levels
CROSSOVER SIGNALS:
- Faster SMMA crossing above slower SMMA = Bullish signal
- Faster SMMA crossing below slower SMMA = Bearish signal
MULTIPLE TIMEFRAME ANALYSIS:
- Short-term trends: 30, 50 periods
- Medium-term trends: 100 periods
- Long-term trends: 200, 300 periods
═══════════════════════════════════════
CUSTOMIZATION
═══════════════════════════════════════
INPUTS TAB:
- Adjust each SMMA length to suit your trading timeframe
- Toggle individual SMMAs on/off using checkboxes
- Change the source (close, open, high, low, hl2, hlc3, ohlc4)
STYLE TAB:
- Modify line colors for each SMMA
- Adjust line thickness and style
- Change transparency levels
═══════════════════════════════════════
NOTES
═══════════════════════════════════════
- This indicator uses the mathematically correct SMMA calculation with the recursive formula
- All calculations are performed on every bar to ensure data consistency
- SMMAs respond more slowly than EMAs but faster than WMAs to price changes
- Best used in combination with other technical analysis tools
- Use on any timeframe
═══════════════════════════════════════
Perfect for traders who want a clear, multi-timeframe view of market trends using the smooth, reliable SMMA calculation method.

Retracement FiboNacci🎯 Core Functionality
Automatic Swing Detection: Uses ZigZag algorithm to detect significant price swings
Dual Modes:
Fibonacci Retracements - Traditional price-based levels
Fibonacci Time Zones - Time-based projections
Multi-Timeframe Analysis: Works on any timeframe while detecting swings from higher timeframes
⚙️ Customization Options
Fibonacci Levels:
Fully customizable Fibonacci levels (0%, 23.6%, 38.2%, 50%, 61.8%, 78.6%, 100%)
Individual color selection for each level
Toggle on/off specific levels as needed
Display Settings:
Line Styling: Choose between Solid, Dashed, or Dotted lines
Line Thickness: Adjustable from 1 to 5 pixels
ZigZag Visibility: Toggle base ZigZag line display
Label Management:
Fibonacci Labels: Show percentage retracement levels
Price Labels: Display actual price values
Flexible Positioning:
Left, Right, Both sides, or Auto-centering
Independent control for Fib and Price labels
Option to hide labels completely
🔧 Technical Specifications
ZigZag Parameters:
Depth: 12 bars
Deviation: 1%
Backstep: 2 bars
Real-time Updates: Automatically redraws when new swings are detected
Clean Interface: Removes old drawings to prevent chart clutter
Usage Scenarios
📈 Trend Analysis
Identify retracement levels during pullbacks
Spot potential reversal zones at key Fibonacci levels
Measure swing magnitudes for position sizing
⏰ Time Projections
Use Time Zone mode for forecasting potential reversal times
Combine price and time analysis for confluence
🎨 Visual Customization
Color-code important levels (e.g., 61.8% as golden ratio)
Adjust label sizes for better readability
Choose line styles that complement your chart setup
Ideal For
Swing traders identifying entry/exit points
Position traders finding optimal accumulation zones
Technical analysts validating support/resistance levels
Multi-timeframe analysts correlating higher timeframe structure
Pro Tips
Combine with Volume: Confirm reactions at Fibonacci levels with volume spikes
Multiple Timeframes: Use higher timeframe Fibonacci levels for major S/R
Confluence Trading: Look for Fibonacci levels aligning with previous support/resistance
Risk Management: Use Fibonacci extensions for profit targets

Aladin Pair Trading System v1Aladin Pair Trading System v1
What is This Indicator?
The Aladin Pair Trading System is a sophisticated tool designed to help traders identify profitable opportunities by comparing two related stocks that historically move together. Think of it as finding when one twin is running ahead or lagging behind the other - these moments often present trading opportunities as they tend to return to moving together.
Who Should Use This?
Beginners: Learn about statistical arbitrage and pair trading
Intermediate Traders: Execute mean-reversion strategies with confidence
Advanced Traders: Fine-tune parameters for optimal pair relationships
Portfolio Managers: Implement market-neutral strategies
💡 What is Pair Trading?
Imagine two ice cream shops next to each other. They usually have similar customer traffic because they're in the same area. If one day Shop A is packed while Shop B is empty, you might expect this imbalance to correct itself soon.
Pair trading works the same way:
You find two stocks that normally move together (like TCS and Infosys)
When one stock moves too far from the other, you trade expecting them to realign
You buy the lagging stock and sell the leading stock
When they come back together, you profit from both sides
Key Features
1. Z-Score Analysis
What it is: A statistical measure showing how far the price relationship has deviated from normal
What it means:
Z-Score near 0 = Normal relationship
Z-Score at +2 = Stock A is expensive relative to Stock B (Sell A, Buy B)
Z-Score at -2 = Stock A is cheap relative to Stock B (Buy A, Sell B)
2. Multiple Timeframe Analysis
Long-term Z-Score (300 bars): Shows the big picture trend
Short-term Z-Score (100 bars): Shows recent movements
Signal Z-Score (20 bars): Generates quick trading signals
3. Statistical Validation
The indicator checks if the pair is suitable for trading:
Correlation (must be > 0.7): Confirms the stocks move together
1.0 = Perfect positive correlation
0.7 = Strong correlation
Below 0.7 = Warning: pair may not be reliable
ADF P-Value (should be < 0.05): Tests if the relationship is stable
Low value = Good for pair trading
High value = Relationship may be random
Cointegration: Confirms long-term equilibrium relationship
YES = Pair tends to revert to mean
NO = Pair may drift apart permanently
Visual Elements Explained
Chart Zones (Color-Coded Areas)
Yellow Zone (-1.5 to +1.5)
Normal Zone: Relationship is stable
Action: Wait for better opportunities
Blue Zone (±1.5 to ±2.0)
Entry Zone: Deviation is significant
Action: Prepare for potential trades
Green/Red Zone (±2.0 to ±3.0)
Opportunity Zone: Strong deviation
Action: High-probability trade setups
Beyond ±3.0
Risk Limit: Extreme deviation
Action: Either maximum opportunity or structural break
Signal Arrows
Green Arrow Up (Buy A + Sell B):
Stock A is undervalued relative to B
Buy Stock A, Short Stock B
Red Arrow Down (Sell A + Buy B):
Stock A is overvalued relative to B
Sell Stock A, Buy Stock B
Settings Guide
Symbol Inputs
Pair Symbol (Symbol B): Choose the second stock to compare
Default: NSE:INFY (Infosys)
Example pairs: TCS/INFY, HDFCBANK/ICICIBANK, RELIANCE/ONGC
Z-Score Parameters
Long Z-Score Period (300): Historical context
Short Z-Score Period (100): Recent trend
Signal Period (20): Trading signals
Z-Score Threshold (2.0): Entry trigger level
Higher = Fewer but stronger signals
Lower = More frequent signals
Statistical Parameters
Correlation Period (240): How many bars to check correlation
Hurst Exponent Period (50): Measures mean-reversion tendency
Probability Lookback (100): Historical probability calculations
Trading Parameters
Entry Threshold (0.0): Minimum Z-score for entry
Risk Threshold (1.5): Warning level
Risk Limit (3.0): Maximum deviation to trade
How to Use (Step-by-Step)
Step 1: Choose Your Pair
Add the indicator to your chart (this becomes Stock A)
In settings, select Stock B (the comparison stock)
Choose stocks from the same sector for best results
Step 2: Verify Pair Quality
Check the Statistics Table (top-right corner):
✅ Correlation > 0.70 (Green = Good)
✅ ADF P-value < 0.05 (Green = Good)
✅ Cointegrated = YES (Green = Good)
If all three are green, the pair is suitable for trading!
Step 3: Wait for Signals
BUY SIGNAL (Green Arrow Up)
Z-Score crosses above -2.0
Action: Buy Stock A, Sell Stock B
Exit: When Z-Score returns to 0
SELL SIGNAL (Red Arrow Down)
Z-Score crosses below +2.0
Action: Sell Stock A, Buy Stock B
Exit: When Z-Score returns to 0
Step 4: Risk Management
Yellow Zone: Monitor only
Blue Zone: Prepare for entry
Green/Red Zone: Active trading zone
Beyond ±3.0: Maximum risk - use caution
⚠️ Important Warnings
Not All Pairs Work: Always check the statistics table first
Market Conditions Matter: Correlation can break during market stress
Use Stop Losses: Set stops at Z-Score ±3.5 or beyond
Position Sizing: Trade both legs with appropriate hedge ratios
Transaction Costs: Factor in brokerage and slippage for both stocks
Example Trade
Scenario: TCS vs INFOSYS
Correlation: 0.85 ✅
Z-Score: -2.3 (TCS is cheap vs INFY)
Action to be taken:
Buy 1lot of TCS Future
Sell 1lot of INFOSYS Future
Expected Outcome:
As Z-Score moves toward 0, TCS outperforms INFOSYS
Close both positions when Z-Score crosses 0
Profit from the convergence
Best Practices
Test Before Trading: Use paper trading first
Sector Focus: Choose pairs from the same industry
Monitor Statistics: Check correlation daily
Avoid News Events: Don't trade pairs during earnings/major news
Size Appropriately: Start small, scale with experience
Be Patient: Wait for high-quality setups (±2.0 or beyond)
What Makes This Indicator Unique?
Multi-timeframe Z-Score analysis: Three different perspectives
Statistical validation: Built-in correlation and cointegration tests
Visual risk zones: Easy-to-understand color-coded areas
Real-time statistics: Live pair quality monitoring
Beginner-friendly: Clear signals with educational zones
Technical Background
The indicator uses:
Engle-Granger Cointegration Test: Validates pair relationship
ADF (Augmented Dickey-Fuller) Test: Tests stationarity
Pearson Correlation: Measures linear relationship
Z-Score Normalization: Standardizes deviations
Log Returns: Handles price differences properly
Support & Community
For questions, suggestions, or to share your pair trading experiences:
Comment below the indicator
Share your successful pair combinations
Report any issues for quick fixes
Disclaimer
This indicator is for educational and informational purposes only. It does not constitute financial advice. Pair trading involves risk, including the risk of loss.
Always:
Do your own research
Understand the risks
Trade with money you can afford to lose
Consider consulting a financial advisor
📌 Quick Reference Card
Z-ScoreInterpretationAction-3.0 to -2.0A very cheap vs BStrong Buy A, Sell B-2.0 to -1.5A cheap vs BBuy A, Sell B-1.5 to +1.5Normal rangeHold/Wait+1.5 to +2.0A expensive vs BSell A, Buy B+2.0 to +3.0A very expensive vs BStrong Sell A, Buy B
Good Pair Statistics:
Correlation: > 0.70
ADF P-value: < 0.05
Cointegration: YES
Version: 1.0
Last Updated: 10th October 2025
Compatible: TradingView Pine Script v6
Happy Trading!

MTRADE ATR SL FINDERAverage True Range Stop Loss Finder (ATR)
This indicator automatically calculates dynamic stop-loss levels based on market volatility using the Average True Range (ATR) formula.
It provides both Long and Short stop levels derived from ATR values and adapts them in real time as volatility changes.
🔍 Features
Adjustable ATR Length (default: 20)
Four smoothing methods: RMA, SMA, EMA, WMA
Configurable Multiplier (default: 1.5× ATR)
Real-time High (Short Stop) and Low (Long Stop) lines on the chart
A clean on-chart table displaying:
ATR value
High stop level (H)
Low stop level (L)
— all shown with 7-decimal precision for accurate readings
⚙️ Use Cases
Volatility-based stop-loss and take-profit placement
Risk management and trailing-stop automation
Intraday and swing trading systems using ATR-driven exits
🧠 Technical Details
Built in Pine Script v5
Supports up to 7 decimal precision (precision=7)
Works as an overlay, displaying ATR bands directly on price action
Fully customizable colors and smoothing logic
by fiyatherseydir

Stochastic Enhanced [DCAUT]█ Stochastic Enhanced
📊 ORIGINALITY & INNOVATION
The Stochastic Enhanced indicator builds upon George Lane's classic momentum oscillator (developed in the late 1950s) by providing comprehensive smoothing algorithm flexibility. While traditional implementations limit users to Simple Moving Average (SMA) smoothing, this enhanced version offers 21 advanced smoothing algorithms, allowing traders to optimize the indicator's characteristics for different market conditions and trading styles.
Key Improvements:
Extended from single SMA smoothing to 21 professional-grade algorithms including adaptive filters (KAMA, FRAMA), zero-lag methods (ZLEMA, T3), and advanced digital filters (Kalman, Laguerre)
Maintains backward compatibility with traditional Stochastic calculations through SMA default setting
Unified smoothing algorithm applies to both %K and %D lines for consistent signal processing characteristics
Enhanced visual feedback with clear color distinction and background fill highlighting for intuitive signal recognition
Comprehensive alert system covering crossovers and zone entries for systematic trade management
Differentiation from Traditional Stochastic:
Traditional Stochastic indicators use fixed SMA smoothing, which introduces consistent lag regardless of market volatility. This enhanced version addresses the limitation by offering adaptive algorithms that adjust to market conditions (KAMA, FRAMA), reduce lag without sacrificing smoothness (ZLEMA, T3, HMA), or provide superior noise filtering (Kalman Filter, Laguerre filters). The flexibility helps traders balance responsiveness and stability according to their specific needs.
📐 MATHEMATICAL FOUNDATION
Core Stochastic Calculation:
The Stochastic Oscillator measures the position of the current close relative to the high-low range over a specified period:
Step 1: Raw %K Calculation
%K_raw = 100 × (Close - Lowest Low) / (Highest High - Lowest Low)
Where:
Close = Current closing price
Lowest Low = Lowest low over the %K Length period
Highest High = Highest high over the %K Length period
Result ranges from 0 (close at period low) to 100 (close at period high)
Step 2: Smoothed %K Calculation
%K = MA(%K_raw, K Smoothing Period, MA Type)
Where:
MA = Selected moving average algorithm (SMA, EMA, etc.)
K Smoothing = 1 for Fast Stochastic, 3+ for Slow Stochastic
Traditional Fast Stochastic uses %K_raw directly without smoothing
Step 3: Signal Line %D Calculation
%D = MA(%K, D Smoothing Period, MA Type)
Where:
%D acts as a signal line and moving average of %K
D Smoothing typically set to 3 periods in traditional implementations
Both %K and %D use the same MA algorithm for consistent behavior
Available Smoothing Algorithms (21 Options):
Standard Moving Averages:
SMA (Simple): Equal-weighted average, traditional default, consistent lag characteristics
EMA (Exponential): Recent price emphasis, faster response to changes, exponential decay weighting
RMA (Rolling/Wilder's): Smoothed average used in RSI, less reactive than EMA
WMA (Weighted): Linear weighting favoring recent data, moderate responsiveness
VWMA (Volume-Weighted): Incorporates volume data, reflects market participation intensity
Advanced Moving Averages:
HMA (Hull): Reduced lag with smoothness, uses weighted moving averages and square root period
ALMA (Arnaud Legoux): Gaussian distribution weighting, minimal lag with good noise reduction
LSMA (Least Squares): Linear regression based, fits trend line to data points
DEMA (Double Exponential): Reduced lag compared to EMA, uses double smoothing technique
TEMA (Triple Exponential): Further lag reduction, triple smoothing with lag compensation
ZLEMA (Zero-Lag Exponential): Lag elimination attempt using error correction, very responsive
TMA (Triangular): Double-smoothed SMA, very smooth but slower response
Adaptive & Intelligent Filters:
T3 (Tilson T3): Six-pass exponential smoothing with volume factor adjustment, excellent smoothness
FRAMA (Fractal Adaptive): Adapts to market fractal dimension, faster in trends, slower in ranges
KAMA (Kaufman Adaptive): Efficiency ratio based adaptation, responds to volatility changes
McGinley Dynamic: Self-adjusting mechanism following price more accurately, reduced whipsaws
Kalman Filter: Optimal estimation algorithm from aerospace engineering, dynamic noise filtering
Advanced Digital Filters:
Ultimate Smoother: Advanced digital filter design, superior noise rejection with minimal lag
Laguerre Filter: Time-domain filter with N-order implementation, adjustable lag characteristics
Laguerre Binomial Filter: 6-pole Laguerre filter, extremely smooth output for long-term analysis
Super Smoother: Butterworth filter implementation, removes high-frequency noise effectively
📊 COMPREHENSIVE SIGNAL ANALYSIS
Absolute Level Interpretation (%K Line):
%K Above 80: Overbought condition, price near period high, potential reversal or pullback zone, caution for new long entries
%K in 70-80 Range: Strong upward momentum, bullish trend confirmation, uptrend likely continuing
%K in 50-70 Range: Moderate bullish momentum, neutral to positive outlook, consolidation or mild uptrend
%K in 30-50 Range: Moderate bearish momentum, neutral to negative outlook, consolidation or mild downtrend
%K in 20-30 Range: Strong downward momentum, bearish trend confirmation, downtrend likely continuing
%K Below 20: Oversold condition, price near period low, potential bounce or reversal zone, caution for new short entries
Crossover Signal Analysis:
%K Crosses Above %D (Bullish Cross): Momentum shifting bullish, faster line overtakes slower signal, consider long entry especially in oversold zone, strongest when occurring below 20 level
%K Crosses Below %D (Bearish Cross): Momentum shifting bearish, faster line falls below slower signal, consider short entry especially in overbought zone, strongest when occurring above 80 level
Crossover in Midrange (40-60): Less reliable signals, often in choppy sideways markets, require additional confirmation from trend or volume analysis
Multiple Failed Crosses: Indicates ranging market or choppy conditions, reduce position sizes or avoid trading until clear directional move
Advanced Divergence Patterns (%K Line vs Price):
Bullish Divergence: Price makes lower low while %K makes higher low, indicates weakening bearish momentum, potential trend reversal upward, more reliable when %K in oversold zone
Bearish Divergence: Price makes higher high while %K makes lower high, indicates weakening bullish momentum, potential trend reversal downward, more reliable when %K in overbought zone
Hidden Bullish Divergence: Price makes higher low while %K makes lower low, indicates trend continuation in uptrend, bullish trend strength confirmation
Hidden Bearish Divergence: Price makes lower high while %K makes higher high, indicates trend continuation in downtrend, bearish trend strength confirmation
Momentum Strength Analysis (%K Line Slope):
Steep %K Slope: Rapid momentum change, strong directional conviction, potential for extended moves but also increased reversal risk
Gradual %K Slope: Steady momentum development, sustainable trends more likely, lower probability of sharp reversals
Flat or Horizontal %K: Momentum stalling, potential reversal or consolidation ahead, wait for directional break before committing
%K Oscillation Within Range: Indicates ranging market, sideways price action, better suited for range-trading strategies than trend following
🎯 STRATEGIC APPLICATIONS
Mean Reversion Strategy (Range-Bound Markets):
Identify ranging market conditions using price action or Bollinger Bands
Wait for Stochastic to reach extreme zones (above 80 for overbought, below 20 for oversold)
Enter counter-trend position when %K crosses %D in extreme zone (sell on bearish cross above 80, buy on bullish cross below 20)
Set profit targets near opposite extreme or midline (50 level)
Use tight stop-loss above recent swing high/low to protect against breakout scenarios
Exit when Stochastic reaches opposite extreme or %K crosses %D in opposite direction
Trend Following with Momentum Confirmation:
Identify primary trend direction using higher timeframe analysis or moving averages
Wait for Stochastic pullback to oversold zone (<20) in uptrend or overbought zone (>80) in downtrend
Enter in trend direction when %K crosses %D confirming momentum shift (bullish cross in uptrend, bearish cross in downtrend)
Use wider stops to accommodate normal trend volatility
Add to position on subsequent pullbacks showing similar Stochastic pattern
Exit when Stochastic shows opposite extreme with failed cross or bearish/bullish divergence
Divergence-Based Reversal Strategy:
Scan for divergence between price and Stochastic at swing highs/lows
Confirm divergence with at least two price pivots showing divergent Stochastic readings
Wait for %K to cross %D in direction of anticipated reversal as entry trigger
Enter position in divergence direction with stop beyond recent swing extreme
Target profit at key support/resistance levels or Fibonacci retracements
Scale out as Stochastic reaches opposite extreme zone
Multi-Timeframe Momentum Alignment:
Analyze Stochastic on higher timeframe (4H or Daily) for primary trend bias
Switch to lower timeframe (1H or 15M) for precise entry timing
Only take trades where lower timeframe Stochastic signal aligns with higher timeframe momentum direction
Higher timeframe Stochastic in bullish zone (>50) = only take long entries on lower timeframe
Higher timeframe Stochastic in bearish zone (<50) = only take short entries on lower timeframe
Exit when lower timeframe shows counter-signal or higher timeframe momentum reverses
Zone Transition Strategy:
Monitor Stochastic for transitions between zones (oversold to neutral, neutral to overbought, etc.)
Enter long when Stochastic crosses above 20 (exiting oversold), signaling momentum shift from bearish to neutral/bullish
Enter short when Stochastic crosses below 80 (exiting overbought), signaling momentum shift from bullish to neutral/bearish
Use zone midpoint (50) as dynamic support/resistance for position management
Trail stops as Stochastic advances through favorable zones
Exit when Stochastic fails to maintain momentum and reverses back into prior zone
📋 DETAILED PARAMETER CONFIGURATION
%K Length (Default: 14):
Lower Values (5-9): Highly sensitive to price changes, generates more frequent signals, increased false signals in choppy markets, suitable for very short-term trading and scalping
Standard Values (10-14): Balanced sensitivity and reliability, traditional default (14) widely used,适合 swing trading and intraday strategies
Higher Values (15-21): Reduced sensitivity, smoother oscillations, fewer but potentially more reliable signals, better for position trading and lower timeframe noise reduction
Very High Values (21+): Slow response, long-term momentum measurement, fewer trading signals, suitable for weekly or monthly analysis
%K Smoothing (Default: 3):
Value 1: Fast Stochastic, uses raw %K calculation without additional smoothing, most responsive to price changes, generates earliest signals with higher noise
Value 3: Slow Stochastic (default), traditional smoothing level, reduces false signals while maintaining good responsiveness, widely accepted standard
Values 5-7: Very slow response, extremely smooth oscillations, significantly reduced whipsaws but delayed entry/exit timing
Recommendation: Default value 3 suits most trading scenarios, active short-term traders may use 1, conservative long-term positions use 5+
%D Smoothing (Default: 3):
Lower Values (1-2): Signal line closely follows %K, frequent crossover signals, useful for active trading but requires strict filtering
Standard Value (3): Traditional setting providing balanced signal line behavior, optimal for most trading applications
Higher Values (4-7): Smoother signal line, fewer crossover signals, reduced whipsaws but slower confirmation, better for trend trading
Very High Values (8+): Signal line becomes slow-moving reference, crossovers rare and highly significant, suitable for long-term position changes only
Smoothing Type Algorithm Selection:
For Trending Markets:
ZLEMA, DEMA, TEMA: Reduced lag for faster trend entry, quick response to momentum shifts, suitable for strong directional moves
HMA, ALMA: Good balance of smoothness and responsiveness, effective for clean trend following without excessive noise
EMA: Classic choice for trending markets, faster than SMA while maintaining reasonable stability
For Ranging/Choppy Markets:
Kalman Filter, Super Smoother: Superior noise filtering, reduces false signals in sideways action, helps identify genuine reversal points
Laguerre Filters: Smooth oscillations with adjustable lag, excellent for mean reversion strategies in ranges
T3, TMA: Very smooth output, filters out market noise effectively, clearer extreme zone identification
For Adaptive Market Conditions:
KAMA: Automatically adjusts to market efficiency, fast in trends and slow in congestion, reduces whipsaws during transitions
FRAMA: Adapts to fractal market structure, responsive during directional moves, conservative during uncertainty
McGinley Dynamic: Self-adjusting smoothing, follows price naturally, minimizes lag in trending markets while filtering noise in ranges
For Conservative Long-Term Analysis:
SMA: Traditional choice, predictable behavior, widely understood characteristics
RMA (Wilder's): Smooth oscillations, reduced sensitivity to outliers, consistent behavior across market conditions
Laguerre Binomial Filter: Extremely smooth output, ideal for weekly/monthly timeframe analysis, eliminates short-term noise completely
Source Selection:
Close (Default): Standard choice using closing prices, most common and widely tested
HLC3 or OHLC4: Incorporates more price information, reduces impact of sudden spikes or gaps, smoother oscillator behavior
HL2: Midpoint of high-low range, emphasizes intrabar volatility, useful for markets with wide intraday ranges
Custom Source: Can use other indicators as input (e.g., Heikin Ashi close, smoothed price), creates derivative momentum indicators
📈 PERFORMANCE ANALYSIS & COMPETITIVE ADVANTAGES
Responsiveness Characteristics:
Traditional SMA-Based Stochastic:
Fixed lag regardless of market conditions, consistent delay of approximately (K Smoothing + D Smoothing) / 2 periods
Equal treatment of trending and ranging markets, no adaptation to volatility changes
Predictable behavior but suboptimal in varying market regimes
Enhanced Version with Adaptive Algorithms:
KAMA and FRAMA reduce lag by up to 40-60% in strong trends compared to SMA while maintaining similar smoothness in ranges
ZLEMA and T3 provide near-zero lag characteristics for early entry signals with acceptable noise levels
Kalman Filter and Super Smoother offer superior noise rejection, reducing false signals in choppy conditions by estimations of 30-50% compared to SMA
Performance improvements vary by algorithm selection and market conditions
Signal Quality Improvements:
Adaptive algorithms help reduce whipsaw trades in ranging markets by adjusting sensitivity dynamically
Advanced filters (Kalman, Laguerre, Super Smoother) provide clearer extreme zone readings for mean reversion strategies
Zero-lag methods (ZLEMA, DEMA, TEMA) generate earlier crossover signals in trending markets for improved entry timing
Smoother algorithms (T3, Laguerre Binomial) reduce false extreme zone touches for more reliable overbought/oversold signals
Comparison with Standard Implementations:
Versus Basic Stochastic: Enhanced version offers 21 smoothing options versus single SMA, allowing optimization for specific market characteristics and trading styles
Versus RSI: Stochastic provides range-bound measurement (0-100) with clear extreme zones, RSI measures momentum speed, Stochastic offers clearer visual overbought/oversold identification
Versus MACD: Stochastic bounded oscillator suitable for mean reversion, MACD unbounded indicator better for trend strength, Stochastic excels in range-bound and oscillating markets
Versus CCI: Stochastic has fixed bounds (0-100) for consistent interpretation, CCI unbounded with variable extremes, Stochastic provides more standardized extreme readings across different instruments
Flexibility Advantages:
Single indicator adaptable to multiple strategies through algorithm selection rather than requiring different indicator variants
Ability to optimize smoothing characteristics for specific instruments (e.g., smoother for crypto volatility, faster for forex trends)
Multi-timeframe analysis with consistent algorithm across timeframes for coherent momentum picture
Backtesting capability with algorithm as optimization parameter for strategy development
Limitations and Considerations:
Increased complexity from multiple algorithm choices may lead to over-optimization if parameters are curve-fitted to historical data
Adaptive algorithms (KAMA, FRAMA) have adjustment periods during market regime changes where signals may be less reliable
Zero-lag algorithms sacrifice some smoothness for responsiveness, potentially increasing noise sensitivity in very choppy conditions
Performance characteristics vary significantly across algorithms, requiring understanding and testing before live implementation
Like all oscillators, Stochastic can remain in extreme zones for extended periods during strong trends, generating premature reversal signals
USAGE NOTES
This indicator is designed for technical analysis and educational purposes to provide traders with enhanced flexibility in momentum analysis. The Stochastic Oscillator has limitations and should not be used as the sole basis for trading decisions.
Important Considerations:
Algorithm performance varies with market conditions - no single smoothing method is optimal for all scenarios
Extreme zone signals (overbought/oversold) indicate potential reversal areas but not guaranteed turning points, especially in strong trends
Crossover signals may generate false entries during sideways choppy markets regardless of smoothing algorithm
Divergence patterns require confirmation from price action or additional indicators before trading
Past indicator characteristics and backtested results do not guarantee future performance
Always combine Stochastic analysis with proper risk management, position sizing, and multi-indicator confirmation
Test selected algorithm on historical data of specific instrument and timeframe before live trading
Market regime changes may require algorithm adjustment for optimal performance
The enhanced smoothing options are intended to provide tools for optimizing the indicator's behavior to match individual trading styles and market characteristics, not to create a perfect predictive tool. Responsible usage includes understanding the mathematical properties of selected algorithms and their appropriate application contexts.

MNQ Morning Indicator | Clean SignalsMNQ Morning Trading Indicator Summary
What It Does
This is a TradingView indicator designed for day trading MNQ (Micro Nasdaq-100 futures) during morning sessions. It generates BUY and SELL signals only when multiple technical conditions align, helping traders identify high-probability trade setups.
Core Strategy
BUY Signal Requirements (All must be true):
✅ Price above VWAP (volume-weighted average price)
✅ Fast EMA (9) above Slow EMA (21) - uptrend confirmation
✅ Price above 15-minute 50 EMA - higher timeframe confirmation
✅ MACD histogram positive - momentum confirmation
✅ RSI above 55 - strength confirmation
✅ ADX above 25 - trending market (not choppy)
✅ Volume 1.5x above average - strong participation
SELL Signal (opposite conditions)
Key Features
🎯 Risk Management
Stop Loss: 2× ATR (Average True Range)
Take Profit 1: 2× ATR (1:2 risk-reward)
Take Profit 2: 3× ATR (1:3 risk-reward)
Dollar values: Calculates P&L based on MNQ's $2/point value
⏰ Session Filter
Default: 9:30 AM - 11:30 AM ET (customizable)
Safety feature: Avoids first 15 minutes (high volatility period)
Won't generate signals outside trading hours
🛡️ Signal Quality
Rates each signal: 🔥 STRONG, ⚡ MEDIUM, or ⚠️ WEAK
Requires minimum 15 bars between signals (prevents overtrading)
📊 Visual Dashboard
Shows real-time metrics:
ATR values
ADX (trend strength)
RSI (momentum)
Market condition (TREND/CHOP)
Session status
Volume status
Signal cooldown timer
Visual Elements
📈 VWAP with standard deviation bands (1σ, 2σ, 3σ)
📉 Multiple EMAs with trend-based coloring
🟢/🔴 Buy/Sell arrows on chart
📋 Detailed trade labels showing entry, SL, TPs, and risk-reward ratios
🎨 Background highlighting for market conditions
Safety Features
Cooldown period between signals
Session restrictions (no trading outside set hours)
First 15-minute avoidance (post-open volatility)
Multi-confirmation requirement (all 7 conditions must align)
Trend filter (ADX minimum to avoid choppy markets)
Best For
Day traders focused on morning sessions
MNQ futures traders
Traders who prefer systematic, rule-based entries
Those wanting pre-calculated risk management levels
Customization
All parameters are adjustable:
EMA periods
MACD settings
RSI thresholds
ADX minimum
ATR multipliers
Session times
Visual preferences
This indicator is designed to be conservative — it waits for strong confirmation before signaling, which means fewer but potentially higher-quality trades.

EMA Candle ColorEMA Candle Color - Visual EMA-Based Candle Coloring System
Overview:
This indicator provides a visual approach to trend identification by coloring candles based on their relationship with an Exponential Moving Average (EMA). The script dynamically colors both the candle bars and plots custom candles to give traders an immediate visual representation of price momentum relative to the EMA.
How It Works:
The indicator calculates an EMA based on your chosen source (default: open price) and length (default: 10 periods). It then applies a simple yet effective rule:
When the source price is ABOVE the EMA → Candles turn GREEN (bullish)
When the source price is BELOW the EMA → Candles turn RED (bearish)
This instant visual feedback helps traders quickly identify:
Current trend direction
Potential support/resistance levels (the EMA line itself)
Momentum shifts when candles change color
Key Features:
Customizable EMA Parameters: Adjust the EMA length (1-500) and source (open, close, high, low, hl2, hlc3, ohlc4)
Custom Color Selection: Choose your preferred bullish and bearish colors to match your chart theme
Dual Visualization: Both bar coloring and custom plotcandle for enhanced visibility
Offset Capability: Shift the EMA line forward or backward for advanced analysis
Clean Design: Minimal overlay that doesn't clutter your chart
How to Use:
1. Add the indicator to your chart
2. Adjust the EMA Length based on your trading timeframe:
- Shorter periods (5-20) for day trading and scalping
- Medium periods (20-50) for swing trading
- Longer periods (50-200) for position trading
3. Watch for candle color changes as potential entry/exit signals
4. Combine with other indicators for confirmation
Trading Applications:
Trend Following: Stay in trades while candles remain the same color
Reversal Signals: Watch for color changes as early reversal warnings
Filter System: Only take long positions during green candles, shorts during red
Visual Clarity: Quickly assess market sentiment at a glance
Settings:
Length: EMA calculation period (default: 10)
Source: Price data used for EMA calculation (default: open)
Offset: Shift EMA line on chart (default: 0)
Bullish Color: Color for candles above EMA (default: green)
Bearish Color: Color for candles below EMA (default: red)
Technical Details:
The script uses Pine Script v6 and employs the standard ta.ema() function for smooth, responsive EMA calculations. The candle coloring is achieved through both barcolor() and plotcandle() functions, ensuring visibility across different chart settings.
Note:
This indicator works on all timeframes and instruments. For best results, combine with proper risk management and additional confirmation indicators. The EMA Candle Color system is designed to simplify trend identification, not as a standalone trading system.
Tips:
Use on higher timeframes for more reliable signals
Combine with volume analysis for confirmation
Consider using multiple EMA periods for confluence
Disable default candles if using the plotcandle feature to avoid overlap
This script is open-source. Feel free to use it as a foundation for your own trading system or modify it to suit your specific trading style.
cd_VWAP_mtg_CxCd_VWAP_mtg_Cx
Overview
The most important condition for being successful and profitable in the market is to consistently follow the same rules without compromise, while the price constantly moves in countless different ways.
Regardless of the concept or trading school, those who have rules win.
In this indicator, we will define and use three main sections to set and apply our rules.
The indicator uses the VWAP (Volume Weighted Average Price) — price weighted by volume.
Two VWAPs can be displayed either by manually entering date and time, or by selecting from the menu.
From the menu, you can select the following reference levels:
• HTF Open: Opening candle of the higher timeframe
• ATH / ATL: All-Time High / All-Time Low candles
• PMH / PML, PWH / PWL, PDH / PDL, PH4H / PH4L: Previous Month, Week, Day, or H4 Highs/Lows
• MH / ML, WH / WL, DH / DL, H4H / H4L: Current Month, Week, Day, or H4 Highs/Lows
Additionally, it includes:
• Mitigation / Order Block zones (local buyer-seller balance) across two timeframes.
• Buy/Sell Side Liquidity levels (BSL / SSL) from the aligned higher timeframe (target levels).
________________________________________
Components and Usage
1 – VWAP
Calculated using the classical method:
• High + Volume for the upper value
• Close + Volume for the middle value
• Low + Volume for the lower value
The VWAP is displayed as a colored band, where the coloring represents the bias.
Let’s call this band FVB (Fair Value Band) for ease of explanation.
The FVB represents the final line of defense, the buyer/seller boundary, and in technical terms, it can be viewed as premium/discount zones or support/resistance levels.
Within this critical area, the strong side continues its move, while the weaker side is forced to retreat.
But does the side that breaks beyond the band always keep going?
We all know that’s not always the case — in different pairs and timeframes, price often violates both the upper and lower edges multiple times.
To achieve more consistent analysis, we’ll define a new set of rules.
________________________________________
2 – Mitigation / Order Blocks
In trading literature, there are dozens of different definitions and uses of mitigation or order blocks.
Here, we will interpret the candlesticks to create our own definition, and we’ll use the zones defined by candles that fit this pattern.
For simplicity, let’s abbreviate mitigation as “mtg.”
For a candle to be selected as an mtg, it must clearly show strength from one side (buyers or sellers) — which can also be observed visually on the chart.
________________________________________
Bullish mtg criteria:
1. The first candle must be bullish (close > open) → buyers are strong.
2. The next candle makes a new high (buyers push higher) but fails to close above and pulls back to close inside the previous range → sellers react.
It also must not break the previous low → buyers defend.
3. In the following candle(s), as long as the first candle’s low is protected and the second candle’s high is broken, it indicates buyer strength → a bullish mtg is confirmed.
When price returns to this zone later (gets mitigated), the expectation is that the zone holds and price pushes upward again.
If the low is violated, the mtg becomes invalid.
In technical terms:
If the previous candle’s high is broken but no close occurs above it, the expectation is a reversal move that will retest its low.
Question:
What if the low is protected and in the next candle(s) a new high forms?
Answer: → Bullish mtg.
Bearish mtg (opposite)
3 – Buy/Sell Side Liquidity Levels
With the help of the aligned higher timeframe (swing points), we will define our market structure framework and set our liquidity targets accordingly.
Let’s put the pieces together.
If we continue explaining from a trade-focused perspective, our first priority should be our bias — our projection or expectation of the market’s potential movement.
We will determine this bias using the FVB.
Since we know the band often gets violated on both sides, we want the price action to convince us of its strength.
To do that, we’ll use the first candle that closes beyond the band.
The distance from that candle’s high to low will be our threshold range
Bullish level = high + (candle length × coefficient)
Bearish level = low - (candle length × coefficient)
When the price closes beyond this threshold, it demonstrates strength, and our bias will now align in that direction.
How long will this bias remain valid?
→ Until a closing candle appears on the opposite side of the band.
If a close occurs on the opposite side, then a new bias will only be confirmed once the new threshold level is broken.
During the period in between, we have no bias.
Let’s continue on the chart:
Now that our bias has been established, where and how do we look for trade opportunities?
There are two possible entry approaches:
• Aggressive entry: Enter immediately with the breakout.
• Conservative entry: Wait for a pullback and enter once a suitable structure forms.
(The choice depends on the user’s preference.)
At this stage, the user can apply their own entry model. Let’s give an example:
Let’s assume we’re looking for setups using HTF sweep + LTF CISD confirmation.
Once our bias turns bearish, we look for an HTF sweep forming on or near an FVB or mtg block, and then confirm the entry with a CISD signal.
In summary:
• FVB defines the bias, the entry zone, and the target zone.
• Mtg blocks represent entry zones.
• BSL / SSL levels suggest target zones.
Overlapping FVB and mtg blocks are expected to be more effective.
The indicator also provides an option for a second FVB.
A band attached to a lower timeframe can be used as confirmation.
• Main band: Bias + FVB
• Extra band: Entry trigger confirmed by a close beyond it.
Mtg blocks can provide trade entry opportunities, especially when the price is moving strongly in one direction (flow).
Consecutive or complementary mtg blocks indicate that the price is decisive in one direction, while sometimes also showing areas where we should wait before entering.
Mtg blocks that contain an FVG (Fair Value Gap) within their body are expected to be more effective.
Settings:
The default values are set to 1-3-5m, optimized for scalping trades.
VWAP settings:
Main VWAP (FVB):
• Can be set by selecting a start time, manually entering date and time, or choosing a predefined level.
Extra VWAP (FVB):
• Set from the menu. If not needed, select “none.”
• Visibility, color, and fill settings for VWAP are located here.
• Threshold levels visibility and color options are also in this section.
• The multiplier is used for calculating the threshold level.
Important:
• If the Extra VWAP is selected but not displayed, you need to increase the chart timeframe.
o Example: If the chart is on 3m and you select WH from the extra options, it will not display correctly.
• Upper limits for VWAP:
o 1m and 3m charts: daily High/Low
o 5m chart: weekly High/Low
________________________________________
Mtg Settings:
• Visibility and color settings for blocks are configured here.
• To display on a second timeframe, the box must be checked and the timeframe specified.
• Optional display modes: “only active blocks,” “only last violated mtg,” or “all.”
• For confirmation and removal criteria, choosing high/low or close determines the source used for mtg block formation and deletion conditions.
BSL/SSL Settings:
• Visibility, color, font size, and line style can be configured in this section.
When “Auto” is selected, the aligned timeframe is determined automatically by the indicator, while in manual mode, the user defines the timeframe.
Final Words:
Simply opening trades every time the price touches the VWAP or mtg blocks will not make you a profitable trader. Searching for setups with similar structures while maintaining proper risk management will yield better results in the long run.
I would be happy to hear your feedback and suggestions.
Happy trading!

Wyckoff Effort vs. Result📌 Wyckoff Effort vs. Result (E/R) – Visualizing Supply & Demand Imbalance with Volume Confirmation
📖 Overview
The Wyckoff Effort vs. Result (E/R) indicator is designed to help traders interpret market behavior through the lens of volume vs. price movement — a foundational concept in Richard Wyckoff’s methodology.
This tool aims to highlight moments where the “effort” (volume) is not in proportion to the “result” (price movement) — giving insight into potential accumulation or distribution events.
By detecting high-volume candles and classifying them based on their price direction, the indicator visualizes zones where smart money might be active .
⚙️ How It Works
1. Effort Accumulation (High Volume Down Bar):
• When a candle closes lower than it opens (down bar) and has above-average volume , it’s marked as potential absorption of selling pressure (effort to push down met by buying).
• These candles are colored red and the open level is plotted, acting as a potential support or re-test zone.
2. Effort Distribution (High Volume Up Bar):
• When a candle closes higher than it opens (up bar) and has above-average volume , it’s marked as potential distribution (effort to push up absorbed by sellers).
• These candles are colored green and the open level is plotted , acting as a potential resistance or rejection zone.
3. Average Volume Calculation:
• The script calculates a simple moving average (SMA) of volume over a user-defined lookback period.
• If current volume exceeds the average multiplied by a set threshold, it’s treated as a high-effort bar .
🧪 Inputs
Input Description
Average Volume Lookback - Number of bars used to calculate the volume average
High Volume Multiplier. - Multiplier to define what qualifies as “high volume”
🖥️ Visual Output
• 🔴 Red candles = High volume on a down bar → possible accumulation
• 🟢 Green candles = High volume on an up bar → possible distribution
• 📉 Horizontal lines at bar open price mark the potential zones where effort occurred
These zones can serve as:
• Areas of support/resistance
• Trap zones where smart money absorbs liquidity
• Entry/exit filters when combined with price action
🧠 How to Use
• Use in combination with price structure, support/resistance, and volume profile tools
• Watch how price reacts when it revisits the plotted lines
• Look for effort bars that fail to lead to continuation, signaling potential reversal
• Can be used in scalping, swing trading, or Wyckoff-style phase analysis
🔒 Technical Notes
• ✅ Does not repaint
• ✅ Built with Pine Script v6
• ✅ Lightweight and customizable
• ❌ Does not generate buy/sell signals — it provides context, not predictions

TradeScope: MA Reversion • RVOL • Trendlines • GAPs • TableTradeScope is an all-in-one technical analysis suite that brings together price action, momentum, volume dynamics, and trend structure into one cohesive and fully customizable indicator.
An advanced, modular trading suite that combines moving averages, reversion signals, RSI/CCI momentum, relative volume, gap detection, trendline analysis, and dynamic tables — all within one powerful dashboard.
Perfect for swing traders, intraday traders, and analysts who want to read price strength, volume context, and market structure in real time.
⚙️ Core Components & Inputs
🧮 Moving Average Settings
Moving Average Type & Length:
Choose between SMA or EMA and set your preferred period for smoother or more reactive trend tracking.
Multi-MA Plotting:
Up to 8 customizable moving averages (each with independent type, color, and length).
Includes a “window filter” to show only the last X bars, reducing chart clutter.
MA Reversion Engine:
Detects when price has extended too far from its moving average.
Reversion Lookback: Number of bars analyzed to determine historical extremes.
Reversion Threshold: Sensitivity multiplier—lower = more frequent signals, higher = stricter triggers.
🔄 Trend Settings
Short-Term & Long-Term Trend Lookbacks:
Uses linear regression to detect the slope and direction of the short- and long-term trend.
Results are displayed in the live table with color-coded bias:
🟩 Bullish | 🟥 Bearish
📈 Momentum Indicators
RSI (Relative Strength Index):
Adjustable period; displays the current RSI value, overbought (>70) / oversold (<30) zones, and trending direction.
CCI (Commodity Channel Index):
Customizable length with color-coded bias:
🟩 Oversold (< -100), 🟥 Overbought (> 100).
Tooltip shows whether the CCI is trending up or down.
📊 Volume Analysis
Relative Volume (RVOL):
Estimates end-of-day projected volume using intraday progress and compares it against the 20-day average.
Displays whether today’s volume is expected to exceed yesterday’s, and highlights color by strength.
Volume Trend (Short & Long Lookbacks):
Visual cues for whether current volume is above or below short-term and long-term averages.
Estimated Full-Day Volume & Multiplier:
Converts raw volume into “X” multiples (e.g., 2.3X average) for quick interpretation.
🕳️ Gap Detection
Automatically identifies and plots bullish and bearish price gaps within a defined lookback period.
Gap Lookback: Defines how far back to search for gaps.
Gap Line Width / Visibility: Controls the thickness and display of gap lines on chart.
Displays the closest open gap in the live table, including its distance from current price (%).
🔍 ATR & Volatility
14-day ATR (% of price):
Automatically converts the Average True Range into a percent, providing quick volatility context:
🟩 Low (<3%) | 🟨 Moderate (3–5%) | 🟥 High (>5%)
💬 Candlestick Pattern Recognition
Auto-detects popular reversal and continuation patterns such as:
Bullish/Bearish Engulfing
Hammer / Hanging Man
Shooting Star / Inverted Hammer
Doji / Harami / Kicking / Marubozu / Morning Star
Each pattern is shown with contextual color coding in the table.
🧱 Pivot Points & Support/Resistance
Optional Pivot High / Pivot Low Labels
Adjustable left/right bar lengths for pivot detection
Theme-aware text and label color options
Automatically drawn diagonal trendlines for both support and resistance
Adjustable line style, color, and thickness
Detects and tracks touches for reliability
Includes breakout alerts (with optional volume confirmation)
🚨 Alerts
MA Cross Alerts:
Triggers when price crosses the fast or slow moving average within a tolerance band (default ±0.3%).
Diagonal Breakout Alerts:
Detects and alerts when price breaks diagonal trendlines.
Volume-Confirmed Alerts:
Filters breakouts where volume exceeds 1.5× the 20-bar average.
🧾 Live Market Table
A fully dynamic table displayed on-chart, customizable via input toggles:
Choose which rows to show (e.g., RSI, ATR, RVOL, Gaps, CCI, Trend, MA info, Diff, Low→Close%).
Choose table position (top-right, bottom-left, etc.) and text size.
Theme selection: Light or Dark
Conditional background colors for instant visual interpretation:
🟩 Bullish or Oversold
🟥 Bearish or Overbought
🟨 Neutral / Moderate
🎯 Practical Uses
✅ Identify confluence setups combining MA reversion, volume expansion, and RSI/CCI extremes.
✅ Track trend bias and gap proximity directly in your dashboard.
✅ Monitor relative volume behavior for intraday strength confirmation.
✅ Automate MA cross or breakout alerts to stay ahead of key price action.
🧠 Ideal For
Swing traders seeking confluence-based setups
Intraday traders monitoring multi-factor bias
Analysts looking for compact market health dashboards
💡 Summary
TradeScope is designed as a single-pane-of-glass market view — combining momentum, trend, volume, structure, and reversion into one clear visual system.
Fully customizable. Fully dynamic.
Use it to see what others miss — clarity, confluence, and confidence in every trade.
