Technical Ratings on Multi-frames / Assets█ OVERVIEW
This indicator is a modified version of TECHNICAL RATING v1.0 available in the public library to provide a quick overview of consolidated technical ratings performed on 12 assets in 3 timeframes.The purpose of the indicator is to provide a quick overview of the current status of the custom 12 (24) assets and to help focus on the appropriate asset.
█ MODIFICATIONS
- Markers, visualizations and alerts have been deleted
- Due to the limitation on maximum number of security (40), the results of 12 assets evaluated in 3 different time frames can be shown at the same time.
- An additional 12 assets can be configured in the settings so that you do not have to choose each ticker one by one to facilitate a quick change, but can switch between the 12 -12 assets with a single click on "Second sets?".
- The position, colors and parameters of the table can be widely customized in the settings.
- The 12 assets can be arranged in rows 3, 4, 6 and 12 with Table Rows options, which can also be used to create a simple mobile view.
- The default gradient color setting has been changed to red/yellow/green traffic lights
ORIGINAL DESCRIPTION ABOUT TECHNICAL RATING v1.0
█ OVERVIEW
This indicator calculates TradingView's well-known "Strong Buy", "Buy", "Neutral", "Sell" or "Strong Sell" states using the aggregate biases of 26 different technical indicators.
█ WARNING
This version is similar, but not identical, to our recently published "Technical Ratings" built-in, which reproduces our "Technicals" ratings displayed as a gauge in the right panel of charts, or in the "Rating" indicator available in the TradingView Screener. This is a fork and refactoring of the code base used in the "Technical Ratings" built-in. Its calculations will not always match those of the built-in, but it provides options not available in the built-in. Up to you to decide which one you prefer to use.
█ FEATURES
Differences with the built-in version
• The built-in version produces values matching the states displayed in the "Technicals" ratings gauge; this one does not always.
• A strategy version is also available as a built-in; this script is an indicator—not a strategy.
• This indicator will show a slightly different vertical scale, as it does not use a fixed scale like the built-in.
• This version allows control over repainting of the signal when you do not use a higher timeframe. Higher timeframe (HTF) information from this version does not repaint.
• You can adjust the weight of the Oscillators and MAs components of the rating here.
• You can configure markers on signal breaches of configurable levels, or on advances declines of the signal.
The indicator's settings allow you to:
• Choose the timeframe you want calculations to be made on.
• When not using a HTF, you can select a repainting or non-repainting signal.
• When using both MAs and Oscillators groups to calculate the rating, you can vary the weight of each group in the calculation. The default is 50/50.
Because the MAs group uses longer periods for some of its components, its value is not as jumpy as the Oscillators value.
Increasing the weight of the MAs group will thus have a calming effect on the signal.
• Alerts can be created on the indicator using the conditions configured to control the display of markers.
Display
The calculated rating is displayed as columns, but you can change the style in the inputs. The color of the signal can be one of three colors: bull, bear, or neutral. You can choose from a few presets, or check one and edit its color. The color is determined from the rating's value. Between 0.1 and -0.1 it is in the neutral color. Above/below 0.1/-0.1 it will appear in the bull/bear color. The intensity of the bull/bear color is determined by cumulative advances/declines in the rating. It is capped to 5, so there are five intensities for each of the bull/bear colors.
The "Strong Buy", "Buy", "Neutral", "Sell" or "Strong Sell" state of the last calculated value is displayed to the right of the last bar for each of the three groups: All, MAs and Oscillators. The first value always reflects your selection in the "Rating uses" field and is the one used to display the signal. A "Strong Buy" or "Strong Sell" state appears when the signal is above/below the 0.5/-0.5 level. A "Buy" or "Sell" state appears when the signal is above/below the 0.1/-0.1 level. The "Neutral" state appears when the signal is between 0.1 and -0.1 inclusively.
Five levels are always displayed: 0.5 and 0.1 in the bull color, zero in the neutral color, and -0.1 and - 0.5 in the bull color.
█ CALCULATIONS
The indicator calculates the aggregate value of two groups of indicators: moving averages and oscillators.
The "MAs" group is comprised of 15 different components:
• Six Simple Moving Averages of periods 10, 20, 30, 50, 100 and 200
• Six Exponential Moving Averages of the same periods
• A Hull Moving Average of period 9
• A Volume-weighed Moving Average of period 20
• Ichimoku
The "Oscillators" group includes 11 components:
• RSI
• Stochastic
• CCI
• ADX
• Awesome Oscillator
• Momentum
• MACD
• Stochastic RSI
• Wiliams %R
• Bull Bear Power
• Ultimate Oscillator
Buscar en scripts para "technical"

Technicals Rating Strategy v420Ichimoku, HMA, RSI, Stoch, CCI, MACD, Technicals Rating Strategy is a trading Bot that looks at these chosen indicators and assigns a value to each, then calculates the result of adding each indicators result value to a overall rating, which is then compared to a user set level. Here seen on Bitcoin, it has the broker fee included in the testing result. If you choose to use it on Forex etc, perhaps remove the broker fee which is unrealistic for FX trading.
It has a Win/Loss ratio of only 40% wins, but it catches the big moves and thats the main thing, so if ELON MUSK had of used this strategy instead of BUY and HOLD, he could of made 700% instead of 7% (as is, may, 2021)
Mainly intended for use as Automated TRADE BOT.
(imagine if Elon Musk did use this bot with his 1.3 billion $ worth of BTC, the drawdown would be like, half a billion or something haha (p.s.- use smaller lotsize % to get smaller drawdown, but then smaller profit....) )
For use with any pair and timeframe. In fact there is a timeframe setting to set the strategy to look at alternative timeframe from chart, but as default will just be set to charts timeframe.

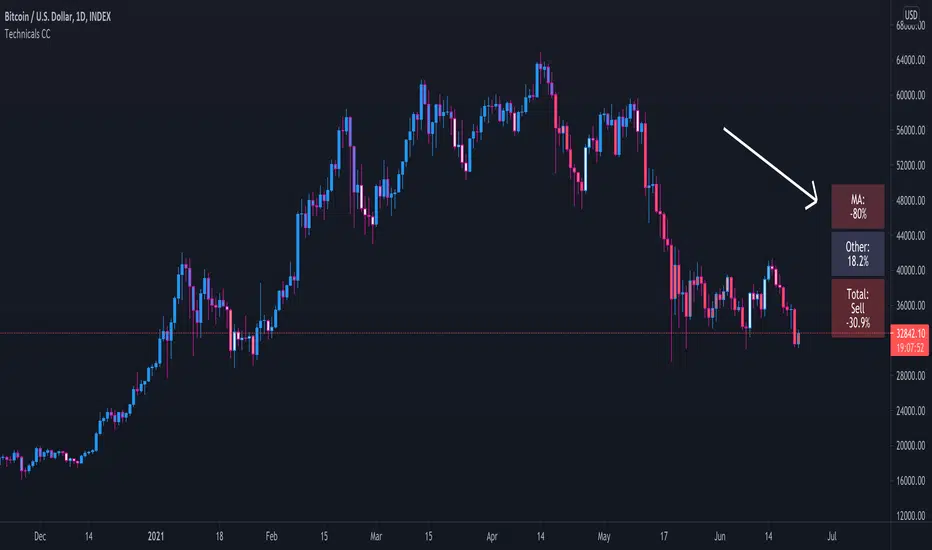
Technical Ratings Colored CandlesFor those that want technical ratings but don't want waste valuable screen real estate. Candles are colored to the rating strength. It also plots the results for "total", "MA" and "other" in a table on right of screen. Table and candle coloring can be turned off in style settings. This script uses the built in Technical Ratings indicator. For more informations on Technical Ratings please refer to official documentation.
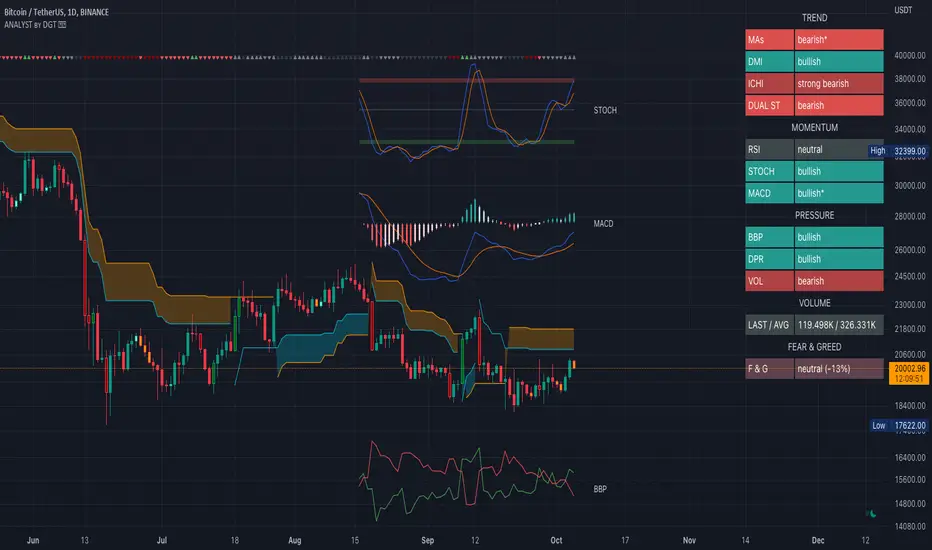
Technical Analyst by DGTWho needs a Technical Analyst?
yes I can hear someone is asking for, and here is one that can help you with technical analysis
The analyst will present a technical anlaysis report at a glance calculated by the most popular technical indicators , and the good part, the anlayst will do it voluntarily
technical skills of the analyst:
- experienced an all markets
- ability to interpret moving averages
- ability to interpret volume changes
- ability to interpret trend folowing indicators such as:
* directional movement index (dmi), identify trend strength and trend direction
* complex ichimoku cloud , identify trend stregth, and tk crosses
- ability to interpret oscillators such as:
* relative strength index, identify oversold overbought levels, identify the rsi flow
* commodity channel index, identify oversold overbought levels
* awesome identify if grawing or falling
* macd if bullish or bearish, and macd histogram if grawing or falling
- ability to calculate probability and its trend
- non-stop hardworker,
- available 7/24,
- highly dedicated always on duty,
- open for new ideas and willing to learn
- upon request the analyst will create reports with custom settings of your choise
the analyst is not a decition maker, trading success is all about following your trading strategy and the analyst aims to help with the presented reports calculated by the most popular technical indicators
the analyst supports 9 of the popular technical indicators and is willing to learn more , please share your comments and feedbacks and help the analyst improve skills
cheers!
Disclaimer : The script is for informational and educational purposes only. Use of the script does not constitutes professional and/or financial advice. You alone the sole responsibility of evaluating the script output and risks associated with the use of the script. In exchange for using the script, you agree not to hold dgtrd TradingView user liable for any possible claim for damages arising from any decision you make based on use of the script
Technical Ratings Pro - Pump WaveThis script uses the built in Technical Ratings indicator but interprets the data visually. It plots the results for "total", "MA" and "other" as pump waves. It uses MA to plot a trend line (can be turned off in settings) . Candles are colored to the rating strength and a percentage number was added to the results. For more informations on the Technical Ratings indicator please refer to official documentation.

Technical Analysis Consulting Table (TACT)Inspired by Tradingview's own "Technical Analysis Summary", I present to you a table with analogous logic.
You can track any ticker you want, no matter your chart. You can even have multiple tables to track multiple tickers. By default it tracks the Total Crypto Cap.
You can change the resolution you want to track. By default it is the same as the chart.
You can position the table to whichever corner of the chart you want. By default it draws in the bottom right corner.
Background colors and text size can be adjusted.
Indicators Used:
Oscillators
RSI(14)
STOCH(14, 3, 3)
CCI(20)
ADX(14)
AO
Momentum(10)
MACD(12, 26)
STOCH RSI(3, 3, 14, 14)
%R(14)
Bull Bear Power
UO(7,14,28)
Moving Averages
EMA(5)
SMA(5)
EMA(10)
SMA(10)
EMA(20)
SMA(20)
EMA(30)
SMA(30)
EMA(50)
SMA(50)
EMA(100)
SMA(100)
EMA(200)
SMA(200)
Ichimoku Cloud(9, 26, 52, 26)
VMWA(20)
HMA(9)
Pivots
Traditional
Fibonacci
Camarilla
Woodie
WARNING: I have observed up to a couple of seconds of signal jitter/delay, so use it with caution in very small resolutions (1s to 1m).
I hope you enjoy this and good luck with your trading. Suggestions and feedback are most welcome.

TradingView's Technical AnalysisAll indicators used on the Technical Analysis Summary from TradingView, composed with oscillators and moving averages. Sell and strong sell will represent more indicators showing sell signals. Buy and strong buy will represent more indicators showing buy signals. A white bar will show neutral signal (don't trade). This can be good for binary options or scalping on small time frames, but also very good on higher times for forex. The signal will appear on the candle before, so wait for the new candle to appear to see what direction the signal will indicate.

MTF Technical Ratings [Anan]█ OVERVIEW
This indicator is a modified version of "Technical Ratings" v5.0 available in the public library to provide a quick overview of Technical Ratings in 6 optional timeframes.
█ FEATURES
- Multi-timeframe Table.
- Display Technical Ratings for "MAs" with a percentage.
- Display Technical Ratings for "Oscillators" with a percentage.
- Display Technical Ratings for "All" with a percentage.
- Full control of displaying any row(MAs / Oscillators / All) or any column(Multi-timeframe)
- Full control of Table position and size.
- Full control of displaying any row or column.
ORIGINAL DESCRIPTION ABOUT TECHNICAL RATING v1.0
█ OVERVIEW
This indicator calculates TradingView's well-known "Strong Buy", "Buy", "Neutral", "Sell" or "Strong Sell" states using the aggregate biases of 26 different technical indicators.
█ CALCULATIONS
The indicator calculates the aggregate value of two groups of indicators: moving averages and oscillators.
The "MAs" group is comprised of 15 different components:
• Six Simple Moving Averages of periods 10, 20, 30, 50, 100 and 200
• Six Exponential Moving Averages of the same periods
• A Hull Moving Average of period 9
• A Volume-weighed Moving Average of period 20
• Ichimoku
The "Oscillators" group includes 11 components:
• RSI
• Stochastic
• CCI
• ADX
• Awesome Oscillator
• Momentum
• MACD
• Stochastic RSI
• Wiliams %R
• Bull Bear Power
• Ultimate Oscillator
The state of each group's components is evaluated to a +1/0/-1 value corresponding to its bull/neutral/bear bias. The resulting value for each of the two groups are then averaged to produce the overall value for the indicator, which oscillates between +1 and -1. The complete conditions used in the calculations are documented in the Help Center.

TVMC - Composite Indicator with Technical RatingsDescription:
The TVMC (Trend, Volume, Momentum, Composite) indicator is a powerful multi-component tool designed to provide traders with a comprehensive understanding of market conditions. By combining four essential technical analysis components—trend, momentum, volume, and volatility—this indicator offers clear and actionable insights to assist in decision-making.
Key Features:
1. Trend Component (TC):
* Based on MACD (Moving Average Convergence Divergence), this component analyzes the relationship between two exponential moving averages (fast and slow) to determine the prevailing market trend.
* The MACD signal is normalized to a range of -1 to +1 for consistency and clarity.
2. Momentum Component (MC):
* Utilizes RSI (Relative Strength Index) to measure the strength and speed of price movements.
* This component highlights overbought or oversold conditions, which may indicate potential market reversals.
3. Volume Confirmation (VC):
* Compares the current trading volume to its moving average over a specified period.
* High volume relative to the average confirms the validity of the current trend.
4. Volatility Filter (VF):
* Uses ATR (Average True Range) to gauge market volatility.
* Adjusts and smooths signals to reduce noise during periods of high volatility.
5. Technical Ratings Integration:
* Incorporates TradingView’s Technical Ratings, allowing users to validate signals using moving averages, oscillators, or a combination of both.
* Users can choose their preferred source of ratings for enhanced signal confirmation.
How It Works:
The TVMC indicator combines the weighted contributions of the Trend, Momentum, and Volume components, further refined by the Volatility Filter. Each component plays a specific role:
* Trend: Identifies whether the market is bullish, bearish, or neutral.
* Momentum: Highlights the strength of price action.
* Volume: Confirms whether the current price action is supported by sufficient trading activity.
* Volatility: Filters out excessive noise in volatile market conditions, providing a smoother and more reliable output.
Visualization:
1. Bullish Signals:
* The indicator line turns green and remains above the zero line, indicating upward momentum.
2. Bearish Signals:
* The indicator line turns red and falls below the zero line, signaling downward momentum.
3. Neutral Signals:
* The line is orange and stays near zero, indicating a lack of strong trend or momentum.
4. Zones:
* Horizontal lines at +30 and -30 mark strong bullish and bearish zones, respectively.
* A zero line is included for clear separation between bullish and bearish signals.
Recommended Usage:
* Best Timeframes: The indicator is optimized for higher timeframes such as 4-hour (H4) and daily (D1) charts.
* Trading Style: Suitable for swing and positional trading.
* Customization: The indicator allows users to adjust all major parameters (e.g., MACD, RSI, volume, and ATR settings) to fit their trading preferences.
Customization Options:
* Adjustable weights for Trend, Momentum, and Volume components.
* Fully configurable settings for MACD, RSI, Volume SMA, and ATR periods.
* Timeframe selection for multi-timeframe analysis.
Important Notes:
1. Originality: The TVMC indicator combines multiple analysis methods into a unique framework. It does not replicate or minimally modify existing indicators.
2. Transparency: The description is detailed enough for users to understand the methodology without requiring access to the code.
3. Clarity: The indicator is explained in a way that is accessible even to users unfamiliar with complex technical analysis tools.
Compliance with TradingView Rules:
* The indicator is written in Pine Script version 5, adhering to TradingView’s language standards.
* The description is written in English to ensure accessibility to the global community, with a clear explanation of all components and functionality.
* No promotional content, links, or unrelated references are included.
* The chart accompanying the indicator is clean and demonstrates its intended use clearly, with no additional indicators unless explicitly explained.

Trend Indicator with BUY SELL signalsThe Script can be used to identify the main trend and take BUY/SELL decisions in the lower time frames.
The tool can be applied as follows
1) Apply the tool your favorite chart
2) Select the main trend.
3) Go to lower time frames to check the BUY/SELL signals. Example: If the selected main trend is 4 hrs then go to time frames below 4 hrs to find the entry and exit positions.
Feel free to reach out to me if you need any further information

TechnicalRating█ OVERVIEW
This library is a Pine Script™ programmer’s tool for incorporating TradingView's well-known technical ratings within their scripts. The ratings produced by this library are the same as those from the speedometers in the technical analysis summary and the "Rating" indicator in the Screener , which use the aggregate biases of 26 technical indicators to calculate their results.
█ CONCEPTS
Ensemble analysis
Ensemble analysis uses multiple weaker models to produce a potentially stronger one. A common form of ensemble analysis in technical analysis is the usage of aggregate indicators together in hopes of gaining further market insight and reinforcing trading decisions.
Technical ratings
Technical ratings provide a simplified way to analyze financial markets by combining signals from an ensemble of indicators into a singular value, allowing traders to assess market sentiment more quickly and conveniently than analyzing each constituent separately. By consolidating the signals from multiple indicators into a single rating, traders can more intuitively and easily interpret the "technical health" of the market.
Calculating the rating value
Using a variety of built-in TA functions and functions from our ta library, this script calculates technical ratings for moving averages, oscillators, and their overall result within the `calcRatingAll()` function.
The function uses the script's `calcRatingMA()` function to calculate the moving average technical rating from an ensemble of 15 moving averages and filters:
• Six Simple Moving Averages and six Exponential Moving Averages with periods of 10, 20, 30, 50, 100, and 200
• A Hull Moving Average with a period of 9
• A Volume-Weighted Moving Average with a period of 20
• An Ichimoku Cloud with a conversion line length of 9, base length of 26, and leading span B length of 52
The function uses the script's `calcRating()` function to calculate the oscillator technical rating from an ensemble of 11 oscillators:
• RSI with a period of 14
• Stochastic with a %K period of 14, a smoothing period of 3, and a %D period of 3
• CCI with a period of 20
• ADX with a DI length of 14 and an ADX smoothing period of 14
• Awesome Oscillator
• Momentum with a period of 10
• MACD with fast, slow, and signal periods of 12, 26, and 9
• Stochastic RSI with an RSI period of 14, a %K period of 14, a smoothing period of 3, and a %D period of 3
• Williams %R with a period of 14
• Bull Bear Power with a period of 50
• Ultimate Oscillator with fast, middle, and slow lengths of 7, 14, and 28
Each indicator is assigned a value of +1, 0, or -1, representing a bullish, neutral, or bearish rating. The moving average rating is the mean of all ratings that use the `calcRatingMA()` function, and the oscillator rating is the mean of all ratings that use the `calcRating()` function. The overall rating is the mean of the moving average and oscillator ratings, which ranges between +1 and -1. This overall rating, along with the separate MA and oscillator ratings, can be used to gain insight into the technical strength of the market. For a more detailed breakdown of the signals and conditions used to calculate the indicators' ratings, consult our Help Center explanation.
Determining rating status
The `ratingStatus()` function produces a string representing the status of a series of ratings. The `strongBound` and `weakBound` parameters, with respective default values of 0.5 and 0.1, define the bounds for "strong" and "weak" ratings.
The rating status is determined as follows:
Rating Value Rating Status
< -strongBound Strong Sell
< -weakBound Sell
-weakBound to weakBound Neutral
> weakBound Buy
> strongBound Strong Buy
By customizing the `strongBound` and `weakBound` values, traders can tailor the `ratingStatus()` function to fit their trading style or strategy, leading to a more personalized approach to evaluating ratings.
Look first. Then leap.
█ FUNCTIONS
This library contains the following functions:
calcRatingAll()
Calculates 3 ratings (ratings total, MA ratings, indicator ratings) using the aggregate biases of 26 different technical indicators.
Returns: A 3-element tuple: ( [(float) ratingTotal, (float) ratingOther, (float) ratingMA ].
countRising(plot)
Calculates the number of times the values in the given series increase in value up to a maximum count of 5.
Parameters:
plot : (series float) The series of values to check for rising values.
Returns: (int) The number of times the values in the series increased in value.
ratingStatus(ratingValue, strongBound, weakBound)
Determines the rating status of a given series based on its values and defined bounds.
Parameters:
ratingValue : (series float) The series of values to determine the rating status for.
strongBound : (series float) The upper bound for a "strong" rating.
weakBound : (series float) The upper bound for a "weak" rating.
Returns: (string) The rating status of the given series ("Strong Buy", "Buy", "Neutral", "Sell", or "Strong Sell").

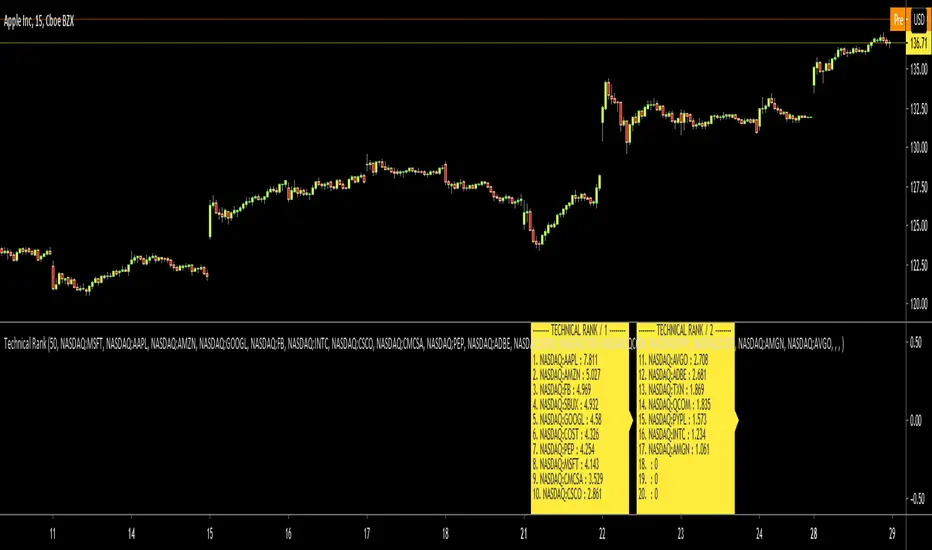
Technical RankHello Traders,
Technical Rank (TR) was authored by John Murphy . Technical Rank shows how a security is performing relative to its peers. Multiple moving averages, rate of change and the Relative Strength Index (RSI) indicators are used to calculate the Technical Rank. These values are mathematically manipulated with percentage factors and then summed together. there are 3 parts, long term, middle term and short term. for Long term part Moving Average with length 200 (30%) and Rate of Change with the length 125 (30%) are used, for middle term part, Moving Average with length 50 (15%) and Rate of Change with the length 20 (15%) are used and for short term part, PPO (5%) and RSI (5%) used.
Technical Rank is created using the following formula and weightings:
Long-Term Indicators (weighting): Percent above/below the 200-day exponential moving average (EMA) (30% weight) and the 125-day rate-of-change (ROC) (30% weight).
Medium-Term Indicators (weighting): Percent above/below 50-day EMA (15%) and the 20-day rate-of-change (15%).
Short-Term Indicators (weighting): Three-day slope of percentage price oscillator histogram divided by three (5%) and the relative strength index (5%).
The scripts calculates Technical Rank for 10 different securities and sorts them by Technical Rank value. A ranking of zero indicates the stock is the weakest in the group technically. A rank of 100 indicates the stock ranks highest in terms of technical performance. An increasing Technical Rank means the stock's price performance is showing strength relative to the group of stock being analyzed. A decreasing Technical Rank shows deteriorating relative price performance. Securities in the top 3-4 will have a technical rank of 70 or higher. You should focus on these relatively strong securities for potential long positions on pullbacks. You can also use the technical rank to avoid weak securities (in the bottom 3-4). I recommend you to check Technical Rank for the securities in multiple time frames.
You can choose the symbols as you want but you should choose the symbols with the same session info. for example only Cryptos, only Stocks, only FX pairs etc. (not mix of them).
Enjoy!
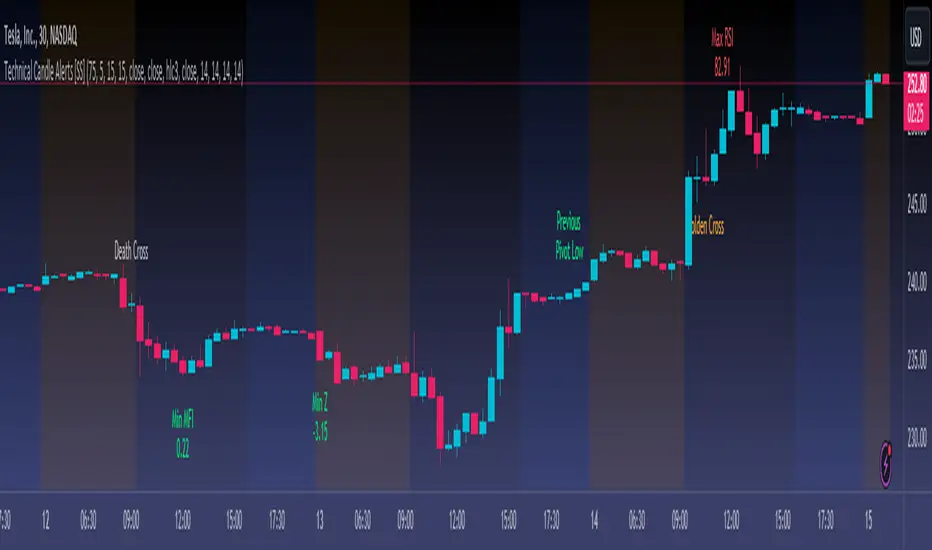
Technical Candle Alerts [SS]Releasing this fun little project indicator.
What is it?
The Technical Candle Alert indicator provides alerts based on multiple underlying technicals, including MFI, RSI, Stochastics, Z-Score, Pivot points and the EMA 50 and EMA 200 Death and Golden Cross.
What does it do?
The indicator looks back over a designated timeframe to look for max and min values of technicals, as well as track the EMA200 and EMA50.
When a candle approaches a previous max zone, pivot point or there is a death or golden cross, the indicator will signal on the candle that has triggered this event. Then you, as the trader, can determine whether you want to listen to the signal or ignore it.
How Does it Work?
The indicator is set to default and generally accepted settings for technicals, however you can modify them as you prefer.
The indicator is also programmed to identify the strongest trend period and set that as the lookback length. The theory is, you want to look at max and min technicals as well as pivot points in a recent area of a strong trend. However, if you want to over-ride the auto trend identification, you can simply unselect "Autotrend" and put in your desired manual lookback length.
The indicator will then keep track of max values for the various technicals and present you with alerts directly over the candle when a Max or Min value is triggered, or a pivot point is entered, etc.
Here are some examples:
Golden Cross:
Death Cross:
Previous Pivot Points:
Various Alerts:
Customization:
You can customize which alerts you want to turn off and on.
As well, there is a signal delay setting (wait setting). This prevents repeated, unnecessary signaling of the same signal. The default wait time is 5 signals, however you can adjust based on your desired tolerance. If you want it to always signal, adjust it to 0.
As indicated before, you can also adjust all of the technicals and the pivot bars for high and low pivots and you can manually set your lookback length.
That is the indicator in a nutshell, let me know if you have any questions that may not have been covered in the description. Its pretty straight forward once you play around with it.
Safe trades everyone and thanks for checking this out!
Technical Ratings█ OVERVIEW
This indicator calculates TradingView's well-known "Strong Buy", "Buy", "Neutral", "Sell" or "Strong Sell" states using the aggregate biases of 26 different technical indicators.
█ FEATURES
Differences with the built-in version
• You can adjust the weight of the Oscillators and MAs components of the rating here.
• The built-in version produces values matching the states displayed in the "Technicals" ratings gauge; this one does not always, where weighting is used.
• A strategy version is also available as a built-in; this script is an indicator—not a strategy.
• This indicator will show a slightly different vertical scale, as it does not use a fixed scale like the built-in.
• This version allows control over repainting of the signal when you do not use a higher timeframe. Higher timeframe (HTF) information from this version does not repaint.
• You can configure markers on signal breaches of configurable levels, or on advances declines of the signal.
The indicator's settings allow you to:
• Choose the timeframe you want calculations to be made on.
• When not using a HTF, you can select a repainting or non-repainting signal.
• When using both MAs and Oscillators groups to calculate the rating, you can vary the weight of each group in the calculation. The default is 50/50.
Because the MAs group uses longer periods for some of its components, its value is not as jumpy as the Oscillators value.
Increasing the weight of the MAs group will thus have a calming effect on the signal.
• Alerts can be created on the indicator using the conditions configured to control the display of markers.
Display
The calculated rating is displayed as columns, but you can change the style in the inputs. The color of the signal can be one of three colors: bull, bear, or neutral. You can choose from a few presets, or check one and edit its color. The color is determined from the rating's value. Between 0.1 and -0.1 it is in the neutral color. Above/below 0.1/-0.1 it will appear in the bull/bear color. The intensity of the bull/bear color is determined by cumulative advances/declines in the rating. It is capped to 5, so there are five intensities for each of the bull/bear colors.
The "Strong Buy", "Buy", "Neutral", "Sell" or "Strong Sell" state of the last calculated value is displayed to the right of the last bar for each of the three groups: All, MAs and Oscillators. The first value always reflects your selection in the "Rating uses" field and is the one used to display the signal. A "Strong Buy" or "Strong Sell" state appears when the signal is above/below the 0.5/-0.5 level. A "Buy" or "Sell" state appears when the signal is above/below the 0.1/-0.1 level. The "Neutral" state appears when the signal is between 0.1 and -0.1 inclusively.
Five levels are always displayed: 0.5 and 0.1 in the bull color, zero in the neutral color, and -0.1 and - 0.5 in the bull color.
The levels that can be used to determine the breaches displaying long/short markers will only be visible when their respective long/short markers are turned on in the "Direction" input. The levels appear as a bright dotted line in bull/bear colors. You can control both levels separately through the "Longs Level" and "Shorts Level" inputs.
If you specify a higher timeframe that is not greater than the chart's timeframe, an error message will appear and the indicator's background will turn red, as it doesn't make sense to use a lower timeframe than the chart's.
Markers
Markers are small triangles that appear at the bottom and top of the indicator's pane. The marker settings define the conditions that will trigger an alert when you configure an alert on the indicator. You can:
• Choose if you want long, short or both long and short markers.
• Determine the signal level and/or the number of cumulative advances/declines in the signal which must be reached for either a long or short marker to appear.
Reminder: the number of advances/declines is also what controls the brightness of the plotted signal.
• Decide if you want to restrict markers to ones that alternate between longs and shorts, if you are displaying both directions.
This helps to minimize the number of markers, e.g., only the first long marker will be displayed, and then no more long markers will appear until a short comes in, then a long, etc.
Alerts
When you create an alert from this indicator, that alert will trigger whenever your marker conditions are confirmed. Before creating your alert, configure the makers so they reflect the conditions you want your alert to trigger on.
The script uses the alert() function, which entails that you select the "Any alert() function call" condition from the "Create Alert" dialog box when creating alerts on the script. The alert messages can be configured in the inputs. You can safely disregard the warning popup that appears when you create alerts from this script. Alerts will not repaint. Markers will appear, and thus alerts will trigger, at the opening of the bar following the confirmation of the marker condition. Markers will never disappear from the bar once they appear.
Repainting
This indicator uses a two-pronged approach to control repainting. The repainting of the displayed signal is controlled through the "Repainting" field in the script's inputs. This only applies when you have "Same as chart" selected in the "Timeframe" field, as higher timeframe data never repaints. Regardless of that setting, markers and thus alerts never repaint.
When using the chart's timeframe, choosing a non-repainting signal makes the signal one bar late, so that it only displays a value once the bar it was calculated has elapsed. When using a higher timeframe, new values are only displayed once the higher timeframe completes.
Because the markers never repaint, their logic adapts to the repainting setting used for the signal. When the signal repaints, markers will only appear at the close of a realtime bar. When the signal does not repaint (or if you use a higher timeframe), alerts will appear at the beginning of the realtime bar, since they are calculated on values that already do not repaint.
█ CALCULATIONS
The indicator calculates the aggregate value of two groups of indicators: moving averages and oscillators.
The "MAs" group is comprised of 15 different components:
• Six Simple Moving Averages of periods 10, 20, 30, 50, 100 and 200
• Six Exponential Moving Averages of the same periods
• A Hull Moving Average of period 9
• A Volume-weighed Moving Average of period 20
• Ichimoku
The "Oscillators" group includes 11 components:
• RSI
• Stochastic
• CCI
• ADX
• Awesome Oscillator
• Momentum
• MACD
• Stochastic RSI
• Wiliams %R
• Bull Bear Power
• Ultimate Oscillator
The state of each group's components is evaluated to a +1/0/-1 value corresponding to its bull/neutral/bear bias. The resulting value for each of the two groups are then averaged to produce the overall value for the indicator, which oscillates between +1 and -1. The complete conditions used in the calculations are documented in the Help Center .
█ NOTES
Accuracy
When comparing values to the other versions of the Rating, make sure you are comparing similar timeframes, as the "Technicals" gauge in the chart's right pane, for example, uses a 1D timeframe by default.
For coders
We use a handy characteristic of array.avg() which, contrary to avg() , does not return na when one of the averaged values is na . It will average only the array elements which are not na . This is useful in the context where the functions used to calculate the bull/neutral/bear bias for each component used in the rating include special checks to return na whenever the dataset does not yet contain enough data to provide reliable values. This way, components gradually kick in the calculations as the script calculates on more and more historical data.
We also use the new `group` and `tooltip` parameters to input() , as well as dynamic color generation of different transparencies from the bull/bear/neutral colors selected by the user.
Our script was written using the PineCoders Coding Conventions for Pine .
The description was formatted using the techniques explained in the How We Write and Format Script Descriptions PineCoders publication.
Bits and pieces were lifted from the PineCoders' MTF Selection Framework .
Look first. Then leap.

Stock Tech Bot One ViewTechnical indicators are not limited. Hence, here is another indicator with the combination of OBV, RSI, and MACD along with support, and resistance that follows the price while honoring the moving average of 200, 90 & 50.
The default lookback period of this indicator is 21 though it is changeable as per the user's desire.
The highest high and lowest low for the last 21 days lookback period proven to be the perfect Support & Resistance as the price of particular stock values are decided by market psychology. The support and resistance lines are very important to understand the market psychology which is very well proven with price action patterns and the lines are drawn based on,
Lower Extreme = 0.1 (Changeable)
Maximum Range = 21 days highest high - 21 days lowest low.
Support Line = 21 days lowest low + (Maximum Range * Lower Extreme)
Resistance Line = 21 days highest high - (Maximum Range * Lower Extreme)
RSI - Relative strength indicator is very famous to find the market momentum within the range of 0 - 100. Though the lookback period is changeable, the 14 days lookback period is the perfect match as the momentum of market movement for the last 3 weeks will always assist to identify the market regime. Here the momentum is just to highlight the indication (green up arrow under the candle for long and red down arrow above the candle for short) of market movement though it is not very important to consider if the price of the stock respect the support & resistance lines along with volume indicator (* = violet color).
OBV - Momentum:
The on-balance volume is always going indicator on any kind of tickers, which helps to identify the buying interest. Now, applying momentum on OBV with the positive movement for at least two consecutive days gives perfect confirmation for entry. A combination of the price along with this momentum(OBV) in the chart will help us to know the whipsaw in the price.
The Symbol "*" on top of each bar shows the market interest in that particular stock. If your ticker is fundamentally strong then you can see this "*" even when the market falls.
MACD:
One of the favorites and simple indicators widely used, where the thump of the rule is not to change the length even if it is allowed. It's OK to believe blindly in certain indicator and consider it while trading. That's why the indicator changes the bar color by following the MACD histogram.
Volume:
It may be the OBV works based on the open price and close price along with volume movement, it is wise to have the volume that is plotted along with price movement that should help you to decide whether the market is greedy or fearful.
The symbol "-" on top of each bar tells you a lot and don't ignore it.
Moving Average:
Moving average is a very good trend indicator as everyone considers seeing along with the price in the chart which is not omitted while we gauge the price movement alone with volume in this indicator. The 200, 90 & 50 MA's are everyone's favorite, and the same is plotted on the chart.
As explained above, the combination of all four indicators with price movement will give us very good confidence to take entry.
Candlestick Pattern:
You should admire the techniques of the candlestick pattern as you navigate the chart from right to left. Though there are a lot of patterns that exist, it is easy to enable and disable to view the signal as the label.
Further, last but not least, the exit always depends on individual conviction and how often the individual watch the price movement, if your conviction is strong then follow the down arrow red indication. If not, then exit with a trailing stop that indicates the bar with orange color.
Happy investing
Note: It is just a combination of multiple indicators and patterns to get one holistic view. So, the credit goes to all wise developers who publically published.

Technical Dashboard with High and Low Price Prediction Hello everyone!
I am releasing this indicator. It is called the Technical Dashboard and the name is pretty self explanatory! So let's get into it:
What it does:
The technical dashboard displays 4 commonly used technical indicators: Stochastics, RSI, Z-Score and MFI. It will display the current value of each of these technical indicators, as well as the highest and lowest value over a user defined period and the SMA.
The user can input the source and lookback period for each of the indicators individually. It is defaulted to 14, but I do recommend using a larger lookback time period as 14 tends to be a little too narrow.
The indicator will display a notice of whether the stock is trading in a max range, min range or neutral range based on its previous highest and lowest range. If the stock is trading between the highest and lowest range, it will display a neutral range reading.
In addition to displaying those 4 commonly used technical indicators, the indicator will also display the highest and lowest highs and lows of a ticker over a user defined period. You can opt for it to plot out the High and Low SMA and select your timeframe for these SMA plots.
The current value for the High and Low actually depicts a predicted High and Low based on the user defined lookback period. The Current Range column will show you when and if the predicted high or low is reached. The high and low defaults to the timeframe you are on. So if you are trading off the 5 minute chart, it will display the predicted high and low on the 5 minute time frame. The 1 hour, it will show the 1 hour, etc. It provides price prediction using a simple regression based analysis that pinescript provides.
Examples of its use:
In the image above, you can see how the indicator shows you when the stock is trading in some of its max ranges.
Note that just because a stock is trading in its max or min range does not necessarily mean that the stock is going to reverse in the opposite direction. While highest and lowest represent previous areas of reversal, it doesn't always mean that it will result in a reversal again. What it tells us more is whether momentum has picked up one way or the other, be it bearish or bullish momentum. This is useful information to help us decide whether a ticker has good momentum and whether a move is likely to have follow through. However, a stock trading in its high or low range can indeed signal a reversal. It is important to pay attention to the underlying price action and plan your trades accordingly.
Customizations
All of the indicators are individually customizable, from lookback length, SMA length and input source for RSI, Z-Score and MFI.
In addition to the lookback periods, you can also view highest and lowest ranges based on the SMA length. If you select "Show reversals based on SMA", the indicator will display the highest and lowest values of the SMA instead of the stock itself.
Gauging Strength:
You can use this indicator to gauge strength in many ways. First of all, your ability to see where a stock is trading relative to its historically high and low technical ranges helps you determine the overall momentum of the stock. However, you can have the indicator plot the predicted high and low ranges (see image below):
The green arrows are pointing to areas where the stock is breaking past its high levels. This shows that the over-arching sentiment is bullish. However, we can see when it starts to lose steam, it stops touching the high values and starts to touch and break below the low values (red arrows). This signals to us that the stock is losing the bullish momentum and we should be alert for a reversal to the downside or upside, depending on the setup.
There are many applications you can use it for and there is a lot of customizability. Play around with it and let me know what you think, how it helps you and any suggestions for its improvement.
As always, I have prepared a quick video tutorial on getting started with the setups on the indicator which is linked below:
Thank you all for checking this out and safe trades everyone!

Technical Summary VWAP | RSI | VolatilityTechnical Summary VWAP | RSI | Volatility
The Quantum Trading Matrix is a multi-dimensional market-analysis dashboard designed as an educational and idea-generation tool to help traders read price structure, participation, momentum and volatility in one compact view. It is not an automated execution system; rather, it aggregates lightweight “quantum” signals — VWAP position, momentum oscillator behaviour, multi-EMA trend scoring, volume flow and institutional activity heuristics, market microstructure pivots and volatility measures — and synthesizes them into a single, transparent score and signal recommendation. The primary goal is to make explicit why a given market looks favourable or unfavourable by showing the individual ingredients and how they combine, enabling traders to learn, test and form rules based on observable market mechanics.
Each module of the matrix answers a distinct market question. VWAP and its percentage distance indicate whether the current price is trading above or below the intraday volume-weighted average — a proxy for intraday institutional control and value. The quantum momentum oscillator (fast and slow EMA difference scaled to percent) captures short-to-intermediate momentum shifts, providing a quickly responsive view of directional pressure. Multi-EMA trend scoring (8/21/50) produces a simple, transparent trend score by counting conditions such as price above EMAs and cross-EMAs ordering; this score is used to categorize market trend into descriptive buckets (e.g., STRONG UP, WEAK UP, NEUTRAL, DOWN). Volume analysis compares current volume to a recent moving average and computes a Z-score to detect spikes and unusual participation; additional buy/sell pressure heuristics (buyingPressure, sellingPressure, flowRatio) estimate whether upside or downside participation dominates the bar. Institutional activity is approximated by flagging large orders relative to volume baseline (e.g., volume > 2.5× MA) and estimating a dark pool proxy; this is a heuristic to highlight bars that likely had large players involved.
The dashboard also performs market-structure detection with small pivot windows to identify recent local support/resistance areas and computes price position relative to the daily high/low (dailyMid, pricePosition). Volatility is measured via ATR divided by price and bucketed into LOW/NORMAL/HIGH/EXTREME categories to help you adapt stop sizing and expectational horizons. Finally, all these pieces feed an interpretable scoring function that rewards alignment: VWAP above, strong flow ratio, bullish trend score, bullish momentum, and favorable RSI zone add to the overall score which is presented as a 0–100 metric and a colored emoji indicator for at-a-glance assessment.
The mashup is purposeful: each indicator covers a failure mode of the other. For example, momentum readings can be misleading during volatility spikes; VWAP informs whether institutions are on the bid or offer; volume Z-score detects abnormal participation that can validate a breakout; multi-EMA score mitigates single-EMA whipsaws by requiring a combination of price/EMA conditions. Combining these signals increases information content while keeping each component explainable — a key compliance requirement. The script intentionally emphasizes transparency: when it shows a BUY/SELL/HOLD recommendation, the dashboard shows the underlying sub-components so a trader can see whether VWAP, momentum, volume, trend or structure primarily drove the score.
For practical use, adopt a clear workflow: (1) check the matrix score and read the component tiles (VWAP position, momentum, trend and volume) to understand the drivers; (2) confirm market-structure support/resistance and pricePosition relative to the daily range; (3) require at least two corroborating components (for example, VWAP ABOVE + Momentum BULLISH or Volume spike + Trend STRONG UP) before considering entries; (4) use ATR-based stops or daily pivot distance for stop placement and size positions such that the trade risks a small, pre-defined percent of capital; (5) for intraday scalps shorten holding time and tighten stops, for swing trades increase lookback lengths and require multi-timeframe (higher TF) agreement. Treat the matrix as an idea filter and replay lab: when an alert triggers, replay the bars and observe which components anticipated the move and which lagged.
Parameter tuning matters. Shortening the momentum length makes the oscillator more sensitive (useful for scalping), while lengthening it reduces noise for swing contexts. Volume profile bars and MA length should match the instrument’s liquidity — increase the MA for low-liquidity stocks to reduce false institutional flags. The trend multiplier and signal sensitivity parameters let you calibrate how aggressively the matrix counts micro evidence into the score. Always backtest parameter sets across multiple periods and instruments; run walk-forward tests and keep a simple out-of-sample validation window to reduce overfitting risk.
Limitations and failure modes are explicit: institutional flags and dark-pool estimates are heuristics and cannot substitute for true tape or broker-level order flow; volume split by price range is an approximation and will not perfectly reflect signed volume; pivot detection with small windows may miss larger structural swings; VWAP is typically intraday-centric and less meaningful across multi-day swing contexts; the score is additive and may not capture non-linear relationships between features in extreme market regimes (e.g., flash crashes, circuit breaker events, or overnight gaps). The matrix is also susceptible to false signals during major news releases when price and volume behavior dislocate from typical patterns. Users should explicitly test behavior around earnings, macro data and low-liquidity periods.
To learn with the matrix, perform these experiments: (A) collect all BUY/SELL alerts over a 6-month period and measure median outcome at 5, 20 and 60 bars; (B) require additional gating conditions (e.g., only accept BUY when flowRatio>60 and trendScore≥4) and compare expectancy; (C) vary the institutional threshold (2×, 2.5×, 3× volumeMA) to see how many true positive spikes remain; (D) perform multi-instrument tests to ensure parameters are not tuned to a single ticker. Document every test and prefer robust, slightly lower returns with clearer logic rather than tuned “optimal” results that fail out of sample.
Originality statement: This script’s originality lies in the curated combination of intraday value (VWAP), multi-EMA trend scoring, momentum percent oscillator, volume Z-score plus buy/sell flow heuristics and a compact, interpretable scoring system. The script is not a simple indicator mashup; it is a didactic ensemble specifically designed to make internal rationale visible so traders can learn how each market characteristic contributes to actionable probability. The tool’s novelty is its emphasis on interpretability — showing the exact contributing signals behind a composite score — enabling reproducible testing and educational value.
Finally, for TradingView publication, include a clear description listing the modules, a short non-technical summary of how they interact, the tunable inputs, limitations and a risk disclaimer. Remove any promotional content or external contact links. If you used trademark symbols, either provide registration details or remove them. This transparent documentation satisfies TradingView’s requirement that mashups justify their composition and teach users how to use them.
Quantum Trading Matrix — multi-factor intraday dashboard (educational use only).
Purpose: Combines intraday VWAP position, a fast/slow EMA momentum percent oscillator, multi-EMA trend scoring (8/21/50), volume Z-score and buy/sell flow heuristics, pivot-based microstructure detection, and ATR-based volatility buckets to produce a transparent, componentized market score and trade-idea indicator. The mashup is intentional: VWAP identifies intraday value, momentum detects short bursts, EMAs provide structural trend bias, and volume/flow confirm participation. Signals require alignment of at least two components (for example, VWAP ABOVE + Momentum BULLISH + positive flow) for higher confidence.
Inputs: momentum period, volume MA/profile length, EMA configuration (8/21/50), trend multiplier, signal sensitivity, color and display options. Use shorter momentum lengths for scalps and longer for swing analysis. Increase volume MA for thinly traded instruments.
Limitations: Institutional/dark-pool estimates and flow heuristics are approximations, not actual exchange tape. VWAP is intraday-focused. Expect false signals during major news or low-liquidity sessions. Backtest and paper-trade before applying real capital.
Risk Disclaimer: For education and analysis only. Not financial advice. Use proper risk management. The author is not responsible for trading losses.
________________________________________
Risk & Misuse Disclaimer
This indicator is provided for education, analysis and idea generation only. It is not investment or financial advice and does not guarantee profits. Institutional activity flags, dark-pool estimates and flow heuristics are approximations and should not be treated as exchange tape. Backtest thoroughly and use demo/paper accounts before trading real capital. Always apply appropriate position sizing and stop-loss rules. The author is not responsible for any trading losses resulting from the use or misuse of this tool.
________________________________________
Risk Disclaimer: This tool is provided for education and analysis only. It is not financial advice and does not guarantee returns. Users assume all risk for trades made based on this script. Back test thoroughly and use proper risk management.

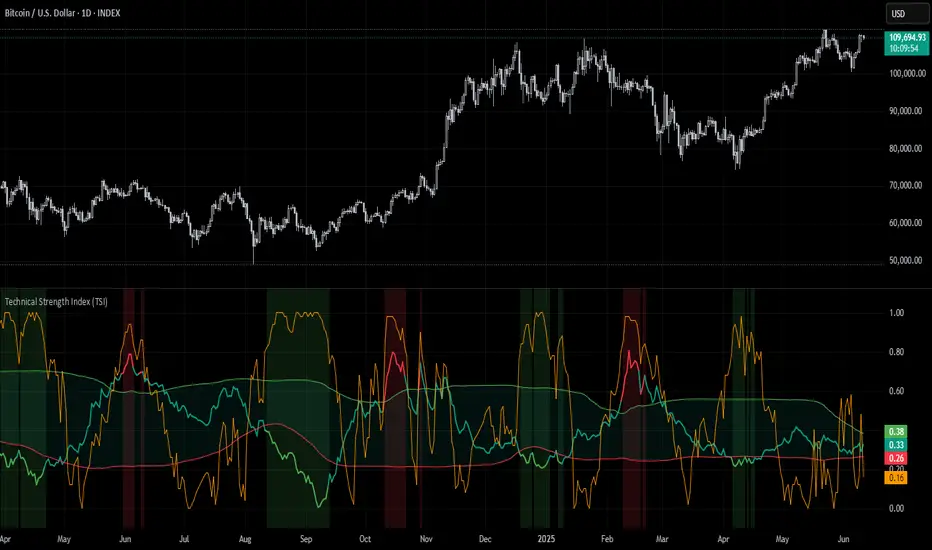
Technical Strength Index (TSI)📘 TSI with Dynamic Bands – Technical Strength Index
The TSI with Dynamic Bands is a multi-factor indicator designed to measure the statistical strength and structure of a trend. It combines several quantitative metrics into a single, normalized score between 0 and 1, allowing traders to assess the technical quality of market moves and detect overbought/oversold conditions with adaptive precision.
🧠 Core Components
This indicator draws from the StatMetrics library, blending:
📈 Trend Persistence: via the Hurst exponent, indicating whether price action is mean-reverting or trending.
📉 Risk-Adjusted Volatility: via the inverted , rewarding smoother, less erratic price movement.
🚀 Momentum Strength: using a combination of directional momentum and Z-score–normalized returns.
These components are normalized and averaged into the TSI line.
🎯 Features
TSI Line: Composite score of trend quality (0 = weak/noise, 1 = strong/structured).
Dynamic Bands: Mean ± 1 standard deviation envelopes provide adaptive context.
Overbought/Oversold Detection: Based on a rolling quantile (e.g. 90th/10th percentile of TSI history).
Signal Strength Bar (optional): Measures how statistically extreme the current TSI value is, helping validate confidence in trade setups.
Dynamic Color Cues: Background and bar gradients help visually identify statistically significant zones.
📈 How to Use
Look for overbought (red background) or oversold (green background) conditions as potential reversal zones.
Confirm trend strength with the optional signal strength bar — stronger values suggest higher signal confidence.
Use the TSI line and context bands to filter out noisy ranges and focus on structured price moves.
⚙️ Inputs
Lookback Period: Controls the smoothing and window size for statistical calculations.
Overbought/Oversold Quantiles: Adjust the thresholds for signal zones.
Plot Signal Strength: Enable or disable the signal confidence bar.
Overlay Signal Strength: Show signal strength in the same panel (compact) or not (cleaner TSI-only view).
🛠 Example Use Cases
Mean reversion traders identifying reversal zones with statistical backing
Momentum/Trend traders confirming structure before entries
Quantitative dashboards or multi-asset screening tools
⚠️ Disclaimer
This script is for educational and informational purposes only. It does not constitute financial advice or a recommendation to buy or sell any financial instrument.
This AI is not a financial advisor; please consult your financial advisor for personalized advice.
Technical Ratings on ChartThis is a version of our Technical Ratings indicator that goes on the chart. It shows only the current "Strong Buy", "Buy", "Neutral", "Sell" or "Strong Sell" rating for the chart's symbol, which you can see in the upper-right of this chart.
You can choose the location, size and colors used for the rating, and use a higher timeframe to calculate it.
Look first. Then leap.
Technical Analysis - Binary Option AlertA. Oscillators & B. Moving Averages base on TradingView's Technical Analysis by ThiagoSchmitz
C.Pivot base on Ultimate Pivot Points Alerts by elbartt
D. Summary & Alert by anhnguyen14
Binary Option Alert base on my indicator: Technical Analysis - Panel Info
Put alert = Srong Sell + close>open
Call alert = Strong buy + close

Technical checklistNo one indicator is perfect. People always have their favorite indicators and maintain a bias on weighing them purely on psychological reasons other than mathematical. This technical checklist indicator collected 20 common indicators and custom ones to address the issue of a bias weighted decision.
Here, I apply machine learning using a simple sigmoid neuron network with one hidden layer and a single node to avoid artifacts. For the ease of data collection, the indicator matrix is first shown as a heatmap. Once an uptrend signal window is selected manually, an indicator matrix can be recorded in a binary format (i.e., 1 0 0 1 1 0, etc.).
For example, the following indicator matrix was retrieved from the MRNA chart (deciscion: first 5 rows, buying; last 5 rows, no buying):
1 1 0 0 0 1 1 1 1 1 0 1 0 0 1 1 0 1 1 1
1 1 0 0 1 1 1 0 0 0 1 0 1 1 0 1 0 1 1 1
0 0 1 1 0 1 0 0 0 1 1 1 0 0 1 0 0 1 0 0
1 1 0 0 0 1 1 1 1 1 1 0 1 0 0 1 0 1 0 0
0 0 1 1 0 1 1 1 0 1 1 1 0 1 1 1 0 1 0 0
1 1 0 0 1 0 1 0 0 0 0 1 0 0 0 1 0 0 1 1
1 1 0 0 0 0 1 0 0 0 0 1 0 0 1 1 0 1 1 1
0 0 0 0 1 0 1 0 0 1 1 0 0 0 0 0 0 1 0 0
0 0 0 0 0 0 1 0 0 0 1 0 0 1 0 0 0 1 1 1
0 0 0 0 1 0 1 0 0 0 1 0 1 0 0 0 0 1 1 1
This matrix is then used as an input to train the machine learning network. With a correlated buying decision matrix as an output:
1
1
1
1
1
0
0
0
0
0
After training, the corrected weight matrix can be applied back to the indicator. And the display mode can be changed from a heatmap into a histogram to reveal buying signals visually.
Usage:
python stock_ml.py mrna_input.txt output.txt
Weight matrix output:
1.37639407
1.67969656
1.0162141
1.3184323
-1.88888442
8.32928588
-5.35777295
3.08739916
3.06464844
0.82986227
-0.53092333
-1.95045383
4.14441698
2.99179435
-0.08379438
1.70379704
0.4173048
-1.51870972
-2.14284707
-2.08513252
Corresponding indicators to the weight matrix:
1. Breakout
2. Reversal
3. Crossover of ema20 and ema60
4. Crossover of ema20 and ema120
5. MACD golden cross
6. Long cycle (MACD crossover 0)
7. RSI not overbought
8. KD not overbought and crossover
9. OBV uptrend
10. Bullish gap
11. High volume
12. Breakout up fractal
13. Rebounce of down fractal
14. Convergence
15. Turbulence reversal
16. Low resistance
17. Bullish trend (blue zone)
18. Bearish trend (red zone)
19. VIX close above ema20
20. SPY close below ema20
PS. It is recommended not to use default settings but to train your weight matrix based on underlying and timeframe.
Technical Analysis - Panel Info//A. Oscillators & B. Moving Averages base on TradingView's Technical Analysis by ThiagoSchmitz
//C.Pivot base on Ultimate Pivot Points Alerts by elbartt
//D. Summary & Panel info by anhnguyen14
Panel Info base on these indicators:
A. Oscillators
1. Rsi (14)
2. Stochastic (14,3,3)
3. CCI (20)
4. ADX (14)
5. AO
6. Momentum (10)
7. MACD (12,26)
8. Stoch RSI (3,3,14,14)
9. %R (14)
10. Bull bear
11. UO (7,14,28)
B. Moving Averages
1. SMA & EMA: 5-10-20-30-50-100-200
2. Ichimoku Cloud - Baseline (26)
3. Hull MA (9)
C. Pivot
1. Traditional
2. Fibonacci
3. Woodie
4. Camarilla
D. Summary
Sum_red=A_red+B_red+C_red
Sum_blue=A_blue+B_blue+C_blue
sell_point=(Sum_red/32)*100
buy_point=(Sum_blue/32)*100
sell =
Sum_red>Sum_blue
and sell_point>50
Strong_sell =
A_red>A_blue
and B_red>B_blue
and C_red>C_blue
and sell_point>50
and not crossunder(sell_point,75)
buy =
Sum_red>Sum_blue
and buy_point>50
Strong_buy =
A_red50
and not crossunder(buy_point,75)
neutral = not sell and not Strong_sell and not buy and not Strong_buy

Simple Technicals Table📊 Simple Technicals Table
🎯 A comprehensive technical analysis dashboard displaying key pivot points and moving averages across multiple timeframes
📋 OVERVIEW
The Simple Technicals Table is a powerful indicator that organizes essential trading data into a clean, customizable table format. It combines Fibonacci-based pivot points with critical moving averages for both daily and weekly timeframes, giving traders instant access to key support/resistance levels and trend information.
Perfect for:
Technical analysts studying multi-timeframe data
Chart readers needing quick reference levels
Market researchers analyzing price patterns
Educational purposes and data visualization
🚀 KEY FEATURES
📊 Dual Timeframe Analysis
Daily (D1) and Weekly (W1) data side-by-side
Real-time updates as market conditions change
Seamless comparison between timeframes
🎯 Fibonacci Pivot Points
R3, R2, R1 : Resistance levels using Fibonacci ratios (38.2%, 61.8%, 100%)
PP : Central pivot point from previous period's data
S1, S2, S3 : Support levels with same methodology
📈 Complete EMA Suite
EMA 10 : Short-term trend identification
EMA 20 : Popular swing trading reference
EMA 50 : Medium-term trend confirmation
EMA 100 : Institutional support/resistance
EMA 200 : Long-term trend determination
📊 Essential Indicators
RSI 14 : Momentum for overbought/oversold conditions
ATR 14 : Volatility measurement for risk management
🎨 Full Customization
9 table positions : Place anywhere on your chart
5 text sizes : Tiny to huge for optimal visibility
Custom colors : Background, headers, and text
Optional pivot lines : Visual weekly levels on chart
⚙️ HOW IT WORKS
Fibonacci Pivot Calculation:
Pivot Point (PP) = (High + Low + Close) / 3
Range = High - Low
Resistance Levels:
R1 = PP + (Range × 0.382)
R2 = PP + (Range × 0.618)
R3 = PP + (Range × 1.000)
Support Levels:
S1 = PP - (Range × 0.382)
S2 = PP - (Range × 0.618)
S3 = PP - (Range × 1.000)
Smart Price Formatting:
< $1: 5 decimal places (crypto-friendly)
$1-$10: 4 decimal places
$10-$100: 3 decimal places
> $100: 2 decimal places
📊 TECHNICAL ANALYSIS APPLICATIONS
⚠️ EDUCATIONAL PURPOSE ONLY
This indicator is designed solely for technical analysis and educational purposes . It provides data visualization to help understand market structure and price relationships.
📈 Data Analysis Uses
Support & Resistance Identification : Visualize Fibonacci-based pivot levels
Trend Analysis : Study EMA relationships and price positioning
Multi-Timeframe Study : Compare daily and weekly technical data
Market Structure : Understand key technical levels and indicators
📚 Educational Benefits
Learn about Fibonacci pivot point calculations
Understand moving average relationships
Study RSI and ATR indicator values
Practice multi-timeframe technical analysis
🔍 Data Visualization Features
Organized table format for easy data reading
Color-coded levels for quick identification
Real-time technical indicator values
Historical data integrity maintained
🛠️ SETUP GUIDE
1. Installation
Search "Simple Technicals Table" in indicators
Add to chart (appears in middle-left by default)
Table displays automatically on any timeframe
2. Customization
Table Position : Choose from 9 locations
Text Size : Adjust for screen resolution
Colors : Match your chart theme
Pivot Lines : Toggle weekly level visualization
3. Optimization Tips
Use larger text on mobile devices
Dark backgrounds work well with light text
Enable pivot lines for visual reference
✅ BEST PRACTICES
Recommended Usage:
Use for technical analysis and educational study only
Combine with other analytical methods for comprehensive analysis
Study multi-timeframe data relationships
Practice understanding technical indicator values
Important Notes:
Levels based on previous period's data
Most effective in trending markets
No repainting - uses confirmed data only
Works on all instruments and timeframes
🔧 TECHNICAL SPECS
Performance:
Pine Script v5 optimized code
Minimal CPU/memory usage
Real-time data updates
No lookahead bias
Compatibility:
All chart types (Candlestick, Bar, Line)
Any instrument (Stocks, Forex, Crypto, etc.)
All timeframes supported
Mobile and desktop friendly
Data Accuracy:
Precise floating-point calculations
Historical data integrity maintained
No future data leakage
📱 DEVICE SUPPORT
✅ Desktop browsers (Chrome, Firefox, Safari, Edge)
✅ TradingView mobile app (iOS/Android)
✅ TradingView desktop application
✅ Light and dark themes
✅ All screen resolutions
📋 VERSION INFO
Version 1.0 - Initial Release
Fibonacci-based pivot calculations
Dual timeframe support (Daily/Weekly)
Complete EMA suite (10, 20, 50, 100, 200)
RSI and ATR indicators
Fully customizable interface
Optional pivot line visualization
Smart price formatting
Mobile-optimized display
⚠️ DISCLAIMER
This indicator is designed for technical analysis, educational and informational purposes ONLY . It provides data visualization and technical calculations to help users understand market structure and price relationships.
⚠️ NOT FOR TRADING DECISIONS
This tool does NOT provide trading signals or investment advice
All data is for analytical and educational purposes only
Users should not base trading decisions solely on this indicator
Always conduct thorough research and analysis before making any financial decisions
📚 Educational Use Only
Use for learning technical analysis concepts
Study market data and indicator relationships
Practice chart reading and data interpretation
Understand mathematical calculations behind technical indicators
The Simple Technicals Table provides technical data visualization to assist in market analysis education. It does not constitute financial advice, trading recommendations, or investment guidance. Users are solely responsible for their own research and decisions.
Author: ToTrieu
Version: 1.0
Category: Technical Analysis / Support & Resistance
License: Open source for educational use
💬 Questions? Comments? Feel free to reach out!
