Pivot Point Profile [LuxAlgo]The Pivot Point Profile indicator groups and displays data accumulated from previous pivot points, providing a comprehensive method for prioritizing and displaying areas of interest directly given by swing highs and lows.
Users have access to common settings present in other profile-type indicators.
🔶 USAGE
The Pivot Point Profile is particularly helpful in identifying highly active reversal zones that have been visited multiple times by price. Because of this, we could generally expect these areas to serve as future points of interest, often acting as support or resistance when re-visited.
The profile displays data associated with both Pivot Highs and Pivot Lows. Each row consists of pivot high and pivot low counts side-by-side, forming the total width of the row.
By analyzing the row as a whole, we can gain a better understanding of WHERE to look for interactions.
By analyzing the pivot counts independently, we can gain a better understanding of WHAT to expect when returning to these areas.
For example:
If a row in the profile contains entirely Pivot Lows, this could be seen as an indication to look for buyers to hold that level for a continuation upwards. A break of this level could be interpreted as a lack of interest from previous buyers at this level, indicating a further move down.
🔹 Concentrated Areas
Each row in the profile displays the current count of high pivots and low pivots within the selected lookback. The largest count for each pivot direction is identified as a "Concentrated Area (CA)", these CAs are highlighted over the chart with a line displaying the average of all pivots within that CA. The CA Average is the average of all pivot points (in the majority direction) within the given row.
These can hold more importance as potential support/resistance areas.
Note: The CA Threshold can be manually adjusted to highlight all rows based on a user-selected value.
🔶 DETAILS
🔹 Calculation
The idea behind the Pivot Point Profile is a new analysis method for pivot points, taking the idea of a volume profile and adapting it to display pivot points instead of volume. By using this data, in theory, we should be able to better prioritize zones to anticipate reversals, as well as identify key levels to watch for buyer & seller interactions to use as confirmations in direction.
The (vertical) width of each row is the product of the script's "Row Size", this is the number of rows that the profile will consist of. With a max of 250, the profile can be decently granular. That being said, A more granular profile will have fewer overlapping pivot points. By decreasing the row size (Using fewer rows in the profile) you will increase the tolerance for grouping pivot points. Potentially leading to a more comprehensive Profile. Inversely, By reducing the tolerance for grouping, you will better visualize only similar highs and lows but may have noisier data to sift through.
The Profile is calculated based on a "Lookback" parameter, using only the lookback amount of previous high and low pivots to calculate the profile. Configuring this parameter alongside "Pivot Length", will allow for great control over the frame of reference of the profile.
Note: This indicator is capable of utilizing the full chart history of pivot points, this can be done by enabling the "Use Full Chart History" setting, this will cause the script will calculate from everything it has access to on your current chart.
🔹 Display
The Pivot Point Profile display can be customized to fit a various range of chart styles and visual needs. The specific settings to adjust these can be located in the "Profile Display" Section of the User Inputs.
Profile Width: Sets the Left to Right Width of the Profile. This is the maximum width that the profile will occupy and will scale to fit within this width.
Profile Offset: Sets the distance of the Profile's Axis from the current chart candle. This moves the entire profile left and right to enable to user to set the distance between the profile and the current candle.
Direction: Changes the display direction of the profile, allowing for "Left", "Right", or "Center" display styles.
🔶 SETTINGS
🔹 Pivot Point Parameters
Pivot Type: Choose between "Fractal Pivots" or "SMC Structure" to use as the basis for pivots.
Length: Sets the length for the pivot calculations.
🔹 Profile Calculations Parameters
Lookback: Sets the number of pivots to calculate within, in increments of high and low pairs. (Setting this to 1 = 1 Pivot High & 1 Pivot Low)
Use Full Chart History: Disregards the set lookback and instead uses all available chart data to calculate from.
Row Size: Sets the total number of rows to calculate the profile with.
🔹 Profile Display
Profile Width: Sets the max left & right width (in bars) that the profile will occupy.
Profile Offset: Sets the distance of the profile axis from the last chart bar.
Direction: Sets the display direction
🔹 Concentrated Areas
Highlight CAs: Extends the rows left from concentrated areas.
CA Threshold: Manually set the threshold for determining concentrated areas, when disabled, only the largest rows will be displayed.
CA Averages: Toggles the concentrated area averages for each pivot direction.
Note: CA Averages can be displayed independently without CA Highlights being displayed, and vice versa.
Buscar en scripts para "swing high"

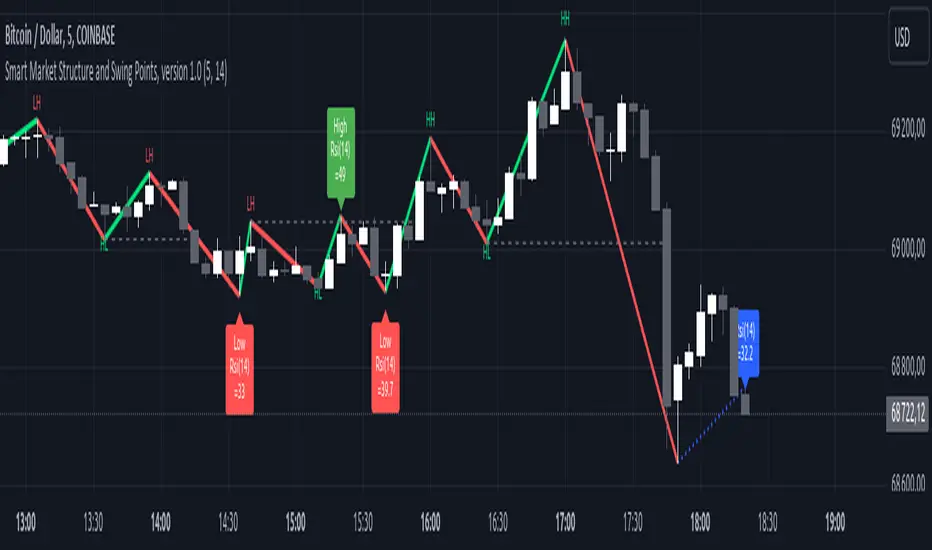
Smart Market Structure and Swing Points, version 1.0Smart Market Structure and Swing Points, Version 1.0
Overview
The Smart Market Structure and Swing Points script is designed to provide advanced insights into market structure and key swing points. This script helps identify important highs and lows, trend direction changes (structure breaks), and swing points, enhancing decision-making for both trend-following and reversal strategies. See below for detail presentation and why it has unique features.
Unique Features of the New Script
Market Structure Identification : Analyzes and marks key highs and lows to determine market structure, including higher highs, lower highs, higher lows, and lower lows.
Customizable Detection Length : Allows users to set the length for detecting highs and lows, providing flexibility to adapt to different market conditions and timeframes. Default value is 5 bars, but can be changed if needed.
Visual Signal Indicators (Labels) : Plots labels on the chart to indicate higher highs (HH), lower highs (LH), higher lows (HL), and lower lows (LL), along with corresponding RSI values, offering clear visual cues for market structure analysis. The indication of RSI values directly on high and low points enables to better judge whether the points are strong references (extreme RSI values) or weak references (middle RSI values)
Dynamic Trend Lines : Draws solid and dotted lines to connect significant highs and lows, visually representing the current trend direction and potential trend changes. Dashed lines indicates structure breaks.
Swing High and Swing Low Detection : Identifies and marks the most recent swing highs and swing lows, helping traders spot potential reversal points and key levels for setting stop losses or take profit targets .
Originality and Usefulness
This script combines market structure, trend breaks and RSI to provide a more robust view of market dynamic by indicating the strength or weakness of swing points , in that way the script is unique.
Signal Description
The script includes various signal features that highlight potential trading opportunities based on market structure:
Higher Highs (HH) and Higher Lows (HL) : These labels are plotted when new highs or lows are formed, indicating a continuation of an uptrend. The labels are positioned with consideration of the Average True Range (ATR) for better visibility.
Lower Highs (LH) and Lower Lows (LL) : These labels are plotted when new highs or lows are formed, indicating a continuation of a downtrend. The labels include RSI values to provide additional information on the strength or weakness of the points.
Trend Direction Change : Dotted lines are drawn to indicate potential trend direction changes when the script detects significant shifts in market structure.
Swing Highs and Swing Lows : These are identified based on a customizable swing length, marking recent significant highs and lows to highlight potential reversal points.
These signals help identify high-probability turning points and confirm trend direction by ensuring that the market structure aligns with the trading strategy.
Detailed Description
Input Variables
Length for High/Low Detection (`length`) : Defines the range to check for highs and lows. Default is 5.
RSI Length (`rsilength`) : The number of periods to calculate the RSI. Default is 14.
Functionality
Market Structure Calculation : The script determines the highest high and lowest low within the specified range to identify key points in market structure.
```pine
h = ta.highest(high, length * 2 + 1)
l = ta.lowest(low, length * 2 + 1)
```
Directional Logic : Variables and functions manage the state of the indicator, updating highs and lows based on the current trend direction.
```pine
var bool dirUp = false
var float lastLow = high * 100
var float lastHigh = 0.0
// Additional variables for tracking state
```
Drawing Lines and Labels : Functions draw lines and labels on the chart to visualize market structure and trend changes.
```pine
f_drawLine() =>
_li_color = dirUp ? color.red : color.lime
line.new(x1=timeHigh - length, y1=lastHigh, x2=timeLow - length, y2=lastLow, color=_li_color, width=3, style=line.style_solid, xloc=xloc.bar_index)
f_drawLastLine() =>
_li_color = dirUp ? color.blue : color.blue
if timeHigh > timeLow
line.new(x1=timeHigh - length, y1=lastHigh, x2=bar_index, y2=low, color=_li_color, width=2, style=line.style_dotted, xloc=xloc.bar_index)
else
line.new(x1=timeLow - length, y1=lastLow, x2=bar_index, y2=high, color=_li_color, width=2, style=line.style_dotted, xloc=xloc.bar_index)
```
Updating Highs and Lows : The main logic updates highs and lows based on the current trend direction, adding labels for new higher highs, lower highs, higher lows, and lower lows.
```pine
if dirUp
if f_isMin(length)
lastLow := low
// Additional logic for updating lows and labels
if f_isMax(length) and high > lastLow
lastHigh := high
// Additional logic for updating highs and labels
dirUp := false
li := f_drawLine()
```
Swing Highs and Lows : The script identifies recent swing highs and swing lows based on a customizable swing length, drawing lines to mark these points.
```pine
swingLength = 3 * length
isSwingHigh = ta.highestbars(high, swingLength) == 0
isSwingLow = ta.lowestbars(low, swingLength) == 0
if (isSwingHigh)
if (na(highLine))
highLine := line.new(bar_index, high, bar_index, high, color=color.green, style=line.style_solid, width=1)
else
line.set_xy1(highLine, bar_index, high)
line.set_xy2(highLine, bar_index + swingLength, high)
if (isSwingLow)
if (na(lowLine))
lowLine := line.new(bar_index, low, bar_index, low, color=color.red, style=line.style_solid, width=1)
else
line.set_xy1(lowLine, bar_index, low)
line.set_xy2(lowLine, bar_index + swingLength, low)
```
How to Use
Configuring Inputs : Adjust the detection length and RSI length as needed. Modify the lookback periods to suit your trading strategy. The indicator is adaptable and can be used on any timeframe.
Interpreting the Indicator : Use the labels and lines to gauge market structure and trend direction. Look for higher highs, lower highs, higher lows, and lower lows to confirm market structure.
Signal Confirmation : Pay attention to the labels and lines that provide signals for potential trend changes and swing points. Use these signals to better time entries and exits.
This script provides a detailed view of market structure and swing points, helping make more informed decisions by considering key highs and lows, trend direction changes, and the strength or weakness of swing points.
Breakout Detector (Previous MTF High Low Levels) [LuxAlgo]The Breakout Detector (Previous MTF High Low Levels) indicator highlights breakouts of previous high/low levels from a higher timeframe.
The indicator is able to: display take-profit/stop-loss levels based on a user selected Win/Loss ratio, detect false breakouts, and display a dashboard with various useful statistics.
Do note that previous high/low levels are subject to backpainting, that is they are drawn retrospectively in their corresponding location. Other elements in the script are not subject to backpainting.
🔶 USAGE
Breakouts occur when the price closes above a previous Higher Timeframe (HTF) High or below a previous HTF Low.
On the advent of a breakout, the closing price acts as an entry level at which a Take Profit (TP) and Stop Loss (SL) are placed. When a TP or SL level is reached, the SL/TP box border is highlighted.
When there is a breakout in the opposite direction of an active breakout, previous breakout levels stop being updated. Not reaching an SL/TP level will result in a partial loss/win,
which will result in the box being highlighted with a dotted border (default). This can also be set as a dashed or solid border.
Detection of False Breakouts (default on) can be helpful to avoid false positives, these can also be indicative of potential trend reversals.
This indicator contains visualization when a new HTF interval begins (thick vertical grey line) and a dashboard for reviewing the breakout results (both defaults enabled; and can be disabled).
As seen in the example above, the active, open breakout is colored green/red.
You can enable the setting ' Cancel TP/SL at the end of HTF ', which will stop updating previous TP/SL levels on the occurrence of a new HTF interval.
🔶 DETAILS
🔹 Principles
Every time a new timeframe period starts, the previous high and low are detected of the higher timeframe. On that bar only there won't be a breakout detection.
A breakout is confirmed when the close price breaks the previous HTF high/low
A breakout in the same direction as the active breakout is ignored.
A breakout in the opposite direction stops previous breakout levels from being updated.
Take Profit/Stop Loss, partially or not, will be highlighted in an easily interpretable manner.
🔹 Set Higher Timeframe
There are 2 options for choosing a higher timeframe:
• Choose a specific higher timeframe (in this example, Weekly higher TF on a 4h chart)
• Choose a multiple of the current timeframe (in this example, 75 minutes TF on a 15 min chart - 15 x 5)
Do mind, that when using this option, non-standard TFs can give less desired timeframe changes.
🔹 Setting Win/Loss Levels
The Stop Loss (SL) / Take Profit (TP) setting has 2 options:
W%:L% : A fixed percentage is chosen, for TP and SL.
W:L : In this case L (Loss-part) is set through Loss Settings , W (Win-part) is calculated by multiplying L , for example W : L = 2 : 1, W will be twice as large as the L .
🔹 Loss Settings
The last drawing at the right is still active (colored green/red)
The Loss part can be:
A multiple of the Average True Range (ATR) of the last 200 bars.
A multiple of the Range Cumulative Mean (RCM).
The Latest Swing (with Length setting)
Range Cumulative Mean is the sum of the Candle Range (high - low) divided by its bar index.
🔹 False Breakouts
A False Breakout is confirmed when the price of the bar immediately after the breakout bar returns above/below the breakout level.
🔹 Dashboard
🔶 ALERTS
This publication provides several alerts
Bullish/Bearish Breakout: A new Breakout.
Bullish/Bearish False Breakout: False Breakout detected, 1 bar after the Breakout.
Bullish/Bearish TP: When the TP/profit level has been reached.
Bullish/Bearish Fail: When the SL/stop-loss level has been reached.
Note that when a new Breakout causes the previous Breakout to stop being updated, only an alert is provided of the new Breakout.
🔶 SETTINGS
🔹 Set Higher Timeframe
Option : HTF/Mult
HTF : When HTF is chosen as Option , set the Higher Timeframe (higher than current TF)
Mult : When Mult is chosen as Option , set the multiple of current TF (for example 3, curr. TF 15min -> 45min)
🔹 Set Win/Loss Level
SL/TP : W:L or W%:L%: Set the Win/Loss Ratio (Take Profit/Stop Loss)
• W : L : Set the Ratio of Win (TP) against Loss (SL) . The L level is set at Loss Settings
• W% : L% : Set a fixed percentage of breakout price as SL/TP
🔹 Loss Settings
When W : L is chosen as SL/TP Option, this sets the Loss part (L)
Base :
• RCM : Range Cumulative Mean
• ATR : Average True Range of last 200 bars
• Last Swing : Last Swing Low when bullish breakout, last Swing High when bearish breakout
Multiple : x times RCM/ATR
Swing Length : Sets the 'left' period ('right' period is always 1)
Colours : colour of TP/SL box and border
Borders : Style border when breakout levels stop being updated, but TP/SL is not reached. (Default dotted dot , other option is dashed dsh or solid sol )
🔹 Extra
Show Timeframe Change : Show a grey vertical line when a new Higher Timeframe interval begins
Detect False Outbreak
Cancel TP/SL at end of HTF
🔹 Show Dashboard
Location: Location of the dashboard (Top Right or Bottom Right/Left)
Size: Text size (Tiny, Small, Normal)
See USAGE/DETAILS for more information

Scalp Precision Matrix [BullByte]SCALP PRECISION MATRIX (SPM)
OVERVIEW
Scalp Precision Matrix (SPM) is a comprehensive decision-support framework designed specifically for scalpers and short-term traders. This indicator synthesizes five distinct analytical layers into a unified system that helps identify high-quality setups while avoiding common pitfalls that trap traders.
━━━━━━━━━━━━━━━━━━━━━━━━━━━━━━━━━━━━━━━━━━━
THE CORE PROBLEM THIS INDICATOR ADDRESSES
Scalping demands rapid decision-making while simultaneously processing multiple data points. Traders constantly ask themselves: Is momentum still alive? Am I entering near a potential reversal zone? Is this the right session to trade? What is my actual risk-to-reward? Most traders either overwhelm themselves with too many separate indicators (creating analysis paralysis) or use too few (missing crucial context).
SPM was developed to consolidate these essential checks into one cohesive framework. Rather than overlaying disconnected indicators, each component in SPM directly informs and adjusts the others, creating an integrated analytical system.
━━━━━━━━━━━━━━━━━━━━━━━━━━━━━━━━━━━━━━━━━━━
WHY THESE SPECIFIC COMPONENTS AND HOW THEY WORK TOGETHER
The five analytical layers in SPM are not arbitrarily combined. Each addresses a specific question in the scalping decision process, and together they form a logical workflow:
LAYER 1: MOMENTUM FUEL GAUGE
This answers the question: "Does the current move still have energy?"
After any impulse move (a significant directional price movement), momentum naturally decays over time. The Fuel Gauge estimates remaining momentum by analyzing four factors:
Body Strength (30% weight): Compares recent candle body sizes against the historical average. Strong momentum produces candles with large bodies relative to their wicks. The calculation takes the 3-bar average body size divided by the 20-bar average body size, then scales it to a 0-100 range.
Wick Rejection (25% weight): Measures the wick-to-body ratio. When wicks are large relative to bodies, it suggests rejection and weakening momentum. A ratio of 2.0 or higher (wicks twice the body size) scores low; smaller ratios score higher.
Volume Consistency (20% weight): Compares recent 3-bar average volume against the lookback period average. Sustained moves require consistent volume support. Volume dropping off suggests the move may be losing participation.
Time Decay (25% weight): Tracks how many bars have passed since the last detected impulse. Momentum naturally fades over time. The typical impulse duration is adjusted based on the current volatility regime.
These components are weighted and combined, then smoothed with a 3-period EMA to reduce noise. The result is a 0-100% gauge where:
- Above 70% = Strong momentum (green)
- 40-70% = Moderate momentum (amber)
- Below 40% = Weak momentum (red)
- Below 20% = Exhausted (triggers EXIT warning)
The Fuel Gauge also estimates how many bars of momentum remain based on the current burn rate.
IMPORTANT DISCLAIMER : The Fuel Gauge is NOT order flow, volume profile, or depth of market data. It is a technical proxy calculated entirely from standard OHLCV (Open, High, Low, Close, Volume) data. The term "Fuel" is used metaphorically to represent estimated remaining momentum energy.
LAYER 2: TRAP ZONE DETECTION
This answers the question: "Am I walking into a potential reversal area?"
Price tends to reverse at levels where it has reversed before. SPM identifies these zones by detecting clusters of historical swing points:
How it works:
1. The indicator detects swing highs and swing lows using the Swing Detection Length setting (default 5 bars on each side required to confirm a pivot).
2. Recent swing points are stored (up to 10 of each type).
3. For each potential zone, the algorithm counts how many swing points cluster within a tolerance of 0.5 ATR.
4. Zones with 2 or more clustered swing points, positioned between 0.3 and 4.0 ATR from current price, are marked as Trap Zones.
5. A Confluence Score is calculated based on cluster density and proximity to current price.
The percentage displayed (e.g., "TRAP 85%") is a CONFLUENCE SCORE, not a probability. Higher percentages mean more swing points cluster at that level and price is closer to it. This indicates stronger historical significance, not a prediction of future reversal.
CRITICAL DISCLAIMER : Trap Zones are NOT institutional order flow, liquidity pools, smart money footprints, or any proprietary data feed. They are calculated purely from historical swing point clustering using standard technical analysis. The term "trap" describes how price action has historically reversed at these levels, potentially trapping traders who enter prematurely. This is pattern recognition, not market structure data.
LAYER 3: VELOCITY ANALYSIS
This answers the question: "Is price moving favorably right now?"
Velocity measures how fast price is currently moving compared to its recent average:
Calculation:
- Current velocity = Absolute price change from previous bar divided by ATR
- Average velocity = Simple moving average of velocity over the lookback period
- Velocity ratio = Current velocity divided by average velocity
Classification:
- FAST (ratio above 1.5 ): Price is moving significantly faster than normal. Good for momentum continuation plays.
- NORMAL (ratio 0.5 to 1.5) : Typical price movement speed.
- SLOW (ratio below 0.5 ): Price is moving sluggishly. Often indicates ranging or choppy conditions where scalping becomes difficult.
The velocity score contributes 18% to the overall quality score calculation.
LAYER 4: SESSION AWARENESS
This answers the question: "Is this a good time to trade?"
Different trading sessions have different characteristics. SPM automatically detects which major session is active and adjusts its quality assessment:
Session Times (all in UTC):
- A sia Session : 00:00 - 08:00 UTC
- London Session : 08:00 - 16:00 UTC
- New York Session : 13:00 - 21:00 UTC
- London/NY Overlap : 13:00 - 16:00 UTC
- Off-Peak : Outside major sessions
Session Quality Weighting:
- Overlap : 100 points (highest liquidity, best movement)
- London : 85 points
- New York : 80 points
- Asia : 50 points (tends to range more)
- Off-Peak : 30 points (lower liquidity, more false signals)
The session score contributes 17% to the overall quality calculation. Signals are also filtered to prevent firing during off-peak hours.
Note : These are fixed UTC times and may not perfectly match your broker's session boundaries. Use them as general guidance rather than precise timing.
LAYER 5: VOLATILITY REGIME ADAPTATION
This answers the question: "How should I adjust for current market conditions?"
SPM compares current volatility (14-period ATR) against historical volatility (50-period ATR) to categorize the market:
HIGH Volatility (ratio above 1.3): Current ATR is 30%+ above normal. SPM widens thresholds to filter noise and extends target projections.
NORMAL Volatility (ratio 0.7 to 1.3): Typical conditions. Standard parameters apply.
LOW Volatility (ratio below 0.7): Current ATR is 30%+ below normal. SPM tightens thresholds for sensitivity and reduces target expectations. The market state may show AVOID during prolonged low volatility.
This adaptation prevents false signals during erratic markets and missed signals during quiet markets.
━━━━━━━━━━━━━━━━━━━━━━━━━━━━━━━━━━━━━━━━━━━
THE SYNERGY: WHY THIS COMBINATION MATTERS
These five layers are not independent indicators placed on one chart. They form an interconnected system:
- A signal only fires when momentum exists (Fuel above 40%), price is away from danger zones (Trap Zones factored into quality score), movement is favorable (Velocity contributes to score), timing is appropriate (Session is not off-peak), and volatility is accounted for (thresholds adapt to regime).
- The Trap Zones directly influence Entry Zone placement. Entry zones are positioned beyond trap zones to avoid getting caught in reversals.
- Target projections automatically adjust to avoid placing take-profit levels inside detected trap zones.
- The Fuel Gauge affects which signal tier fires. Insufficient fuel prevents all signals.
- Session quality is weighted into the overall score, reducing signal quality during less favorable trading hours.
This integration is the core originality of SPM. Each component makes the others more useful than they would be in isolation.
━━━━━━━━━━━━━━━━━━━━━━━━━━━━━━━━━━━━━━━━━━━
HOW THE QUALITY SCORE IS CALCULATED
The Quality Score (0-100) synthesizes all layers into a single number for each direction (long and short):
For Long Quality Score:
- Fuel Component (28% weight) : Full fuel value if impulse direction is bullish; 60% of fuel value otherwise
- Trap Avoidance (22% weight) : 75 points if no trap zone below; otherwise 100 minus the trap confluence score (minimum 20)
- Velocity Component (18% weight) : Direct velocity score
- Session Component (17% weight) : Current session quality score
- Trend Alignment (15% bonus) : Adds 12 points if price is above the 20-period SMA
For Short Quality Score:
- Same structure but reversed (bearish impulse direction, trap zone above, price below SMA)
The direction with the higher score becomes the current Bias. A 12-point difference is required to switch bias, preventing flip-flopping in neutral conditions.
━━━━━━━━━━━━━━━━━━━━━━━━━━━━━━━━━━━━━━━━━━━
SIGNAL TYPES AND WHAT THEY MEAN
SPM generates four types of signals, each with specific visual representation:
PRIME SIGNALS (Cyan Diamond)
These represent the highest quality confluence. Requirements:
- Quality score crosses above the Prime threshold (default 80)
- Bias aligns with signal direction
- Fuel is sufficient (above 40%)
- Session is active (not off-peak)
- Cooldown period has passed
Prime signals appear as cyan-colored diamond shapes. Long signals appear below the bar; short signals appear above.
STANDARD SIGNALS (Green Triangle Up / Red Triangle Down)
These represent good quality setups. Requirements:
- Quality score crosses above the Standard threshold (default 75) but below Prime
- Same bias, fuel, and cooldown requirements as Prime
Standard signals appear as small triangles in green (long) or red (short).
CAUTION SIGNALS (Small Faded Circle)
These represent minimum threshold setups. Requirements:
- Quality score crosses above the Caution threshold (default 65) but below Standard
- Same additional requirements
Caution signals appear as small, faded circles. These suggest the setup exists but with weaker confluence. Consider these only when broader market context supports them, or skip them entirely during uncertain conditions.
EXHAUSTION SIGNAL (Purple X with "EXIT" text)
This warning appears when the Fuel Gauge drops below 20% from above, indicating momentum has depleted. This is not a trade signal but a warning to:
- Consider exiting existing positions
- Avoid entering new trades in the current direction
- Wait for new momentum to develop
All signals use CONFIRMED bar data only (referencing the previous closed bar) to prevent repainting. Once a signal appears, it will never disappear or change position on historical bars.
━━━━━━━━━━━━━━━━━━━━━━━━━━━━━━━━━━━━━━━━━━━
READING THE CHART ELEMENTS
TRAP ZONES (Red Dashed Box with "TRAP XX%" Label)
These mark price levels where multiple historical swing points cluster. The red dashed box shows the zone boundaries. The percentage is the confluence score indicating cluster strength and proximity.
How to use: When price approaches a trap zone, be cautious about entering in that direction. If your bias is LONG and there's a strong trap zone above, consider taking partial profits before price reaches it or adjusting your target below it.
ENTRY ZONES (Green Solid Box with "ENTRY" Label)
These show suggested entry areas based on the current bias direction. For LONG bias, the entry zone appears below the trap zone (buying the dip beyond support). For SHORT bias, it appears above the trap zone (selling the rally beyond resistance).
How to use: Rather than entering at current price, consider placing limit orders within the entry zone. This positions you beyond where typical trap reversals occur.
TARGET ZONES (Blue Dotted Box with "TARGET" Label)
These project potential take-profit areas based on ATR multiples, adjusted for:
- Current volatility regime (wider in high volatility, tighter in low)
- Impulse direction (larger targets when aligned with impulse)
- Nearby trap zones (targets adjust to avoid placing TP inside trap zones)
How to use: These are suggestions, not guarantees. Consider taking partial profits before the target or using trailing stops once price moves favorably.
STOP LEVEL (Orange Dashed Line with "STOP" Label)
This shows suggested stop-loss placement, calculated as 0.8 ATR beyond the trap zone (or 2.0 ATR from current price if no trap zone exists).
How to use: This provides a reference for risk calculation. The dashboard R:R ratio is calculated using this stop level.
Chart Example: Scalp Precision Matrix displays real-time market analysis through dynamic zones and quality scores. ENTRY/TARGET/STOP zones show potential price levels based on current market structure - they appear continuously as reference points, NOT as trade instructions. Actual trade signals (diamonds, triangles, circles) fire only when multiple conditions align: quality score thresholds are crossed, fuel gauge is sufficient, session is active, and cooldown period has passed. The zones help you understand market context; the signals tell you when to act.
━━━━━━━━━━━━━━━━━━━━━━━━━━━━━━━━━━━━━━━━━━━
UNDERSTANDING THE DASHBOARD (Top Right Panel)
The main dashboard provides comprehensive market context:
Row 1 - Header:
- "SPM " : Indicator name
- Market State : Current overall condition
Market States Explained:
- PRIME : Excellent conditions. Quality score meets prime threshold, session is active. Best opportunities.
- READY : Good conditions. Quality score meets standard threshold. Solid setups available.
- WAIT : Mixed conditions. Some factors favorable, others not. Patience recommended.
- AVOID : Poor conditions. Off-peak session or very low volatility. High risk of false signals.
- EXIT : Fuel exhausted. Momentum depleted. Consider closing positions or waiting.
Row 2-3 - Quality Bars:
- " UP ########## " : Visual meter for long quality (each # = 10 points, . = empty)
- " DN ########## " : Visual meter for short quality
- The number on the right shows the exact quality score
Row 4 - Bias:
- Shows current directional lean: LONG, SHORT, or NEUTRAL
- Color-coded: Green for long, red for short, gray for neutral
Rows 5-7 (Full Mode Only) - Trade Levels:
- Entry : Suggested entry price for current bias direction
- Stop : Suggested stop-loss price
- Target : Projected take-profit price
Row 8 - Risk:Reward Ratio:
- Format : "1:X.X" where X.X is the reward multiple
- Color-coded : Green if 2:1 or better, amber if 1.5:1 to 2:1, red if below 1.5:1
Row 9 - Fuel:
- Shows percentage and estimated bars remaining in parentheses
- Example : "72% (8)" means 72% fuel with approximately 8 bars remaining
- Color-coded : Green above 70%, amber 40-70%, red below 40%
Row 10-11 (Full Mode Only) - Market Conditions:
- Vol : Current volatility regime (HIGH/NORMAL/LOW)
- Speed : Current velocity zone (FAST/NORMAL/SLOW)
Row 12 - Session:
- Shows active trading session
- Color-coded by session type
Row 13 (Full Mode Only) - Remaining:
- Time remaining in current session (hours and minutes)
Row 14 (Conditional) - Trap Warning:
- Appears when a significant trap zone exists in your bias direction
- Shows direction (ABOVE/BELOW) and confluence percentage
━━━━━━━━━━━━━━━━━━━━━━━━━━━━━━━━━━━━━━━━━━━
UNDERSTANDING THE QUICK PANEL (Bottom Left)
The Quick Panel provides essential information at a glance without looking away from price action:
Row 1: Current Bias and Quality Score (large text for quick reading)
Row 2: Market State
Row 3: Fuel Percentage
Row 4: Estimated Bars Remaining
Row 5: Risk:Reward Ratio
Row 6: Current Session
Both panels can be repositioned using the settings, and each can be toggled on/off independently.
━━━━━━━━━━━━━━━━━━━━━━━━━━━━━━━━━━━━━━━━━━━
SETTINGS EXPLAINED
CORE SETTINGS:
Analysis Lookback (Default: 20)
Number of bars used for statistical calculations including average volume and average body size. Higher values create smoother but slower-reacting analysis. Lower values are more responsive but may include more noise.
Swing Detection Length (Default: 5)
Bars required on each side to confirm a swing high or low. A setting of 5 means a swing high must have 5 lower highs on each side. Lower values detect more swings (more trap zones, more sensitivity). Higher values find only major pivots (fewer but more significant zones).
Impulse Sensitivity (Default: 1.5)
Multiplier for ATR when detecting impulse moves. Lower values (like 1.0) detect smaller price movements as impulses, refreshing the fuel gauge more frequently. Higher values (like 2.5) require larger moves, making impulse detection less frequent but more significant.
SIGNAL SETTINGS:
Prime/Standard/Caution Thresholds (Defaults: 80/75/65)
These control the quality score required for each signal tier. You can adjust these based on your preference:
- More conservative : Raise thresholds (e.g., 85/80/70) for fewer but higher-quality signals
- More aggressive : Lower thresholds (e.g., 75/70/60) for more signals with slightly lower quality
Signal Cooldown (Default: 8 bars)
Minimum bars between signals to prevent signal spam. After any signal fires, no new signals can appear until this many bars pass. Increase for fewer signals in choppy markets; decrease if you want faster signal refresh.
Show Prime/Standard/Caution/Exhaustion Signals
Toggle each signal type on or off based on your preference.
ZONE DISPLAY:
Show Trap Zones / Entry Zones / Target Zones / Stop Levels
Toggle each zone type on or off. Turning off zones you don't use reduces chart clutter.
Zone Transparency (Default: 88)
Controls how transparent zone boxes appear. Higher values (closer to 95) make zones barely visible; lower values (closer to 75) make them more prominent.
Zone History (Default: 25 bars)
How far back zone boxes extend on the chart. Purely visual preference.
BACKGROUND:
Background Mode (Options: Off, Subtle, Normal)
Controls whether and how intensely the chart background is colored. Subtle is barely noticeable; Normal is more visible; Off disables background coloring entirely.
Background Type (Options: Bias, Fuel)
- Bias : Colors background based on current directional lean (green for long, red for short)
- Fuel : Colors background based on momentum level (green for high fuel, amber for moderate, red for low)
DASHBOARD / QUICK PANEL:
Show Dashboard / Show Quick Panel
Toggle each panel on or off.
Compact Mode
When enabled, the main dashboard shows only essential rows (quality bars, bias, R:R, fuel, session) without entry/stop/target levels, volatility, velocity, or time remaining.
Position Settings
Choose where each panel appears on your chart from six options: Top Right, Top Left, Bottom Right, Bottom Left, Middle Right, Middle Left.
ALERTS:
Alert Prime Signals / Standard Signals / Fuel Exhaustion
Enable or disable TradingView alerts for each condition. When enabled, you can set up alerts in TradingView that will notify you when these conditions occur.
━━━━━━━━━━━━━━━━━━━━━━━━━━━━━━━━━━━━━━━━━━━
RECOMMENDED TIMEFRAMES AND USAGE
OPTIMAL TIMEFRAMES:
- 1-minute to 5-minute : Best for active scalping with quick entries and exits
- 5-minute to 15-minute : Balanced scalping with slightly more confirmation
- 15-minute to 1-hour : Short-term swing entries, fewer but more significant signals
Zone visualizations only appear on intraday timeframes to prevent chart clutter on higher timeframes.
BEST PRACTICES:
1. Trade primarily during LONDON, NEW YORK, or OVERLAP sessions. The indicator weights these sessions higher for good reason - liquidity and movement are typically better.
2. Prioritize PRIME signals. These represent the highest confluence and have proven most reliable. Use STANDARD signals as secondary opportunities. Treat CAUTION signals with extra scrutiny.
3. Respect the Fuel Gauge. Avoid entering new positions when fuel is below 40%. When the EXIT signal appears, seriously consider closing or reducing positions.
4. Pay attention to TRAP warnings. When the dashboard shows a trap zone in your bias direction, be cautious about holding through that level.
5. Verify R:R before entry. The dashboard shows the risk-to-reward ratio. Ensure it meets your minimum requirements (many traders require at least 1.5:1 or 2:1).
6. When state shows AVOID or EXIT, step back. These conditions typically produce poor results.
7. Combine with your own analysis. SPM is a decision-support tool, not a standalone system. Use it alongside your understanding of market structure, news events, and overall context.
━━━━━━━━━━━━━━━━━━━━━━━━━━━━━━━━━━━━━━━━━━━
PRACTICAL EXAMPLE
Scenario : You're watching a 5-minute chart during London session. A cyan diamond (Prime Long signal) appears below the bar.
Before entering, you check the dashboard:
- State shows "PRIME" - conditions are favorable
- Fuel shows "72% (8)" - plenty of momentum remaining (approximately 8 bars)
- R:R shows "1:2.3" - acceptable risk-to-reward ratio
- Session shows "LONDON" - active session with good liquidity
- No TRAP warning in dashboard - no immediate resistance cluster in your way
- Entry zone visible on chart at a lower price level
- Stop and Target zones clearly marked
With this confluence of factors, you have context for a more informed decision. The signal indicates quality, the fuel suggests momentum remains, the R:R is favorable, and no immediate trap threatens your trade.
However, you also notice the target zone sits just below where a trap zone would be if there were one. This is by design - SPM adjusts targets to avoid placing them inside reversal zones.
This multi-factor confirmation delivered in a single glance is what SPM provides.
Chart Example :This chart demonstrates how the Scalp Precision Matrix identifies key market transitions. After a strong bullish impulse (cyan PRIME signal at ~08:30), price reached a historical reversal cluster (TRAP ZONE at 92,300). The indicator detected momentum exhaustion (purple EXIT signal) as fuel dropped below 20%, warning traders to exit longs. Now showing a SHORT bias with entry/stop/target zones clearly marked. The 92% trap zone confluence indicates a strong cluster of previous swing highs where price historically reversed.
━━━━━━━━━━━━━━━━━━━━━━━━━━━━━━━━━━━━━━━━━━━
DATA WINDOW VALUES
For detailed analysis and strategy development, SPM exports the following values to TradingView's Data Window (visible when you hover over the chart with the indicator selected):
- Long Quality Score (0-100)
- Short Quality Score (0-100)
- Fuel Gauge (0-100%)
- Risk:Reward Ratio
These values can be useful for understanding how the indicator behaves over time and for developing your own insights about when it works best for your trading style.
━━━━━━━━━━━━━━━━━━━━━━━━━━━━━━━━━━━━━━━━━━━
NON-REPAINTING CONFIRMATION
All signals in SPM are generated using CONFIRMED bar data only. The signal logic references the previous closed bar's values ( and in Pine Script terms). This means:
- Signals appear at the OPEN of the new bar (after the previous bar closes)
- Signals will NEVER disappear once they appear
- Signals will NEVER change position on historical bars
- What you see in backtesting is what you would have seen in real-time
The dashboard and zones update in real-time to provide current market context, but the trading signals themselves are non-repainting.
━━━━━━━━━━━━━━━━━━━━━━━━━━━━━━━━━━━━━━━━━━━
IMPORTANT DISCLAIMERS
TERMINOLOGY CLARIFICATION:
This indicator uses terms that might imply access to data it does not have. To be completely transparent:
- "Trap Zones" are calculated from historical swing point clustering. They are NOT institutional liquidity pools, order blocks, smart money footprints, or any form of order flow data. The term "trap" is metaphorical, describing how price has historically reversed at these levels.
- "Fuel Gauge" is a technical momentum proxy. It is NOT order flow, volume profile, depth of market, or bid/ask data. It estimates momentum remaining based entirely on standard OHLCV price and volume data.
- "Quality Scores" are weighted combinations of the technical factors described above. A high score indicates multiple conditions align favorably according to the indicator's logic. It does NOT predict or guarantee trade success.
- The percentages shown on trap zones are CONFLUENCE SCORES measuring cluster density and proximity. They are NOT probability predictions of reversal.
TRADING RISK WARNING:
Trading involves substantial risk of loss and is not suitable for all investors. This indicator is a technical analysis tool designed to assist with decision-making. It does not constitute financial advice, trading advice, or any other sort of advice. Past performance of any signal or pattern does not guarantee future results. Markets are inherently unpredictable.
Always use proper risk management. Define your risk before entering any trade. Never risk more than you can afford to lose. Consider consulting with a licensed financial advisor before making trading decisions.
━━━━━━━━━━━━━━━━━━━━━━━━━━━━━━━━━━━━━━━━━━━
ORIGINALITY STATEMENT - NOT A MASHUP
Scalp Precision Matrix is an original work that combines several analytical concepts into a purpose-built scalping framework. While individual components like ATR calculations, pivot detection, session timing, and trend alignment exist in various forms elsewhere, the specific implementation here represents original synthesis:
- The Fuel Gauge decay model with its four-component weighted calculation
- The Trap Zone cluster detection with confluence scoring
- The multi-factor quality scoring system that integrates all layers
- The trap-aware entry and target zone placement logic
- The volatility regime adaptation across all components
- The session weighting is integrated into the quality assessment
The indicator does not simply overlay separate indicators on one chart. It creates interconnected layers where each component informs and adjusts the others. This integration is the core originality of SPM.
━━━━━━━━━━━━━━━━━━━━━━━━━━━━━━━━━━━━━━━━━━━
For best results, combine SPM with your own market understanding and always practice proper risk management.
-BullByte

Adaptive Market Wave TheoryAdaptive Market Wave Theory
🌊 CORE INNOVATION: PROBABILISTIC PHASE DETECTION WITH MULTI-AGENT CONSENSUS
Adaptive Market Wave Theory (AMWT) represents a fundamental paradigm shift in how traders approach market phase identification. Rather than counting waves subjectively or drawing static breakout levels, AMWT treats the market as a hidden state machine —using Hidden Markov Models, multi-agent consensus systems, and reinforcement learning algorithms to quantify what traditional methods leave to interpretation.
The Wave Analysis Problem:
Traditional wave counting methodologies (Elliott Wave, harmonic patterns, ABC corrections) share fatal weaknesses that AMWT directly addresses:
1. Non-Falsifiability : Invalid wave counts can always be "recounted" or "adjusted." If your Wave 3 fails, it becomes "Wave 3 of a larger degree" or "actually Wave C." There's no objective failure condition.
2. Observer Bias : Two expert wave analysts examining the same chart routinely reach different conclusions. This isn't a feature—it's a fundamental methodology flaw.
3. No Confidence Measure : Traditional analysis says "This IS Wave 3." But with what probability? 51%? 95%? The binary nature prevents proper position sizing and risk management.
4. Static Rules : Fixed Fibonacci ratios and wave guidelines cannot adapt to changing market regimes. What worked in 2019 may fail in 2024.
5. No Accountability : Wave methodologies rarely track their own performance. There's no feedback loop to improve.
The AMWT Solution:
AMWT addresses each limitation through rigorous mathematical frameworks borrowed from speech recognition, machine learning, and reinforcement learning:
• Non-Falsifiability → Hard Invalidation : Wave hypotheses die permanently when price violates calculated invalidation levels. No recounting allowed.
• Observer Bias → Multi-Agent Consensus : Three independent analytical agents must agree. Single-methodology bias is eliminated.
• No Confidence → Probabilistic States : Every market state has a calculated probability from Hidden Markov Model inference. "72% probability of impulse state" replaces "This is Wave 3."
• Static Rules → Adaptive Learning : Thompson Sampling multi-armed bandits learn which agents perform best in current conditions. The system adapts in real-time.
• No Accountability → Performance Tracking : Comprehensive statistics track every signal's outcome. The system knows its own performance.
The Core Insight:
"Traditional wave analysis asks 'What count is this?' AMWT asks 'What is the probability we are in an impulsive state, with what confidence, confirmed by how many independent methodologies, and anchored to what liquidity event?'"
🔬 THEORETICAL FOUNDATION: HIDDEN MARKOV MODELS
Why Hidden Markov Models?
Markets exist in hidden states that we cannot directly observe—only their effects on price are visible. When the market is in an "impulse up" state, we see rising prices, expanding volume, and trending indicators. But we don't observe the state itself—we infer it from observables.
This is precisely the problem Hidden Markov Models (HMMs) solve. Originally developed for speech recognition (inferring words from sound waves), HMMs excel at estimating hidden states from noisy observations.
HMM Components:
1. Hidden States (S) : The unobservable market conditions
2. Observations (O) : What we can measure (price, volume, indicators)
3. Transition Matrix (A) : Probability of moving between states
4. Emission Matrix (B) : Probability of observations given each state
5. Initial Distribution (π) : Starting state probabilities
AMWT's Six Market States:
State 0: IMPULSE_UP
• Definition: Strong bullish momentum with high participation
• Observable Signatures: Rising prices, expanding volume, RSI >60, price above upper Bollinger Band, MACD histogram positive and rising
• Typical Duration: 5-20 bars depending on timeframe
• What It Means: Institutional buying pressure, trend acceleration phase
State 1: IMPULSE_DN
• Definition: Strong bearish momentum with high participation
• Observable Signatures: Falling prices, expanding volume, RSI <40, price below lower Bollinger Band, MACD histogram negative and falling
• Typical Duration: 5-20 bars (often shorter than bullish impulses—markets fall faster)
• What It Means: Institutional selling pressure, panic or distribution acceleration
State 2: CORRECTION
• Definition: Counter-trend consolidation with declining momentum
• Observable Signatures: Sideways or mild counter-trend movement, contracting volume, RSI returning toward 50, Bollinger Bands narrowing
• Typical Duration: 8-30 bars
• What It Means: Profit-taking, digestion of prior move, potential accumulation for next leg
State 3: ACCUMULATION
• Definition: Base-building near lows where informed participants absorb supply
• Observable Signatures: Price near recent lows but not making new lows, volume spikes on up bars, RSI showing positive divergence, tight range
• Typical Duration: 15-50 bars
• What It Means: Smart money buying from weak hands, preparing for markup phase
State 4: DISTRIBUTION
• Definition: Top-forming near highs where informed participants distribute holdings
• Observable Signatures: Price near recent highs but struggling to advance, volume spikes on down bars, RSI showing negative divergence, widening range
• Typical Duration: 15-50 bars
• What It Means: Smart money selling to late buyers, preparing for markdown phase
State 5: TRANSITION
• Definition: Regime change period with mixed signals and elevated uncertainty
• Observable Signatures: Conflicting indicators, whipsaw price action, no clear momentum, high volatility without direction
• Typical Duration: 5-15 bars
• What It Means: Market deciding next direction, dangerous for directional trades
The Transition Matrix:
The transition matrix A captures the probability of moving from one state to another. AMWT initializes with empirically-derived values then updates online:
From/To IMP_UP IMP_DN CORR ACCUM DIST TRANS
IMP_UP 0.70 0.02 0.20 0.02 0.04 0.02
IMP_DN 0.02 0.70 0.20 0.04 0.02 0.02
CORR 0.15 0.15 0.50 0.10 0.10 0.00
ACCUM 0.30 0.05 0.15 0.40 0.05 0.05
DIST 0.05 0.30 0.15 0.05 0.40 0.05
TRANS 0.20 0.20 0.20 0.15 0.15 0.10
Key Insights from Transition Probabilities:
• Impulse states are sticky (70% self-transition): Once trending, markets tend to continue
• Corrections can transition to either impulse direction (15% each): The next move after correction is uncertain
• Accumulation strongly favors IMP_UP transition (30%): Base-building leads to rallies
• Distribution strongly favors IMP_DN transition (30%): Topping leads to declines
The Viterbi Algorithm:
Given a sequence of observations, how do we find the most likely state sequence? This is the Viterbi algorithm—dynamic programming to find the optimal path through the state space.
Mathematical Formulation:
δ_t(j) = max_i × B_j(O_t)
Where:
δ_t(j) = probability of most likely path ending in state j at time t
A_ij = transition probability from state i to state j
B_j(O_t) = emission probability of observation O_t given state j
AMWT Implementation:
AMWT runs Viterbi over a rolling window (default 50 bars), computing the most likely state sequence and extracting:
• Current state estimate
• State confidence (probability of current state vs alternatives)
• State sequence for pattern detection
Online Learning (Baum-Welch Adaptation):
Unlike static HMMs, AMWT continuously updates its transition and emission matrices based on observed market behavior:
f_onlineUpdateHMM(prev_state, curr_state, observation, decay) =>
// Update transition matrix
A *= decay
A += (1.0 - decay)
// Renormalize row
// Update emission matrix
B *= decay
B += (1.0 - decay)
// Renormalize row
The decay parameter (default 0.85) controls adaptation speed:
• Higher decay (0.95): Slower adaptation, more stable, better for consistent markets
• Lower decay (0.80): Faster adaptation, more reactive, better for regime changes
Why This Matters for Trading:
Traditional indicators give you a number (RSI = 72). AMWT gives you a probabilistic state assessment :
"There is a 78% probability we are in IMPULSE_UP state, with 15% probability of CORRECTION and 7% distributed among other states. The transition matrix suggests 70% chance of remaining in IMPULSE_UP next bar, 20% chance of transitioning to CORRECTION."
This enables:
• Position sizing by confidence : 90% confidence = full size; 60% confidence = half size
• Risk management by transition probability : High correction probability = tighten stops
• Strategy selection by state : IMPULSE = trend-follow; CORRECTION = wait; ACCUMULATION = scale in
🎰 THE 3-BANDIT CONSENSUS SYSTEM
The Multi-Agent Philosophy:
No single analytical methodology works in all market conditions. Trend-following excels in trending markets but gets chopped in ranges. Mean-reversion excels in ranges but gets crushed in trends. Structure-based analysis works when structure is clear but fails in chaotic markets.
AMWT's solution: employ three independent agents , each analyzing the market from a different perspective, then use Thompson Sampling to learn which agents perform best in current conditions.
Agent 1: TREND AGENT
Philosophy : Markets trend. Follow the trend until it ends.
Analytical Components:
• EMA Alignment: EMA8 > EMA21 > EMA50 (bullish) or inverse (bearish)
• MACD Histogram: Direction and rate of change
• Price Momentum: Close relative to ATR-normalized movement
• VWAP Position: Price above/below volume-weighted average price
Signal Generation:
Strong Bull: EMA aligned bull AND MACD histogram > 0 AND momentum > 0.3 AND close > VWAP
→ Signal: +1 (Long), Confidence: 0.75 + |momentum| × 0.4
Moderate Bull: EMA stack bull AND MACD rising AND momentum > 0.1
→ Signal: +1 (Long), Confidence: 0.65 + |momentum| × 0.3
Strong Bear: EMA aligned bear AND MACD histogram < 0 AND momentum < -0.3 AND close < VWAP
→ Signal: -1 (Short), Confidence: 0.75 + |momentum| × 0.4
Moderate Bear: EMA stack bear AND MACD falling AND momentum < -0.1
→ Signal: -1 (Short), Confidence: 0.65 + |momentum| × 0.3
When Trend Agent Excels:
• Trend days (IB extension >1.5x)
• Post-breakout continuation
• Institutional accumulation/distribution phases
When Trend Agent Fails:
• Range-bound markets (ADX <20)
• Chop zones after volatility spikes
• Reversal days at major levels
Agent 2: REVERSION AGENT
Philosophy: Markets revert to mean. Extreme readings reverse.
Analytical Components:
• Bollinger Band Position: Distance from bands, percent B
• RSI Extremes: Overbought (>70) and oversold (<30)
• Stochastic: %K/%D crossovers at extremes
• Band Squeeze: Bollinger Band width contraction
Signal Generation:
Oversold Bounce: BB %B < 0.20 AND RSI < 35 AND Stochastic < 25
→ Signal: +1 (Long), Confidence: 0.70 + (30 - RSI) × 0.01
Overbought Fade: BB %B > 0.80 AND RSI > 65 AND Stochastic > 75
→ Signal: -1 (Short), Confidence: 0.70 + (RSI - 70) × 0.01
Squeeze Fire Bull: Band squeeze ending AND close > upper band
→ Signal: +1 (Long), Confidence: 0.65
Squeeze Fire Bear: Band squeeze ending AND close < lower band
→ Signal: -1 (Short), Confidence: 0.65
When Reversion Agent Excels:
• Rotation days (price stays within IB)
• Range-bound consolidation
• After extended moves without pullback
When Reversion Agent Fails:
• Strong trend days (RSI can stay overbought for days)
• Breakout moves
• News-driven directional moves
Agent 3: STRUCTURE AGENT
Philosophy: Market structure reveals institutional intent. Follow the smart money.
Analytical Components:
• Break of Structure (BOS): Price breaks prior swing high/low
• Change of Character (CHOCH): First break against prevailing trend
• Higher Highs/Higher Lows: Bullish structure
• Lower Highs/Lower Lows: Bearish structure
• Liquidity Sweeps: Stop runs that reverse
Signal Generation:
BOS Bull: Price breaks above prior swing high with momentum
→ Signal: +1 (Long), Confidence: 0.70 + structure_strength × 0.2
CHOCH Bull: First higher low after downtrend, breaking structure
→ Signal: +1 (Long), Confidence: 0.75
BOS Bear: Price breaks below prior swing low with momentum
→ Signal: -1 (Short), Confidence: 0.70 + structure_strength × 0.2
CHOCH Bear: First lower high after uptrend, breaking structure
→ Signal: -1 (Short), Confidence: 0.75
Liquidity Sweep Long: Price sweeps below swing low then reverses strongly
→ Signal: +1 (Long), Confidence: 0.80
Liquidity Sweep Short: Price sweeps above swing high then reverses strongly
→ Signal: -1 (Short), Confidence: 0.80
When Structure Agent Excels:
• After liquidity grabs (stop runs)
• At major swing points
• During institutional accumulation/distribution
When Structure Agent Fails:
• Choppy, structureless markets
• During news events (structure becomes noise)
• Very low timeframes (noise overwhelms structure)
Thompson Sampling: The Bandit Algorithm
With three agents giving potentially different signals, how do we decide which to trust? This is the multi-armed bandit problem —balancing exploitation (using what works) with exploration (testing alternatives).
Thompson Sampling Solution:
Each agent maintains a Beta distribution representing its success/failure history:
Agent success rate modeled as Beta(α, β)
Where:
α = number of successful signals + 1
β = number of failed signals + 1
On Each Bar:
1. Sample from each agent's Beta distribution
2. Weight agent signals by sampled probabilities
3. Combine weighted signals into consensus
4. Update α/β based on trade outcomes
Mathematical Implementation:
// Beta sampling via Gamma ratio method
f_beta_sample(alpha, beta) =>
g1 = f_gamma_sample(alpha)
g2 = f_gamma_sample(beta)
g1 / (g1 + g2)
// Thompson Sampling selection
for each agent:
sampled_prob = f_beta_sample(agent.alpha, agent.beta)
weight = sampled_prob / sum(all_sampled_probs)
consensus += agent.signal × agent.confidence × weight
Why Thompson Sampling?
• Automatic Exploration : Agents with few samples get occasional chances (high variance in Beta distribution)
• Bayesian Optimal : Mathematically proven optimal solution to exploration-exploitation tradeoff
• Uncertainty-Aware : Small sample size = more exploration; large sample size = more exploitation
• Self-Correcting : Poor performers naturally get lower weights over time
Example Evolution:
Day 1 (Initial):
Trend Agent: Beta(1,1) → samples ~0.50 (high uncertainty)
Reversion Agent: Beta(1,1) → samples ~0.50 (high uncertainty)
Structure Agent: Beta(1,1) → samples ~0.50 (high uncertainty)
After 50 Signals:
Trend Agent: Beta(28,23) → samples ~0.55 (moderate confidence)
Reversion Agent: Beta(18,33) → samples ~0.35 (underperforming)
Structure Agent: Beta(32,19) → samples ~0.63 (outperforming)
Result: Structure Agent now receives highest weight in consensus
Consensus Requirements by Mode:
Aggressive Mode:
• Minimum 1/3 agents agreeing
• Consensus threshold: 45%
• Use case: More signals, higher risk tolerance
Balanced Mode:
• Minimum 2/3 agents agreeing
• Consensus threshold: 55%
• Use case: Standard trading
Conservative Mode:
• Minimum 2/3 agents agreeing
• Consensus threshold: 65%
• Use case: Higher quality, fewer signals
Institutional Mode:
• Minimum 2/3 agents agreeing
• Consensus threshold: 75%
• Additional: Session quality >0.65, mode adjustment +0.10
• Use case: Highest quality signals only
🌀 INTELLIGENT CHOP DETECTION ENGINE
The Chop Problem:
Most trading losses occur not from being wrong about direction, but from trading in conditions where direction doesn't exist . Choppy, range-bound markets generate false signals from every methodology—trend-following, mean-reversion, and structure-based alike.
AMWT's chop detection engine identifies these low-probability environments before signals fire, preventing the most damaging trades.
Five-Factor Chop Analysis:
Factor 1: ADX Component (25% weight)
ADX (Average Directional Index) measures trend strength regardless of direction.
ADX < 15: Very weak trend (high chop score)
ADX 15-20: Weak trend (moderate chop score)
ADX 20-25: Developing trend (low chop score)
ADX > 25: Strong trend (minimal chop score)
adx_chop = (i_adxThreshold - adx_val) / i_adxThreshold × 100
Why ADX Works: ADX synthesizes +DI and -DI movements. Low ADX means price is moving but not directionally—the definition of chop.
Factor 2: Choppiness Index (25% weight)
The Choppiness Index measures price efficiency using the ratio of ATR sum to price range:
CI = 100 × LOG10(SUM(ATR, n) / (Highest - Lowest)) / LOG10(n)
CI > 61.8: Choppy (range-bound, inefficient movement)
CI < 38.2: Trending (directional, efficient movement)
CI 38.2-61.8: Transitional
chop_idx_score = (ci_val - 38.2) / (61.8 - 38.2) × 100
Why Choppiness Index Works: In trending markets, price covers distance efficiently (low ATR sum relative to range). In choppy markets, price oscillates wildly but goes nowhere (high ATR sum relative to range).
Factor 3: Range Compression (20% weight)
Compares recent range to longer-term range, detecting volatility squeezes:
recent_range = Highest(20) - Lowest(20)
longer_range = Highest(50) - Lowest(50)
compression = 1 - (recent_range / longer_range)
compression > 0.5: Strong squeeze (potential breakout imminent)
compression < 0.2: No compression (normal volatility)
range_compression_score = compression × 100
Why Range Compression Matters: Compression precedes expansion. High compression = market coiling, preparing for move. Signals during compression often fail because the breakout hasn't occurred yet.
Factor 4: Channel Position (15% weight)
Tracks price position within the macro channel:
channel_position = (close - channel_low) / (channel_high - channel_low)
position 0.4-0.6: Center of channel (indecision zone)
position <0.2 or >0.8: Near extremes (potential reversal or breakout)
channel_chop = abs(0.5 - channel_position) < 0.15 ? high_score : low_score
Why Channel Position Matters: Price in the middle of a range is in "no man's land"—equally likely to go either direction. Signals in the channel center have lower probability.
Factor 5: Volume Quality (15% weight)
Assesses volume relative to average:
vol_ratio = volume / SMA(volume, 20)
vol_ratio < 0.7: Low volume (lack of conviction)
vol_ratio 0.7-1.3: Normal volume
vol_ratio > 1.3: High volume (conviction present)
volume_chop = vol_ratio < 0.8 ? (1 - vol_ratio) × 100 : 0
Why Volume Quality Matters: Low volume moves lack institutional participation. These moves are more likely to reverse or stall.
Combined Chop Intensity:
chopIntensity = (adx_chop × 0.25) + (chop_idx_score × 0.25) +
(range_compression_score × 0.20) + (channel_chop × 0.15) +
(volume_chop × i_volumeChopWeight × 0.15)
Regime Classifications:
Based on chop intensity and component analysis:
• Strong Trend (0-20%): ADX >30, clear directional momentum, trade aggressively
• Trending (20-35%): ADX >20, moderate directional bias, trade normally
• Transitioning (35-50%): Mixed signals, regime change possible, reduce size
• Mid-Range (50-60%): Price trapped in channel center, avoid new positions
• Ranging (60-70%): Low ADX, price oscillating within bounds, fade extremes only
• Compression (70-80%): Volatility squeeze, expansion imminent, wait for breakout
• Strong Chop (80-100%): Multiple chop factors aligned, avoid trading entirely
Signal Suppression:
When chop intensity exceeds the configurable threshold (default 80%), signals are suppressed entirely. The dashboard displays "⚠️ CHOP ZONE" with the current regime classification.
Chop Box Visualization:
When chop is detected, AMWT draws a semi-transparent box on the chart showing the chop zone. This visual reminder helps traders avoid entering positions during unfavorable conditions.
💧 LIQUIDITY ANCHORING SYSTEM
The Liquidity Concept:
Markets move from liquidity pool to liquidity pool. Stop losses cluster at predictable locations—below swing lows (buy stops become sell orders when triggered) and above swing highs (sell stops become buy orders when triggered). Institutions know where these clusters are and often engineer moves to trigger them before reversing.
AMWT identifies and tracks these liquidity events, using them as anchors for signal confidence.
Liquidity Event Types:
Type 1: Volume Spikes
Definition: Volume > SMA(volume, 20) × i_volThreshold (default 2.8x)
Interpretation: Sudden volume surge indicates institutional activity
• Near swing low + reversal: Likely accumulation
• Near swing high + reversal: Likely distribution
• With continuation: Institutional conviction in direction
Type 2: Stop Runs (Liquidity Sweeps)
Definition: Price briefly exceeds swing high/low then reverses within N bars
Detection:
• Price breaks above recent swing high (triggering buy stops)
• Then closes back below that high within 3 bars
• Signal: Bullish stop run complete, reversal likely
Or inverse for bearish:
• Price breaks below recent swing low (triggering sell stops)
• Then closes back above that low within 3 bars
• Signal: Bearish stop run complete, reversal likely
Type 3: Absorption Events
Definition: High volume with small candle body
Detection:
• Volume > 2x average
• Candle body < 30% of candle range
• Interpretation: Large orders being filled without moving price
• Implication: Accumulation (at lows) or distribution (at highs)
Type 4: BSL/SSL Pools (Buy-Side/Sell-Side Liquidity)
BSL (Buy-Side Liquidity):
• Cluster of swing highs within ATR proximity
• Stop losses from shorts sit above these highs
• Breaking BSL triggers short covering (fuel for rally)
SSL (Sell-Side Liquidity):
• Cluster of swing lows within ATR proximity
• Stop losses from longs sit below these lows
• Breaking SSL triggers long liquidation (fuel for decline)
Liquidity Pool Mapping:
AMWT continuously scans for and maps liquidity pools:
// Detect swing highs/lows using pivot function
swing_high = ta.pivothigh(high, 5, 5)
swing_low = ta.pivotlow(low, 5, 5)
// Track recent swing points
if not na(swing_high)
bsl_levels.push(swing_high)
if not na(swing_low)
ssl_levels.push(swing_low)
// Display on chart with labels
Confluence Scoring Integration:
When signals fire near identified liquidity events, confluence scoring increases:
• Signal near volume spike: +10% confidence
• Signal after liquidity sweep: +15% confidence
• Signal at BSL/SSL pool: +10% confidence
• Signal aligned with absorption zone: +10% confidence
Why Liquidity Anchoring Matters:
Signals "in a vacuum" have lower probability than signals anchored to institutional activity. A long signal after a liquidity sweep below swing lows has trapped shorts providing fuel. A long signal in the middle of nowhere has no such catalyst.
📊 SIGNAL GRADING SYSTEM
The Quality Problem:
Not all signals are created equal. A signal with 6/6 factors aligned is fundamentally different from a signal with 3/6 factors aligned. Traditional indicators treat them the same. AMWT grades every signal based on confluence.
Confluence Components (100 points total):
1. Bandit Consensus Strength (25 points)
consensus_str = weighted average of agent confidences
score = consensus_str × 25
Example:
Trend Agent: +1 signal, 0.80 confidence, 0.35 weight
Reversion Agent: 0 signal, 0.50 confidence, 0.25 weight
Structure Agent: +1 signal, 0.75 confidence, 0.40 weight
Weighted consensus = (0.80×0.35 + 0×0.25 + 0.75×0.40) / (0.35 + 0.40) = 0.77
Score = 0.77 × 25 = 19.25 points
2. HMM State Confidence (15 points)
score = hmm_confidence × 15
Example:
HMM reports 82% probability of IMPULSE_UP
Score = 0.82 × 15 = 12.3 points
3. Session Quality (15 points)
Session quality varies by time:
• London/NY Overlap: 1.0 (15 points)
• New York Session: 0.95 (14.25 points)
• London Session: 0.70 (10.5 points)
• Asian Session: 0.40 (6 points)
• Off-Hours: 0.30 (4.5 points)
• Weekend: 0.10 (1.5 points)
4. Energy/Participation (10 points)
energy = (realized_vol / avg_vol) × 0.4 + (range / ATR) × 0.35 + (volume / avg_volume) × 0.25
score = min(energy, 1.0) × 10
5. Volume Confirmation (10 points)
if volume > SMA(volume, 20) × 1.5:
score = 10
else if volume > SMA(volume, 20):
score = 5
else:
score = 0
6. Structure Alignment (10 points)
For long signals:
• Bullish structure (HH + HL): 10 points
• Higher low only: 6 points
• Neutral structure: 3 points
• Bearish structure: 0 points
Inverse for short signals
7. Trend Alignment (10 points)
For long signals:
• Price > EMA21 > EMA50: 10 points
• Price > EMA21: 6 points
• Neutral: 3 points
• Against trend: 0 points
8. Entry Trigger Quality (5 points)
• Strong trigger (multiple confirmations): 5 points
• Moderate trigger (single confirmation): 3 points
• Weak trigger (marginal): 1 point
Grade Scale:
Total Score → Grade
85-100 → A+ (Exceptional—all factors aligned)
70-84 → A (Strong—high probability)
55-69 → B (Acceptable—proceed with caution)
Below 55 → C (Marginal—filtered by default)
Grade-Based Signal Brightness:
Signal arrows on the chart have transparency based on grade:
• A+: Full brightness (alpha = 0)
• A: Slight fade (alpha = 15)
• B: Moderate fade (alpha = 35)
• C: Significant fade (alpha = 55)
This visual hierarchy helps traders instantly identify signal quality.
Minimum Grade Filter:
Configurable filter (default: C) sets the minimum grade for signal display:
• Set to "A" for only highest-quality signals
• Set to "B" for moderate selectivity
• Set to "C" for all signals (maximum quantity)
🕐 SESSION INTELLIGENCE
Why Sessions Matter:
Markets behave differently at different times. The London open is fundamentally different from the Asian lunch hour. AMWT incorporates session-aware logic to optimize signal quality.
Session Definitions:
Asian Session (18:00-03:00 ET)
• Characteristics: Lower volatility, range-bound tendency, fewer institutional participants
• Quality Score: 0.40 (40% of peak quality)
• Strategy Implications: Fade extremes, expect ranges, smaller position sizes
• Best For: Mean-reversion setups, accumulation/distribution identification
London Session (03:00-12:00 ET)
• Characteristics: European institutional activity, volatility pickup, trend initiation
• Quality Score: 0.70 (70% of peak quality)
• Strategy Implications: Watch for trend development, breakouts more reliable
• Best For: Initial trend identification, structure breaks
New York Session (08:00-17:00 ET)
• Characteristics: Highest liquidity, US institutional activity, major moves
• Quality Score: 0.95 (95% of peak quality)
• Strategy Implications: Best environment for directional trades
• Best For: Trend continuation, momentum plays
London/NY Overlap (08:00-12:00 ET)
• Characteristics: Peak liquidity, both European and US participants active
• Quality Score: 1.0 (100%—maximum quality)
• Strategy Implications: Highest probability for successful breakouts and trends
• Best For: All signal types—this is prime time
Off-Hours
• Characteristics: Thin liquidity, erratic price action, gaps possible
• Quality Score: 0.30 (30% of peak quality)
• Strategy Implications: Avoid new positions, wider stops if holding
• Best For: Waiting
Smart Weekend Detection:
AMWT properly handles the Sunday evening futures open:
// Traditional (broken):
isWeekend = dayofweek == saturday OR dayofweek == sunday
// AMWT (correct):
anySessionActive = not na(asianTime) or not na(londonTime) or not na(nyTime)
isWeekend = calendarWeekend AND NOT anySessionActive
This ensures Sunday 6pm ET (when futures open) correctly shows "Asian Session" rather than "Weekend."
Session Transition Boosts:
Certain session transitions create trading opportunities:
• Asian → London transition: +15% confidence boost (volatility expansion likely)
• London → Overlap transition: +20% confidence boost (peak liquidity approaching)
• Overlap → NY-only transition: -10% confidence adjustment (liquidity declining)
• Any → Off-Hours transition: Signal suppression recommended
📈 TRADE MANAGEMENT SYSTEM
The Signal Spam Problem:
Many indicators generate signal after signal, creating confusion and overtrading. AMWT implements a complete trade lifecycle management system that prevents signal spam and tracks performance.
Trade Lock Mechanism:
Once a signal fires, the system enters a "trade lock" state:
Trade Lock Duration: Configurable (default 30 bars)
Early Exit Conditions:
• TP3 hit (full target reached)
• Stop Loss hit (trade failed)
• Lock expiration (time-based exit)
During lock:
• No new signals of same type displayed
• Opposite signals can override (reversal)
• Trade status tracked in dashboard
Target Levels:
Each signal generates three profit targets based on ATR:
TP1 (Conservative Target)
• Default: 1.0 × ATR
• Purpose: Quick partial profit, reduce risk
• Action: Take 30-40% off position, move stop to breakeven
TP2 (Standard Target)
• Default: 2.5 × ATR
• Purpose: Main profit target
• Action: Take 40-50% off position, trail stop
TP3 (Extended Target)
• Default: 5.0 × ATR
• Purpose: Runner target for trend days
• Action: Close remaining position or continue trailing
Stop Loss:
• Default: 1.9 × ATR from entry
• Purpose: Define maximum risk
• Placement: Below recent swing low (longs) or above recent swing high (shorts)
Invalidation Level:
Beyond stop loss, AMWT calculates an "invalidation" level where the wave hypothesis dies:
invalidation = entry - (ATR × INVALIDATION_MULT × 1.5)
If price reaches invalidation, the current market interpretation is wrong—not just the trade.
Visual Trade Management:
During active trades, AMWT displays:
• Entry arrow with grade label (▲A+, ▼B, etc.)
• TP1, TP2, TP3 horizontal lines in green
• Stop Loss line in red
• Invalidation line in orange (dashed)
• Progress indicator in dashboard
Persistent Execution Markers:
When targets or stops are hit, permanent markers appear:
• TP hit: Green dot with "TP1"/"TP2"/"TP3" label
• SL hit: Red dot with "SL" label
These persist on the chart for review and statistics.
💰 PERFORMANCE TRACKING & STATISTICS
Tracked Metrics:
• Total Trades: Count of all signals that entered trade lock
• Winning Trades: Signals where at least TP1 was reached before SL
• Losing Trades: Signals where SL was hit before any TP
• Win Rate: Winning / Total × 100%
• Total R Profit: Sum of R-multiples from winning trades
• Total R Loss: Sum of R-multiples from losing trades
• Net R: Total R Profit - Total R Loss
Currency Conversion System:
AMWT can display P&L in multiple formats:
R-Multiple (Default)
• Shows risk-normalized returns
• "Net P&L: +4.2R | 78 trades" means 4.2 times initial risk gained over 78 trades
• Best for comparing across different position sizes
Currency Conversion (USD/EUR/GBP/JPY/INR)
• Converts R-multiples to currency based on:
- Dollar Risk Per Trade (user input)
- Tick Value (user input)
- Selected currency
Example Configuration:
Dollar Risk Per Trade: $100
Display Currency: USD
If Net R = +4.2R
Display: Net P&L: +$420.00 | 78 trades
Ticks
• For futures traders who think in ticks
• Converts based on tick value input
Statistics Reset:
Two reset methods:
1. Toggle Reset
• Turn "Reset Statistics" toggle ON then OFF
• Clears all statistics immediately
2. Date-Based Reset
• Set "Reset After Date" (YYYY-MM-DD format)
• Only trades after this date are counted
• Useful for isolating recent performance
🎨 VISUAL FEATURES
Macro Channel:
Dynamic regression-based channel showing market boundaries:
• Upper/lower bounds calculated from swing pivot linear regression
• Adapts to current market structure
• Shows overall trend direction and potential reversal zones
Chop Boxes:
Semi-transparent overlay during high-chop periods:
• Purple/orange coloring indicates dangerous conditions
• Visual reminder to avoid new positions
Confluence Heat Zones:
Background shading indicating setup quality:
• Darker shading = higher confluence
• Lighter shading = lower confluence
• Helps identify optimal entry timing
EMA Ribbon:
Trend visualization via moving average fill:
• EMA 8/21/50 with gradient fill between
• Green fill when bullish aligned
• Red fill when bearish aligned
• Gray when neutral
Absorption Zone Boxes:
Marks potential accumulation/distribution areas:
• High volume + small body = absorption
• Boxes drawn at these levels
• Often act as support/resistance
Liquidity Pool Lines:
BSL/SSL levels with labels:
• Dashed lines at liquidity clusters
• "BSL" label above swing high clusters
• "SSL" label below swing low clusters
Six Professional Themes:
• Quantum: Deep purples and cyans (default)
• Cyberpunk: Neon pinks and blues
• Professional: Muted grays and greens
• Ocean: Blues and teals
• Matrix: Greens and blacks
• Ember: Oranges and reds
🎓 PROFESSIONAL USAGE PROTOCOL
Phase 1: Learning the System (Week 1)
Goal: Understand AMWT concepts and dashboard interpretation
Setup:
• Signal Mode: Balanced
• Display: All features enabled
• Grade Filter: C (see all signals)
Actions:
• Paper trade ONLY—no real money
• Observe HMM state transitions throughout the day
• Note when agents agree vs disagree
• Watch chop detection engage and disengage
• Track which grades produce winners vs losers
Key Learning Questions:
• How often do A+ signals win vs B signals? (Should see clear difference)
• Which agent tends to be right in current market? (Check dashboard)
• When does chop detection save you from bad trades?
• How do signals near liquidity events perform vs signals in vacuum?
Phase 2: Parameter Optimization (Week 2)
Goal: Tune system to your instrument and timeframe
Signal Mode Testing:
• Run 5 days on Aggressive mode (more signals)
• Run 5 days on Conservative mode (fewer signals)
• Compare: Which produces better risk-adjusted returns?
Grade Filter Testing:
• Track A+ only for 20 signals
• Track A and above for 20 signals
• Track B and above for 20 signals
• Compare win rates and expectancy
Chop Threshold Testing:
• Default (80%): Standard filtering
• Try 70%: More aggressive filtering
• Try 90%: Less filtering
• Which produces best results for your instrument?
Phase 3: Strategy Development (Weeks 3-4)
Goal: Develop personal trading rules based on system signals
Position Sizing by Grade:
• A+ grade: 100% position size
• A grade: 75% position size
• B grade: 50% position size
• C grade: 25% position size (or skip)
Session-Based Rules:
• London/NY Overlap: Take all A/A+ signals
• NY Session: Take all A+ signals, selective on A
• Asian Session: Only A+ signals with extra confirmation
• Off-Hours: No new positions
Chop Zone Rules:
• Chop >70%: Reduce position size 50%
• Chop >80%: No new positions
• Chop <50%: Full position size allowed
Phase 4: Live Micro-Sizing (Month 2)
Goal: Validate paper trading results with minimal risk
Setup:
• 10-20% of intended full position size
• Take ONLY A+ signals initially
• Follow trade management religiously
Tracking:
• Log every trade: Entry, Exit, Grade, HMM State, Chop Level, Agent Consensus
• Calculate: Win rate by grade, by session, by chop level
• Compare to paper trading (should be within 15%)
Red Flags:
• Win rate diverges significantly from paper trading: Execution issues
• Consistent losses during certain sessions: Adjust session rules
• Losses cluster when specific agent dominates: Review that agent's logic
Phase 5: Scaling Up (Months 3-6)
Goal: Gradually increase to full position size
Progression:
• Month 3: 25-40% size (if micro-sizing profitable)
• Month 4: 40-60% size
• Month 5: 60-80% size
• Month 6: 80-100% size
Scale-Up Requirements:
• Minimum 30 trades at current size
• Win rate ≥50%
• Net R positive
• No revenge trading incidents
• Emotional control maintained
💡 DEVELOPMENT INSIGHTS
Why HMM Over Simple Indicators:
Early versions used standard indicators (RSI >70 = overbought, etc.). Win rates hovered at 52-55%. The problem: indicators don't capture state. RSI can stay "overbought" for weeks in a strong trend.
The insight: markets exist in states, and state persistence matters more than indicator levels. Implementing HMM with state transition probabilities increased signal quality significantly. The system now knows not just "RSI is high" but "we're in IMPULSE_UP state with 70% probability of staying in IMPULSE_UP."
The Multi-Agent Evolution:
Original version used a single analytical methodology—trend-following. Performance was inconsistent: great in trends, destroyed in ranges. Added mean-reversion agent: now it was inconsistent the other way.
The breakthrough: use multiple agents and let the system learn which works . Thompson Sampling wasn't the first attempt—tried simple averaging, voting, even hard-coded regime switching. Thompson Sampling won because it's mathematically optimal and automatically adapts without manual regime detection.
Chop Detection Revelation:
Chop detection was added almost as an afterthought. "Let's filter out obviously bad conditions." Testing revealed it was the most impactful single feature. Filtering chop zones reduced losing trades by 35% while only reducing total signals by 20%. The insight: avoiding bad trades matters more than finding good ones.
Liquidity Anchoring Discovery:
Watched hundreds of trades. Noticed pattern: signals that fired after liquidity events (stop runs, volume spikes) had significantly higher win rates than signals in quiet markets. Implemented liquidity detection and anchoring. Win rate on liquidity-anchored signals: 68% vs 52% on non-anchored signals.
The Grade System Impact:
Early system had binary signals (fire or don't fire). Adding grading transformed it. Traders could finally match position size to signal quality. A+ signals deserved full size; C signals deserved caution. Just implementing grade-based sizing improved portfolio Sharpe ratio by 0.3.
🚨 LIMITATIONS & CRITICAL ASSUMPTIONS
What AMWT Is NOT:
• NOT a Holy Grail : No system wins every trade. AMWT improves probability, not certainty.
• NOT Fully Automated : AMWT provides signals and analysis; execution requires human judgment.
• NOT News-Proof : Exogenous shocks (FOMC surprises, geopolitical events) invalidate all technical analysis.
• NOT for Scalping : HMM state estimation needs time to develop. Sub-minute timeframes are not appropriate.
Core Assumptions:
1. Markets Have States : Assumes markets transition between identifiable regimes. Violation: Random walk markets with no regime structure.
2. States Are Inferable : Assumes observable indicators reveal hidden states. Violation: Market manipulation creating false signals.
3. History Informs Future : Assumes past agent performance predicts future performance. Violation: Regime changes that invalidate historical patterns.
4. Liquidity Events Matter : Assumes institutional activity creates predictable patterns. Violation: Markets with no institutional participation.
Performs Best On:
• Liquid Futures : ES, NQ, MNQ, MES, CL, GC
• Major Forex Pairs : EUR/USD, GBP/USD, USD/JPY
• Large-Cap Stocks : AAPL, MSFT, TSLA, NVDA (>$5B market cap)
• Liquid Crypto : BTC, ETH on major exchanges
Performs Poorly On:
• Illiquid Instruments : Low volume stocks, exotic pairs
• Very Low Timeframes : Sub-5-minute charts (noise overwhelms signal)
• Binary Event Days : Earnings, FDA approvals, court rulings
• Manipulated Markets : Penny stocks, low-cap altcoins
Known Weaknesses:
• Warmup Period : HMM needs ~50 bars to initialize properly. Early signals may be unreliable.
• Regime Change Lag : Thompson Sampling adapts over time, not instantly. Sudden regime changes may cause short-term underperformance.
• Complexity : More parameters than simple indicators. Requires understanding to use effectively.
⚠️ RISK DISCLOSURE
Trading futures, stocks, options, forex, and cryptocurrencies involves substantial risk of loss and is not suitable for all investors. Adaptive Market Wave Theory, while based on rigorous mathematical frameworks including Hidden Markov Models and multi-armed bandit algorithms, does not guarantee profits and can result in significant losses.
AMWT's methodologies—HMM state estimation, Thompson Sampling agent selection, and confluence-based grading—have theoretical foundations but past performance is not indicative of future results.
Hidden Markov Model assumptions may not hold during:
• Major news events disrupting normal market behavior
• Flash crashes or circuit breaker events
• Low liquidity periods with erratic price action
• Algorithmic manipulation or spoofing
Multi-agent consensus assumes independent analytical perspectives provide edge. Market conditions change. Edges that existed historically can diminish or disappear.
Users must independently validate system performance on their specific instruments, timeframes, and broker execution environment. Paper trade extensively before risking capital. Start with micro position sizing.
Never risk more than you can afford to lose completely. Use proper position sizing. Implement stop losses without exception.
By using this indicator, you acknowledge these risks and accept full responsibility for all trading decisions and outcomes.
"Elliott Wave was a first-order approximation of market phase behavior. AMWT is the second—probabilistic, adaptive, and accountable."
Initial Public Release
Core Engine:
• True Hidden Markov Model with online Baum-Welch learning
• Viterbi algorithm for optimal state sequence decoding
• 6-state market regime classification
Agent System:
• 3-Bandit consensus (Trend, Reversion, Structure)
• Thompson Sampling with true Beta distribution sampling
• Adaptive weight learning based on performance
Signal Generation:
• Quality-based confluence grading (A+/A/B/C)
• Four signal modes (Aggressive/Balanced/Conservative/Institutional)
• Grade-based visual brightness
Chop Detection:
• 5-factor analysis (ADX, Choppiness Index, Range Compression, Channel Position, Volume)
• 7 regime classifications
• Configurable signal suppression threshold
Liquidity:
• Volume spike detection
• Stop run (liquidity sweep) identification
• BSL/SSL pool mapping
• Absorption zone detection
Trade Management:
• Trade lock with configurable duration
• TP1/TP2/TP3 targets
• ATR-based stop loss
• Persistent execution markers
Session Intelligence:
• Asian/London/NY/Overlap detection
• Smart weekend handling (Sunday futures open)
• Session quality scoring
Performance:
• Statistics tracking with reset functionality
• 7 currency display modes
• Win rate and Net R calculation
Visuals:
• Macro channel with linear regression
• Chop boxes
• EMA ribbon
• Liquidity pool lines
• 6 professional themes
Dashboards:
• Main Dashboard: Market State, Consensus, Trade Status, Statistics
📋 AMWT vs AMWT-PRO:
This version includes all core AMWT functionality:
✓ Full Hidden Markov Model state estimation
✓ 3-Bandit Thompson Sampling consensus system
✓ Complete 5-factor chop detection engine
✓ All four signal modes
✓ Full trade management with TP/SL tracking
✓ Main dashboard with complete statistics
✓ All visual features (channels, zones, pools)
✓ Identical signal generation to PRO
✓ Six professional themes
✓ Full alert system
The PRO version adds the AMWT Advisor panel—a secondary dashboard providing:
• Real-time Market Pulse situation assessment
• Agent Matrix visualization (individual agent votes)
• Structure analysis breakdown
• "Watch For" upcoming setups
• Action Command coaching
Both versions generate identical signals . The Advisor provides additional guidance for interpreting those signals.
Taking you to school. - Dskyz, Trade with probability. Trade with consensus. Trade with AMWT.

Order Blocks+swl - Dual MTF Fixed ExtendedOrder Blocks+SWL - Dual MTF with Swing Validation
Overview
This advanced TradingView indicator combines Multi-Timeframe Order Block detection with Swing High/Low validation to identify high-probability supply and demand zones. The tool displays order blocks from higher timeframes and current timeframe, then highlights those that align with swing points for enhanced reliability.
🔧 Key Features
Multi-Timeframe Order Block Detection
- Current Timeframe: Detects order blocks on the chart's native timeframe
- HTF1 & HTF2: Two customizable higher timeframes (default: 60m, 240m)
- Independent Toggles: Enable/disable each timeframe's OBs separately
Smart Order Block Logic
- Long Order Blocks: Formed when current candle's LOW > middle candle's HIGH
- Short Order Blocks: Formed when current candle's HIGH < middle candle's LOW
- Persistent Display: Boxes extend until price fills the zone
- Color Coding:
- Current TF: Green (long) / Red (short)
- HTF1: Orange (long) / Maroon (short)
- HTF2: Blue (long) / Purple (short)
Swing Point Integration
-Swing Lows (SWL) & Swing Highs (SWH): Automatically detected using pivots
-Validation Overlay: Highlights order blocks that coincide with swing points
- Lime boxes: Long OBs with SWL confirmation
- Fuchsia boxes: Short OBs with SWH confirmation
Visual Elements
- Order Block Boxes: Semi-transparent zones with bold borders
- Entry Markers: Triangle shapes below/above bars for visual confirmation
- Swing Labels: SWL/SWH labels at pivot points
- Valid OB Overlay: Distinctive colored boxes for validated zones
⚙️ Input Parameters
Display Controls
- `Show Long OBs`: Toggle long order block display
- `Show Short OBs`: Toggle short order block display
- `Show Current TF OBs`: Display order blocks from current timeframe
- `Use HTF1/HTF2 OBs`: Enable higher timeframe order blocks
- `HTF1/HTF2`: Customizable timeframe strings
Technical Settings
- `My Input`: Maximum unfilled boxes to display (50-50000, default: 1000)
- `Swing Lookback / Forward Length`: Pivot detection sensitivity (default: 10)
📊 How It Works
1. Order Block Detection: The indicator scans three timeframes for specific candlestick patterns that indicate potential supply/demand zones.
2. Swing Point Detection: Simultaneously identifies swing highs and lows using pivot logic.
3. Validation Overlay: When an order block forms on the same candle as a swing point, it creates a special highlighted zone indicating higher probability.
4. Memory Management: Automatically manages box count to prevent performance issues while maintaining historical context.
🎯 Trading Applications
- Trend Continuation: Validated order blocks in trend direction offer high-probability entries
- Reversal Zones: Swing-aligned order blocks at key levels suggest potential reversals
- Multi-Timeframe Analysis: Higher timeframe OBs provide stronger support/resistance
- Zone Trading: Trade bounces from or breaks through validated zones
💡 Usage Tips
1. Prioritize Validated Zones: Focus on lime/fuchsia boxes as they have swing confirmation
2. Timeframe Hierarchy: HTF2 (240m) > HTF1 (60m) > Current TF for zone strength
3. Combine with Price Action: Use zones alongside candlestick patterns and volume
4. Risk Management: Place stops beyond opposite side of order block
⚠️ Limitations
- Not a standalone trading system - combine with other analysis
- May repaint on current bar until close
- Higher timeframes require sufficient historical data
- Swing detection sensitivity depends on length parameter
---
Note: This tool is for educational purposes. Always practice proper risk management and backtest strategies before live trading.

ICT Concepts [Kodexius]ICT Concepts is an all in one, chart overlay toolkit that combines several widely used ICT style components into a single, modular workflow. It is designed to help you map higher timeframe context, track directional structure, and refine execution areas with imbalance and liquidity concepts, without turning the chart into a cluttered drawing board.
Instead of plotting everything indefinitely, each module focuses on “live relevance” and chart readability. Zones, lines, and labels are managed with sensible limits so the most recent and most meaningful structures remain visible while older objects are automatically retired.
Because the system is modular, you can run it like a complete toolkit:
- Use multi timeframe Order Blocks to define high probability zones
- Use Market Structure (BOS and MSS) for bias and context
- Validate intent with SMT Divergence when you want intermarket confirmation
- Refine with Imbalances (FVG, BPR, CE) and Liquidity Sweeps
- Add timing structure via Killzones and risk structure via auto Fibonacci
🔹 Features
🔸 Multi Timeframe Order Blocks (3 candle displacement OB)
The OB engine detects a strict 3 candle displacement sequence (bull and bear) and projects the “order block candle” as a forward extending zone. Detection can run on the chart timeframe or on a user selected higher timeframe and then be displayed on your execution chart.
🔸 Overlap Control
Before adding a new OB, the script checks overlap against existing zones of the same direction. If a new zone intersects an existing one, it is ignored to reduce redundant stacking in the same price area.
🔸 Automatic Extension and Mitigation for Order Blocks
OB zones extend forward on every bar and are removed once mitigation is confirmed. Mitigation is evaluated by close breaking decisively beyond the relevant boundary:
- Bullish OB mitigates when close prints below the OB bottom
- Bearish OB mitigates when close prints above the OB top
🔸 Market Structure (BOS and MSS)
Market Structure is built from swing pivots using a configurable pivot length. When price closes through the latest swing, the script prints a structure event:
BOS (Break of Structure) for continuation
MSS (Market Structure Shift) for a directional change
To keep the chart readable, older structure drawings are capped by history limits.
🔸 SMT Divergence with optional mini panel
SMT can compare the current instrument with a user selected symbol to highlight divergence at swing points. A divergence is flagged when one market makes a new swing extreme while the other fails to confirm.
Optional: a compact right side “compare symbol” candle panel can be enabled so you can visually confirm what the secondary market is doing without leaving the chart.
🔸 Imbalances: FVG, BPR, and CE modes
You can choose between three imbalance views depending on your style:
FVG mode: Fair Value Gaps are plotted as extending zones
CE mode: Consequent Encroachment is visualized using a midpoint line and a half zone fill
BPR mode: Balanced Price Range is formed when a new FVG overlaps an opposing FVG, producing a “balanced” region that often behaves differently than a standalone gap
🔸 Automatic extension, limits, and mitigation for imbalances
Imbalance objects extend forward until mitigated. Mitigation uses wick based logic:
Bullish imbalance mitigates when price wicks below the zone bottom
Bearish imbalance mitigates when price wicks above the zone top
The script also enforces per side limits and removes older items to keep performance stable.
🔸 Liquidity sweeps (buyside and sellside)
The liquidity module tracks swing highs and lows and marks sweep events when price runs the level and then closes back through it, which often behaves like a rejection signal. Sweeps are visualized with a level line plus a small sweep highlight box, with an optional history cap.
🔸 Auto anchored Fibonacci (EQ and OTE focus)
Fibonacci levels are automatically anchored using the most recent structure context so you do not need to manually re draw fibs every time the market evolves. EQ and OTE focused bands are plotted to support common premium discount style workflows, with optional extra levels if desired.
🔸 Killzones (session boxes with optional range tracking)
Asian, London Open, New York AM, and New York PM killzones can be displayed using UTC-5 session definitions. Session boxes dynamically expand as new highs and lows are formed during the session, and historical zones can be retained up to a user set count. Rendering is restricted to intraday timeframes up to 60 minutes for clean scaling and performance.
🔹 Calculations
1) Order Block detection (3 candle displacement)
The OB pattern is defined inside detectLogic() . The zone boundaries always come from candle (the middle candle of the 3 candle sequence).
detectLogic() =>
bool isBull = open > close and close > open and close > open and low < low and close > high
bool isBear = open < close and close < open and close < open and high > high and close < low
[isBull, high , low , time , isBear, high , low , time ]
Interpretation (bullish side):
Candle is bearish
Candle is bullish (the OB candle)
Current candle is bullish and closes above high
low undercuts low to form the sweep style condition
Bearish logic is the mirrored inverse.
2) Multi timeframe projection and duplicate control
If the timeframe input is set, detections are computed on that timeframe and projected onto the current chart using request.security . A last processed time check prevents duplicate prints.
=
request.security(syminfo.tickerid, i_tf, detectLogic())
var int lastBullTime = 0
var int lastBearTime = 0
if mtf_isBull and mtf_bullTime != lastBullTime
lastBullTime := mtf_bullTime
if mtf_isBear and mtf_bearTime != lastBearTime
lastBearTime := mtf_bearTime
3) OB overlap validation and mitigation
Overlap is checked before pushing a new zone, then zones are extended and removed once mitigated by close.
method hasOverlap(array OBs, float top, float bottom) =>
bool overlap = false
if OBs.size() > 0
for i = 0 to OBs.size() - 1
OB item = OBs.get(i)
if (top < item.top and top > item.bottom) or (bottom > item.bottom and bottom < item.top)
overlap := true
break
overlap
method isMitigated(OB this, float currentClose) =>
this.isBull ? (currentClose < this.bottom) : (currentClose > this.top)
4) Market Structure: pivots, BOS, and MSS
Swings are derived from pivots; then BOS/MSS prints when price crosses the latest swing. The script tracks trend state to decide whether the break is continuation (BOS) or shift (MSS).
float ph = ta.pivothigh(i_structLen, i_structLen)
float pl = ta.pivotlow(i_structLen, i_structLen)
bool brokenHigh = ta.crossover(close, lastHigh)
bool brokenLow = ta.crossunder(close, lastLow)
// drawStructure(..., "BOS", ...) or drawStructure(..., "MSS", ...) depending on trend state
5) SMT Divergence conditions
SMT uses pivot highs/lows on both instruments. A bearish SMT prints when the main chart makes a higher high but the compare symbol fails to exceed its prior high. A bullish SMT prints when the main chart makes a lower low but the compare symbol fails to make a lower low.
bool bearishSmt = not na(smtAHighPrev) and not na(smtBHighPrev) and (smtAHighLast > smtAHighPrev) and (smtBHighLast <= smtBHighPrev)
bool bullishSmt = not na(smtALowPrev) and not na(smtBLowPrev) and (smtALowLast < smtALowPrev) and (smtBLowLast >= smtBLowPrev)
6) FVG detection, BPR construction, and CE level
FVGs are detected via a classic 3 bar gap condition. When a new FVG overlaps an opposing FVG, the script builds a BPR using the intersecting region. CE is the midpoint (top + bottom) / 2, plotted as a dashed line plus a half fill box.
bool fvgBullDetected = low > high
bool fvgBearDetected = high < low
// CE
float ceLevel = (this.top + this.bottom) / 2
Imbalance mitigation uses wick logic:
method isMitigated(FVG this, float currentHigh, float currentLow) =>
this.isBull ? (currentLow < this.bottom) : (currentHigh > this.top)
7) Liquidity sweep trigger
A sweep is confirmed only when price runs the pivot level and closes back through it (reject style).
bool sweepBull = i_showLiq and not na(liqLastLow) and not liqLastLowSwept and low < liqLastLow and close > liqLastLow
bool sweepBear = i_showLiq and not na(liqLastHigh) and not liqLastHighSwept and high > liqLastHigh and close < liqLastHigh
8) Killzone session mapping
Sessions are defined in UTC-5 using time() session strings.
string kzTz = "UTC-5"
kzInSession(string sess) =>
not na(time(timeframe.period, sess, kzTz))
bool inAsian = kzInSession("2000-0000")
bool inLondon = kzInSession("0200-0500")
bool inNY = kzInSession("0830-1100")

Ultimate Institutional Order Flow Pro [Pointalgo]Ultimate Institutional Order Flow (UIOF Pro)
Ultimate Institutional Order Flow (UIOF Pro) is a multi-component market analysis indicator designed to study order flow behavior, liquidity interaction, volatility structure, and session-based participation.
It integrates several commonly used market structure and order-flow concepts into a single visual framework.
This script focuses on context and alignment, not on isolated signals.
Core Objective
The indicator aims to identify areas where price, volume, liquidity, and structure appear aligned in the same direction.
It does this by combining:
VWAP behavior
Volume participation
Cumulative delta analysis
Liquidity pool interaction
Order blocks and fair value gaps
Market structure shifts
Session and higher-timeframe confirmation
VWAP & Volatility Framework
Calculates VWAP using session, weekly, or monthly anchors.
Optional VWAP standard-deviation bands visualize price dispersion.
VWAP slope and price position are used to classify directional bias.
VWAP is treated as a dynamic equilibrium reference rather than a signal.
Cumulative Volume Delta (CVD)
Estimates buy and sell pressure based on intrabar price movement.
Tracks cumulative delta and a smoothed delta average.
Uses delta change normalization to highlight abnormal activity.
Detects potential delta divergences when price and participation differ.
CVD is used to assess whether participation supports or contradicts price movement.
Liquidity Zones & Sweeps
Identifies recent swing highs and lows as potential liquidity pools.
Tracks buy-side and sell-side liquidity areas.
Flags conditions where price sweeps liquidity beyond recent extremes.
Liquidity interaction is treated as context, not prediction.
Order Blocks
1. Detects potential bullish and bearish order blocks using:
Candle structure
Volatility thresholds
Volume confirmation
2.Highlights areas where strong participation followed opposing price movement.
Order blocks are visual reference zones and do not imply guaranteed reactions.
Fair Value Gaps (FVG)
Identifies imbalance zones where price moves without overlapping structure.
Filters gaps using ATR-based size conditions.
Visual shading is used to highlight imbalance areas.
These zones may represent inefficient price movement requiring further interaction.
Volume Profile & Point of Control (POC)
Builds a simplified volume profile over a configurable lookback window.
Determines the price level with the highest traded volume (POC).
POC is used as a reference for acceptance or rejection behavior.
Market Structure
Evaluates recent highs and lows to identify structure breaks.
Classifies directional structure as bullish, bearish, or neutral.
Structure is used as a directional filter rather than a trigger.
Multi-Timeframe Confirmation
Optional higher-timeframe confirmation aligns lower-timeframe behavior with broader context.
Prevents analysis from relying on isolated timeframe conditions.
Session Filtering
1. Allows analysis to be limited to specific trading sessions.
2. Helps reduce signals during low-participation periods.
3. Session logic affects signal eligibility, not calculations.
Signal Logic
Signals are generated only when multiple independent conditions align, including:
Liquidity interaction
Order block presence
VWAP bias
Delta confirmation
Structure alignment
Volume participation
Optional higher-timeframe confirmation
Active trading session
Strong continuation conditions are also highlighted when price, volume, and participation remain aligned.
Signals represent confluence states, not trade instructions.
Dashboard Summary
A real-time dashboard summarizes:
VWAP bias and slope
CVD strength and direction
Delta behavior
Market structure state
Higher-timeframe context
Volume conditions
Liquidity pool counts
Session activity
This provides a high-level snapshot of market conditions without manual calculation.
Alerts are available for:
Institutional alignment conditions
Strong continuation pressure
Liquidity sweeps
Delta divergences
Alerts are informational and reflect internal indicator states only.
Usage Notes
Designed for analytical interpretation and market study.
Best used alongside price action and risk management methods.
Performance depends on instrument liquidity and volume quality.
All visual elements can be individually enabled or disabled.
Disclaimer
This script is provided for educational and analytical purposes only.
It does not provide financial, investment, or trading advice.
All outputs should be independently verified before making trading decisions.

Harmonic Patterns (Experimental) [Kodexius]Harmonic Patterns (Experimental) is a multi pattern harmonic geometry scanner that automatically detects, validates, and draws classic harmonic structures directly on your chart. The script continuously builds a pivot map (swing highs and swing lows), then evaluates the most recent pivot sequence against a library of harmonic ratio templates such as Gartley, Bat, Deep Bat, Butterfly, Crab, Deep Crab, Cypher, Shark, Alt Shark, 5-0, AB=CD, and 3 Drives.
Unlike simple “pattern exists / pattern doesn’t exist” indicators, this version scores candidates by accuracy . Each pattern includes “ideal” ratio targets, and the script computes a total error score by measuring how far the observed ratios deviate from the ideal. When multiple patterns could match the same pivot structure, the script selects the best match (lowest total error) and displays that one. This reduces clutter and makes the output more practical in real market conditions where many ratio ranges overlap.
The end result is a clean, information rich visualization of harmonic opportunities that is:
-Pivot based and swing aware
-Ratio validated with configurable tolerance
-Direction filtered (bullish, bearish, or both)
-Ranked by accuracy to prefer higher quality matches
Note: This is an experimental pattern engine intended for research, confluence and chart study. Harmonic patterns are probabilistic and can fail often. Always combine with your own risk management and confirmation tools.
🔹 Features
🔸Pivot Detection
The script uses pivot functions to detect structural turning points:
-Pivot Left Bars controls how many bars must exist on the left of the pivot
-Pivot Right Bars controls confirmation delay on the right (smaller value reacts faster)
Additionally, a Min Swing Distance (%) filter can ignore tiny swings to reduce noise. Pivots are stored separately for highs and lows and capped by Max Pivots to Store to keep the script efficient.
🔸Pattern Library (XABCD and Beyond)
Supported structures include:
-Gartley, Bat, Deep Bat, Butterfly, Crab, Deep Crab
-Cypher (uses XC extension and CD retracement logic)
-Shark and Alt Shark (0-X-A-B-C mapping)
-5-0 (AB and BC extensions with CD retracement)
-AB=CD (symmetry and proportionality checks)
-3 Drives (6 point structure, drive and retracement ratios)
Each pattern is defined by ratio ranges and also “ideal” ratio targets used for scoring.
🔸 Pattern Fibonacci Rules (Detailed Ratio Definitions)
This script validates each harmonic template by measuring a small set of Fibonacci relationships between the legs of the pattern. All measurements are computed using absolute price distance (so the ratios are direction independent), and then a directional sanity check ensures the geometry is positioned correctly for bullish or bearish cases.
How ratios are measured
Most patterns in this script use the standard X A B C D harmonic structure. Four ratios are evaluated:
1) XB retracement of XA
This measures how much price retraces from A back toward X when forming point B .
xbRatio = |B - A| / |A - X|
2) AC retracement of AB
This measures how much point C retraces the AB leg.
acRatio = |C - B| / |B - A|
3) BD extension of BC
This measures the “drive” from C into D relative to the BC leg.
bdRatio = |D - C| / |C - B|
4) XD retracement of XA
This is the most important “completion” ratio in many patterns. It measures where D lands relative to the original XA swing.
xdRatio = |D - A| / |A - X|
Important: the script applies a user defined Fibonacci Tolerance to each accepted range, meaning the pattern can still pass even if ratios are slightly off from the textbook values.
🔸 XABCD Pattern Ratio Templates
Below are the exact ratio rules used by the templates in this script.
Gartley
-XB must be ~0.618 of XA
-AC must be between 0.382 and 0.886 of AB
-BD must be between 1.272 and 1.618 extension of BC
-XD must be ~0.786 of XA
In practice, Gartley is a “non extension” structure, meaning D usually remains inside the X boundary .
Bat
-XB between 0.382 and 0.50 of XA
-AC between 0.382 and 0.886 of AB
-BD between 1.618 and 2.618 of BC
-XD ~0.886 of XA
Bat patterns typically complete deeper than Gartley and often create a sharper reaction at D.
Deep Bat
-XB ~0.886 of XA
-AC between 0.382 and 0.886 of AB
-BD between 1.618 and 2.618 of BC
-XD ~0.886 of XA
Deep Bat uses the same completion zone as Bat, but requires a much deeper B point.
Butterfly
-XB ~0.786 of XA
-AC between 0.382 and 0.886 of AB
-BD between 1.618 and 2.618 of BC
-XD between 1.272 and 1.618 of XA
Butterfly is an extension pattern . That means D is expected to break beyond X (in the completion direction).
Crab
-XB between 0.382 and 0.618 of XA
-AC between 0.382 and 0.886 of AB
-BD between 2.24 and 3.618 of BC
-XD ~1.618 of XA
Crab is also an extension pattern . It often produces a very deep D completion and a strong reaction zone.
Deep Crab
-XB ~0.886 of XA
-AC between 0.382 and 0.886 of AB
-BD between 2.0 and 3.618 of BC
-XD ~1.618 of XA
Deep Crab combines a deep B point with a strong XA extension completion.
🔸 Cypher Fibonacci Rules (XC Based)
Cypher is not validated with the same four ratios as XABCD patterns. Instead it uses an XC based completion model:
1) B as a retracement of XA
xb = |B - A| / |A - X| // AB/XA
Must be between 0.382 and 0.618 .
2) C as an extension from X relative to XA
xc = |C - X| / |A - X| // XC/XA
Must be between 1.272 and 1.414 .
3) D as a retracement of XC
xd = |D - C| / |C - X| // CD/XC
Must be ~ 0.786 .
This makes Cypher structurally different: the “completion” is defined as a retracement of the entire XC leg, not XA.
🔸 Shark and Alt Shark Fibonacci Rules (0-X-A-B-C Mapping)
Shark patterns are commonly defined as 0 X A B C . In this script the pivots are mapped like this:
0 = pX, X = pA, A = pB, B = pC, C = pD
So the final pivot (stored as pD) is labeled as C on the chart.
Three ratios are validated:
1) AB relative to XA
ab_xa = |B - A| / |A - X|
Must be between 1.13 and 1.618 .
2) BC relative to AB
bc_ab = |C - B| / |B - A|
Must be between 1.618 and 2.24 .
3) OC relative to OX
oc_ox = |C - 0| / |X - 0|
For Shark it must be between 0.886 and 1.13 .
For Alt Shark it must be between 1.13 and 1.618 (a deeper / more extended completion).
🔸 5-0 Fibonacci Rules
5-0 is validated as a sequence of extensions and then a fixed retracement:
1) AB extension of XA
ab_xa = |B - A| / |A - X|
Must be between 1.13 and 1.618 .
2) BC extension of AB
bc_ab = |C - B| / |B - A|
Must be between 1.618 and 2.24 .
3) CD retracement of BC
cd_bc = |D - C| / |C - B|
Must be approximately 0.50 .
Note that for 5-0 the script does not rely on an XA completion ratio like 0.786 or 1.618. The defining completion is the 0.5 retracement of BC.
🔸 AB=CD Fibonacci Rules
AB=CD is a symmetry pattern and is treated differently from the harmonic templates:
1) AB and CD length symmetry
The script checks if CD is approximately equal to AB within tolerance.
2) BC proportion
BC/AB is expected to fall in a common Fibonacci retracement zone:
-approximately 0.618 to 0.786 (with a looser tolerance in code)
3) CD/BC expansion
CD/BC is expected to be an expansion ratio:
-approximately 1.272 to 1.618 (also with a looser tolerance)
This allows the script to capture both classic equal leg AB=CD and common “expanded” variations.
🔸 3 Drives Fibonacci Rules (6 Point Structure)
3 Drives is a 6 point structure and is validated using retracement ratios and extension ratios:
Retracement rules
Retracement 1 must be between 0.618 and 0.786 of Drive 1
Retracement 2 must be between 0.618 and 0.786 of Drive 2
Extension rules
Drive 2 must be between 1.272 and 1.618 of Retracement 1
Drive 3 must be between 1.272 and 1.618 of Retracement 2
This pattern is meant to capture rhythm and proportional repetition rather than a single XA completion ratio.
🔸 Why the script can show “ratio labels” on legs
If you enable Show Fibonacci Values on Legs , the script prints the measured ratios near the midpoint of each leg (or diagonal, depending on pattern type). This makes it easy to visually confirm:
-Which ratios caused the pattern to pass
-How close the structure is to ideal harmonic values
-Why one template was preferred over another via the accuracy score
🔸 Fibonacci Tolerance Control
All ratio checks use a single tolerance input (percentage). This tolerance expands or contracts the acceptable ratio ranges, letting you decide whether you want:
-Tight, high precision matches (lower tolerance)
-Broader, more frequent matches (higher tolerance)
🔸 Direction Filter (Bullish Only / Bearish Only / Both)
You can restrict scanning to bullish patterns, bearish patterns, or allow both. This is useful if you are aligning with higher timeframe bias or only trading one side of the market.
🔸 Best Match Selection (Anti Clutter Logic)
When a new pivot confirms, the script evaluates all enabled patterns against the latest pivot sequence and keeps the one with the smallest total error score. This is especially helpful because many harmonic templates overlap in real time. Instead of drawing multiple conflicting labels, you get one “most accurate” candidate.
🔸 Clean Visual Rendering and Optional Details
The drawing system can display:
-Main structure lines (X-A-B-C-D or special mappings)
-Dashed diagonals for geometric context (XB, AC, BD, XD)
-Pattern fill to visually highlight the structure zone
-Point labels (X,A,B,C,D or 0..5 for 3 Drives, 0-X-A-B-C for Shark)
-Leg Fibonacci labels placed around midpoints for fast ratio reading
All colors (bullish and bearish line and fill) are configurable.
🔸 Pattern Spacing and Display Limits
To keep charts readable, the script includes:
-Max Patterns to Display to limit on-chart drawings
-Min Bars Between Patterns to avoid repeated signals too close together in the same direction
Older patterns are automatically deleted once the display limit is exceeded.
🔸 Alerts
When enabled, alerts trigger on new confirmed detections:
-Bullish Pattern Detected
-Bearish Pattern Detected
Alerts fire once per bar when a new pattern is confirmed by a fresh pivot.
🔹 Calculations
This section summarizes the core logic used under the hood.
1) Pivot Detection and Swing Filtering
The script confirms pivots using right side confirmation, then optionally filters them by minimum swing distance relative to the last opposite pivot.
// Pivot detection
float pHigh = ta.pivothigh(high, pivotLeftBars, pivotRightBars)
float pLow = ta.pivotlow(low, pivotLeftBars, pivotRightBars)
// Example swing distance filter (conceptual)
abs(newPivot - lastOppPivot) / lastOppPivot >= minSwingPercent
Pivots are stored in capped arrays (high pivots and low pivots), ensuring performance and stable memory usage.
2) Ratio Measurements (Retracement and Extension)
The engine measures harmonic ratios using two core helpers:
Retracement measures how much the third point retraces the previous leg.
Extension measures how much the next leg extends relative to the previous leg.
// Retracement: (p3 - p2) compared to (p2 - p1)
calcRetracement(p1, p2, p3) =>
float leg = math.abs(p2.price - p1.price)
float retr = math.abs(p3.price - p2.price)
leg != 0 ? retr / leg : na
// Extension: (p4 - p3) compared to (p3 - p2)
calcExtension(p2, p3, p4) =>
float leg = math.abs(p3.price - p2.price)
float ext = math.abs(p4.price - p3.price)
leg != 0 ? ext / leg : na
For a standard XABCD pattern the script evaluates:
-XB retracement of XA
-AC retracement of AB
-BD extension of BC
-XD retracement of XA
3) Tolerance Based Range Check
Ratio validation uses a flexible range check that expands min and max by the tolerance percent:
isInRange(value, minVal, maxVal, tolerance) =>
float tolMin = minVal * (1.0 - tolerance)
float tolMax = maxVal * (1.0 + tolerance)
value >= tolMin and value <= tolMax
This means even “fixed” ratios (like 0.786) still allow a user controlled deviation.
4) Positional Sanity Check for D (Beyond X or Not)
Some harmonic patterns require D to remain within X (non extension patterns), while others require D to break beyond X (extension patterns). The script enforces that using a boolean flag in each template.
Conceptually:
-If the pattern is an extension type, D should cross beyond X in the expected direction
-If the pattern is not extension type, D should stay on the correct side of X
This prevents visually incorrect “ratio matches” that violate the intended geometry.
5) Template Definitions (Ranges + Ideal Targets)
Every pattern includes ratio ranges plus ideal values. The ideal values are used only for scoring quality, not for pass/fail. Example concept:
-Ranges determine validity
-Ideal targets determine ranking
6) Accuracy Scoring (Total Error)
When a candidate passes all validity checks, the script computes an accuracy score by summing absolute deviations from ideal ratios:
calcError(value, ideal) =>
math.abs(value - ideal)
// Total error is the sum of the four leg errors (as available for the pattern)
totalError =
calcError(xbRatio, xbIdeal) +
calcError(acRatio, acIdeal) +
calcError(bdRatio, bdIdeal) +
calcError(xdRatio, xdIdeal)
Lower score means closer to the “textbook” harmonic proportions.
7) Best Match Resolution (Choosing One Winner)
When multiple enabled patterns match the same pivot structure, the script selects the one with the lowest totalError:
updateBest(currentBest, newCandidate) =>
result = currentBest
if not na(newCandidate)
if na(currentBest) or newCandidate.totalError < currentBest.totalError
result := newCandidate
result
This is a major practical feature because it reduces clutter and highlights the highest quality interpretation.
8) Bullish and Bearish Scanning Logic
The scanner runs when pivots confirm:
-Bullish patterns are evaluated on a newly confirmed pivot low (potential D)
-Bearish patterns are evaluated on a newly confirmed pivot high (potential D)
From that D pivot, the script searches backward through stored pivots to build a valid pivot sequence (X,A,B,C,D). If 3 Drives is enabled, it also attempts to find the extra preceding point needed for the 6 point structure.
9) Rendering: Lines, Fill, Labels, and Leg Fib Text
After detection the script draws:
-Primary legs with thicker lines
-Geometric diagonals with dashed lines (for XABCD types)
-Optional fill between selected legs to emphasize the structure area
-A summary label showing direction, pattern name, and ratios
-Optional point labels and leg ratio labels placed near midpoints
To avoid overlapping with candles, the script offsets labels using ATR:
float yOff = math.max(ta.atr(14) * 0.15, syminfo.mintick * 10)
10) Pattern Lifecycle and Cleanup
To respect chart limits and keep visuals clean, the script deletes old drawings once the maximum visible patterns threshold is exceeded. This includes lines, fills, and labels.

VMDM - Volume, Momentum & Divergence Master [BullByte]VMDM - Volume, Momentum and Divergence Master
Educational Multi-Layer Market Structure Analysis System
Multi-factor divergence engine that scores RSI momentum, volume pressure, and institutional footprints into one non-repainting confluence rating (0-100).
WHAT THIS INDICATOR IS
VMDM is an educational indicator designed to teach traders how to recognize high-probability reversal and continuation patterns by analyzing four independent market dimensions simultaneously. Instead of relying on a single indicator that may produce frequent false signals, VMDM creates a confluence-based scoring system that weights multiple confirmation factors, helping you understand which setups have stronger technical backing and which are lower quality.
This is NOT a trading system or signal generator. It is a learning tool that visualizes complex market structure concepts in an accessible format for both coders and non-coders.
THE PROBLEM IT SOLVES
Most traders face these common challenges:
Challenge 1 - Indicator Overload: Running RSI, volume analysis, and divergence detection separately creates chart clutter and conflicting signals. You waste time cross-referencing multiple windows trying to determine if all factors align.
Challenge 2 - False Divergences: Standard divergence indicators trigger on every minor pivot, creating noise. Many divergences fail because they lack supporting evidence from volume or market structure.
Challenge 3 - Missed Context: A bullish RSI divergence means nothing if it occurs during weak volume or in the middle of strong distribution. Context determines quality.
Challenge 4 - Repainting Confusion: Many divergence scripts repaint, showing perfect historical signals that never actually triggered in real-time, leading to false confidence.
Challenge 5 - Institutional Pattern Recognition: Absorption zones, stop hunts, and exhaustion patterns are taught in trading education but difficult to identify systematically without manual analysis.
VMDM addresses all five challenges by combining complementary analytical layers into one transparent, non-repainting, confluence-weighted system with visual clarity.
WHY THIS SPECIFIC COMBINATION - MASHUP JUSTIFICATION
This indicator is NOT a random mashup of popular indicators. Each of the four layers serves a specific analytical purpose and together they create a complete market structure assessment framework.
THE FOUR ANALYTICAL LAYERS
LAYER 1 - RSI MOMENTUM DIVERGENCE (Trend Exhaustion Detection)
Purpose: Identifies when price momentum is weakening before price itself reverses.
Why RSI: The Relative Strength Index measures momentum on a bounded 0-100 scale, making divergence detection mathematically consistent across all assets and timeframes. Unlike raw price oscillators, RSI normalizes momentum regardless of volatility regime.
How It Contributes: Divergence between price pivots and RSI pivots reveals early momentum exhaustion. A lower price low with a higher RSI low (bullish regular divergence) signals sellers are losing strength even as price makes new lows. This is the PRIMARY signal generator in VMDM.
Limitation If Used Alone: RSI divergence by itself produces many false signals because momentum can remain weak during continued trends. It needs confirmation from volume and structural evidence.
LAYER 2 - VOLUME PRESSURE ANALYSIS (Buying vs Selling Intensity)
Purpose: Quantifies whether the current bar's volume reflects buying pressure or selling pressure based on where price closed within the bar's range.
Methodology: Instead of just measuring volume size, VMDM calculates WHERE in the bar range the close occurred. A close near the high on high volume indicates strong buying absorption. A close near the low indicates selling pressure. The calculation accounts for wick size (wicks reduce pressure quality) and uses percentile ranking over a lookback period to normalize pressure strength on a 0-100 scale.
Formula Concept:
Buy Pressure = Volume × (Close - Low) / (High - Low) × Wick Quality Factor
Sell Pressure = Volume × (High - Close) / (High - Low) × Wick Quality Factor
Net Pressure = Buy Pressure - Sell Pressure
Pressure Strength = Percentile Rank of Net Pressure over lookback period
Why Percentile Ranking: Absolute volume varies by asset and session. Percentile ranking makes 85th percentile pressure on low-volume crypto comparable to 85th percentile pressure on high-volume forex.
How It Contributes: When a bullish divergence occurs at a pivot low AND pressure strength is above 60 (strong buying), this adds 25 confluence points. It confirms that the divergence is occurring during actual accumulation, not just weak selling.
Limitation If Used Alone: Pressure analysis shows current bar intensity but cannot identify trend exhaustion or reversal timing. High buying pressure can exist during a strong uptrend with no reversal imminent.
LAYER 3 - BEHAVIORAL FOOTPRINT PATTERNS (Volume Anomaly Detection)
CRITICAL DISCLAIMER: The terms "institutional footprint," "absorption," "stop hunt," and "exhaustion" used in this indicator are EDUCATIONAL LABELS for specific price and volume behavioral patterns. These patterns are detected through technical analysis of publicly available price, volume, and bar structure data. This indicator does NOT have access to actual institutional order flow, market maker data, broker stop-loss locations, or any non-public data source. These pattern names are used because they are common terminology in trading education to describe these technical behaviors. The analysis is interpretive and based on observable price action, not privileged information.
Purpose: Detect volume anomalies and price patterns that historically correlate with potential reversal zones or trend continuation failure.
Pattern Type 1 - Absorption (Labeled as "ACCUMULATION" or "DISTRIBUTION")
Detection Criteria: Volume is more than 2x the moving average AND bar range is less than 50 percent of the average bar range.
Interpretation: High volume compressed into a tight range suggests large participants are absorbing supply (accumulation) or distribution (distribution) without allowing price to move significantly. This often precedes directional moves once absorption completes.
Visual: Colored box zone highlighting the absorption area.
Pattern Type 2 - Stop Hunt (Labeled as "BULL HUNT" or "BEAR HUNT")
Detection Criteria: Price penetrates a recent 10-bar high or low by a small margin (0.2 percent), then closes back inside the range on above-average volume (1.5x+).
Interpretation: Price briefly spikes beyond recent structure (likely triggering stop losses placed just beyond obvious levels) then reverses. This is a classic false breakout pattern often seen before reversals.
Visual: Label at the wick extreme showing hunt direction.
Pattern Type 3 - Exhaustion (Labeled as "SELL EXHAUST" or "BUY EXHAUST")
Detection Criteria: Lower wick is more than 2.5x the body size with volume above 1.8x average and RSI below 35 (sell exhaustion), OR upper wick more than 2.5x body size with volume above 1.8x average and RSI above 65 (buy exhaustion).
Interpretation: Large wicks with high volume and extreme RSI suggest aggressive buying or selling was met with equally aggressive rejection. This exhaustion often marks short-term extremes.
Visual: Label showing exhaustion type.
How These Contribute: When a divergence forms at a pivot AND one of these behavioral patterns is active, the confluence score increases by 20 points. This confirms the divergence is occurring during structural anomaly activity, not just normal price flow.
Limitation If Used Alone: These patterns can occur mid-trend and do not indicate direction without momentum context. Absorption in a strong uptrend may just be continuation accumulation.
LAYER 4 - CONFLUENCE SCORING MATRIX (Quality Weighting System)
Purpose: Translate all detected conditions into a single 0-100 quality score so you can objectively compare setups.
Scoring Breakdown:
Divergence Present: +30 points (primary signal)
Pressure Confirmation: +25 points (volume supports direction)
Behavioral Footprint Active: +20 points (structural anomaly present)
RSI Extreme: +15 points (RSI below 30 or above 70 at pivot)
Volume Spike: +10 points (current volume above 1.5x average)
Maximum Possible Score: 100 points
Why These Weights: The weights reflect reliability hierarchy based on backtesting observation. Divergence is the core signal (30 points), but without volume confirmation (25 points) many fail. Behavioral patterns add meaningful context (20 points). RSI extremes and volume spikes are secondary confirmations (15 and 10 points).
Quality Tiers:
90-100: TEXTBOOK (all factors aligned)
75-89: HIGH QUALITY (strong confluence)
60-74: VALID (meets minimum threshold)
Below 60: DEVELOPING (not displayed unless threshold lowered)
How It Contributes: The confluence score allows you to filter noise. You can set your minimum quality threshold in settings. Higher thresholds (75+) show fewer but higher-quality patterns. Lower thresholds (50-60) show more patterns but include lower-confidence setups. This teaches you to distinguish strong setups from weak ones.
Limitation: Confluence scoring is historical observation-based, not predictive guarantee. A 95-point setup can still fail. The score represents technical alignment, not future certainty.
WHY THIS COMBINATION WORKS TOGETHER
Each layer addresses a limitation in the others:
RSI Divergence identifies WHEN momentum is exhausting (timing)
Volume Pressure confirms WHETHER the exhaustion is accompanied by opposite-side accumulation (confirmation)
Behavioral Footprint shows IF structural anomalies support the reversal hypothesis (context)
Confluence Scoring weights ALL factors into an objective quality metric (filtering)
Using only RSI divergence gives you timing without confirmation. Using only volume pressure gives you intensity without directional context. Using only pattern detection gives you anomalies without trend exhaustion context. Using all four together creates a complete analytical framework where each layer compensates for the others' weaknesses.
This is not a mashup for the sake of combining indicators. It is a structured analytical system where each component has a defined role in a multi-dimensional market assessment process.
HOW TO READ THE INDICATOR - VISUAL ELEMENTS GUIDE
VMDM displays up to five visual layer types. You can enable or disable each layer independently in settings under "Visual Layers."
VISUAL LAYER 1 - MARKET STRUCTURE (Pivot Points and Lines)
What You See:
Small labels at swing highs and lows marked "PH" (Pivot High) and "PL" (Pivot Low) with horizontal dashed lines extending right from each pivot.
What It Means:
These are CONFIRMED pivots, not real-time. A pivot low appears AFTER the required right-side confirmation bars pass (default 3 bars). This creates a delay but prevents repainting. The pivot only appears once it is mathematically confirmed.
The horizontal lines represent support (from pivot lows) and resistance (from pivot highs) levels where price previously found significant rejection.
Color Coding:
Green label and line: Pivot Low (potential support)
Red label and line: Pivot High (potential resistance)
How To Use:
These pivots are the foundation for divergence detection. Divergence is only calculated between confirmed pivots, ensuring all signals are non-repainting. The lines help you see historical structure levels.
VISUAL LAYER 2 - PRESSURE ZONES (Background Color)
What You See:
Subtle background color shading on bars - light green or light red tint.
What It Means:
This visualizes volume pressure strength in real-time.
Color Coding:
Light Green Background: Pressure Strength above 70 (strong buying pressure - price closing near highs on volume)
Light Red Background: Pressure Strength below 30 (strong selling pressure - price closing near lows on volume)
No Color: Neutral pressure (pressure between 30-70)
How To Use:
When a bullish divergence pattern appears during green pressure zones, it suggests the divergence is forming during accumulation. When a bearish divergence appears during red zones, distribution is occurring. Pressure zones help you filter divergences - those forming in supportive pressure environments have higher probability.
VISUAL LAYER 3 - DIVERGENCE LINES (Dotted Connectors)
What You See:
Dotted lines connecting two pivot points (either two pivot lows or two pivot highs).
What It Means:
A divergence has been detected between those two pivots. The line connects the price pivots where RSI showed opposite behavior.
Color Coding:
Bright Green Line: Bullish divergence (regular or hidden)
Bright Red Line: Bearish divergence (regular or hidden)
How To Use:
The divergence line appears ONLY after the second pivot is confirmed (delayed by right-side confirmation bars). This is intentional to prevent repainting. When you see the line appear, it means:
For Bullish Regular Divergence:
Price made a lower low (second pivot lower than first)
RSI made a higher low (RSI at second pivot higher than first)
Interpretation: Downtrend losing momentum
For Bullish Hidden Divergence:
Price made a higher low (second pivot higher than first)
RSI made a lower low (RSI at second pivot lower than first)
Interpretation: Uptrend continuation likely (pullback within uptrend)
For Bearish Regular Divergence:
Price made a higher high (second pivot higher than first)
RSI made a lower high (RSI at second pivot lower than first)
Interpretation: Uptrend losing momentum
For Bearish Hidden Divergence:
Price made a lower high (second pivot lower than first)
RSI made a higher high (RSI at second pivot higher than first)
Interpretation: Downtrend continuation likely (bounce within downtrend)
If "Show Consolidated Analysis Label" is disabled, a small label will appear on the divergence line showing the divergence type abbreviation.
VISUAL LAYER 4 - BEHAVIORAL FOOTPRINT MARKERS
What You See:
Boxes, labels, and markers at specific bars showing pattern detection.
ABSORPTION ZONES (Boxes):
Colored rectangular boxes spanning one or more bars.
Purple Box: Accumulation absorption zone (high volume, tight range, bullish close)
Red Box: Distribution absorption zone (high volume, tight range, bearish close)
If absorption continues for multiple consecutive bars, the box extends and a counter appears in the label showing how many bars the absorption lasted.
What It Means: Large volume is being absorbed without significant price movement. This often precedes directional breakouts once the absorption phase completes.
STOP HUNT MARKERS (Labels):
Small labels below or above wicks labeled "BULL HUNT" or "BEAR HUNT" (may show bar count if consecutive).
What It Means:
BULL HUNT : Price spiked below recent lows then reversed back up on volume - likely triggered sell stops before reversing
BEAR HUNT : Price spiked above recent highs then reversed back down on volume - likely triggered buy stops before reversing
EXHAUSTION MARKERS (Labels):
Labels showing "SELL EXHAUST" or "BUY EXHAUST."
What It Means:
SELL EXHAUST : Large lower wick with high volume and low RSI - aggressive selling met with strong rejection
BUY EXHAUST : Large upper wick with high volume and high RSI - aggressive buying met with strong rejection
How To Use:
These markers help you identify WHERE structural anomalies occurred. When a divergence signal appears AT THE SAME TIME as one of these patterns, the confluence score increases. You are looking for alignment - divergence + behavioral pattern + pressure confirmation = high-quality setup.
VISUAL LAYER 5 - CONSOLIDATED ANALYSIS LABEL (Main Pattern Signal)
What You See:
A large label appearing at pivot points (or in real-time mode, at current bar) containing full pattern analysis.
Label Appearance:
Depending on your "Use Compact Label Format" setting:
COMPACT MODE (Single Line):
Example: "BULLISH REGULAR | Q:HIGH QUALITY C:82"
Breakdown:
BULLISH REGULAR: Divergence type detected
Q:HIGH QUALITY: Pattern quality tier
C:82: Confluence score (82 out of 100)
FULL MODE (Multi-Line Detailed):
Example:
PATTERN DETECTED
-------------------
BULLISH REGULAR
Quality: HIGH QUALITY
Price: Lower Low
Momentum: Higher Low
Signal: Weakening Downtrend
CONFLUENCE: 82/100
-------------------
Divergence: 30
Pressure: 25
Institutional: 20
RSI Extreme: 0
Volume: 10
Breakdown:
Top section: Pattern type and quality
Middle section: Divergence explanation (what price did vs what RSI did)
Bottom section: Confluence score with itemized breakdown showing which factors contributed
Label Position:
In Confirmed modes: Label appears AT the pivot point (delayed by confirmation bars)
In Real-time mode: Label appears at current bar as conditions develop
Label Color:
Gold: Textbook quality (90+ confluence)
Green: High quality (75-89 confluence)
Blue: Valid quality (60-74 confluence)
How To Use:
This is your primary decision-making label. When it appears:
Check the divergence type (regular divergences are reversal signals, hidden divergences are continuation signals)
Review the quality tier (textbook and high quality have better historical win rates)
Examine the confluence breakdown to see which factors are present and which are missing
Look at the chart context (trend, support/resistance, timeframe)
Use this information to assess whether the setup aligns with your strategy
The label does NOT tell you to buy or sell. It tells you a technical pattern has formed and provides the quality assessment. Your trading decision must incorporate risk management, market context, and your strategy rules.
UNDERSTANDING THE THREE DETECTION MODES
VMDM offers three signal detection modes in settings to accommodate different trading styles and learning objectives.
MODE 1: "Confluence Only (Real-Time)"
How It Works: Displays signals AS THEY DEVELOP on the current bar without waiting for pivot confirmation. The system calculates confluence score from pressure, volume, RSI extremes, and behavioral patterns. Divergence signals are NOT required in this mode.
Delay: ZERO - signals appear immediately.
Use Case: Real-time scanning for high-confluence zones without divergence requirement. Useful for intraday traders who want immediate alerts when multiple factors align.
Tradeoff: More frequent signals but includes setups without confirmed divergence. Higher false signal rate. Signals can change as the bar develops (not repainting in historical bars, but current bar updates).
Visual Behavior: Labels appear at the current bar. No divergence lines unless divergence happens to be present.
MODE 2: "Divergence + Confluence (Confirmed)" - DEFAULT RECOMMENDED
How It Works: Full system engagement. Signals appear ONLY when:
A pivot is confirmed (requires right-side confirmation bars to pass)
Divergence is detected between current pivot and previous pivot
Total confluence score meets or exceeds your minimum threshold
Delay: Equal to your "Pivot Right Bars" setting (default 3 bars). This means signals appear 3 bars AFTER the actual pivot formed.
Use Case: Highest-quality, non-repainting signals for swing traders and learners who want to study confirmed pattern completion.
Tradeoff: Delayed signals. You will not receive the signal until confirmation occurs. In fast-moving markets, price may have already moved significantly by the time the signal appears.
Visual Behavior: Labels appear at the historical pivot location (in the past). Divergence lines connect the two pivots. This is the most educational mode because it shows completed, confirmed patterns.
Non-Repainting Guarantee: Yes. Once a signal appears, it never disappears or changes.
MODE 3: "Divergence + Confluence (Relaxed)"
How It Works: Same as Confirmed mode but with adaptive thresholds. If confluence is very high (10 points above threshold), the signal may appear even if some factors are weak. If divergence is present but confluence is slightly below threshold (within 10 points), it may still appear.
Delay: Same as Confirmed mode (right-side confirmation bars).
Use Case: Slightly more signals than Confirmed mode for traders willing to accept near-threshold setups.
Tradeoff: More signals but lower average quality than Confirmed mode.
Visual Behavior: Same as Confirmed mode.
DASHBOARD GUIDE - READING THE METRICS
The dashboard appears in the corner of your chart (position selectable in settings) and provides real-time market state analysis.
You can choose between four dashboard detail levels in settings: Off, Compact, Optimized (default), Full.
DASHBOARD ROW EXPLANATIONS
ROW 1 - Header Information
Left: Current symbol and timeframe
Center: "VMDM "
Right: Version number
ROW 2 - Mode and Delay
Shows which detection mode you are using and the signal delay.
Example: "CONFIRMED | Delay: 3 bars"
This reminds you that signals in confirmed mode appear 3 bars after the pivot forms.
ROW 3 - Market Regime
Format: "TREND UP HV" or "RANGING NV"
First Part - Trend State:
TREND UP: 20 EMA above 50 EMA with strong separation
TREND DOWN: 20 EMA below 50 EMA with strong separation
RANGING: EMAs close together, low trend strength
TRANSITION: Between trending and ranging states
Second Part - Volatility State:
HV: High Volatility (current ATR more than 1.3x the 50-bar average ATR)
NV: Normal Volatility (current ATR between 0.7x and 1.3x average)
LV: Low Volatility (current ATR less than 0.7x average)
Third Column: Volatility ratio (example: "1.45x" means current ATR is 1.45 times normal)
How To Use: Regime context helps you interpret signals. Reversal divergences are more reliable in ranging or transitional regimes. Continuation divergences (hidden) are more reliable in trending regimes. High volatility means wider stops may be needed.
ROW 4 - Pressure
Shows current volume pressure state.
Format: "BUYING | ██████████░░░░░░░░░"
States:
BUYING : Pressure strength above 60 (closes near highs)
SELLING : Pressure strength below 40 (closes near lows)
NEUTRAL : Pressure strength between 40-60
Bar Visualization: Each block represents 10 percentile points. A full bar (10 filled blocks) = 100th percentile pressure.
Color: Green for buying, red for selling, gray for neutral.
How To Use: When pressure aligns with divergence direction (bullish divergence during buying pressure), confluence is stronger.
ROW 5 - Volume and RSI
Format: "1.8x | RSI 68 | OB"
First Value: Current volume ratio (1.8x = volume is 1.8 times the moving average)
Second Value: Current RSI reading
Third Value: RSI state
OB: Overbought (RSI above 70)
OS: Oversold (RSI below 30)
Blank: Neutral RSI
How To Use: Volume spikes (above 1.5x) during divergence formation add confluence. RSI extremes at pivots add confluence.
ROW 6 - Behavioral Footprint
Format: "BULL HUNT | 2 bars"
Shows the most recent behavioral pattern detected and how long ago.
States:
ACCUMULATION / DISTRIBUTION: Absorption detected
BULL HUNT / BEAR HUNT: Stop hunt detected
SELL EXHAUST / BUY EXHAUST: Exhaustion detected
SCANNING: No recent pattern
NOW: Pattern is active on current bar
How To Use: When footprint activity is recent (within 50 bars) or active now, it adds context to divergence signals forming in that area.
ROW 7 - Current Pattern
Shows the divergence type currently detected (if any).
Examples: "BULLISH REGULAR", "BEARISH HIDDEN", "Scanning..."
Quality: Shows pattern quality (TEXTBOOK, HIGH QUALITY, VALID)
How To Use: This tells you what type of signal is active. Regular divergences are reversal setups. Hidden divergences are continuation setups.
ROW 8 - Session Summary
Format: "14 events | A3 H8 E3"
First Value: Total institutional events this session
Breakdown:
A: Absorption events
H: Stop hunt events
E: Exhaustion events
How To Use: High event counts suggest an active, volatile session with frequent structural anomalies. Low counts suggest quiet, orderly price action.
ROW 9 - Confluence Score (Optimized/Full mode only)
Format: "78/100 | ████████░░"
Shows current real-time confluence score even if no pattern is confirmed yet.
How To Use: Watch this in real-time to see how close you are to pattern formation. When it exceeds your threshold and divergence forms, a signal will appear (after confirmation delay).
ROW 10 - Patterns Studied (Optimized/Full mode only)
Format: "47 patterns | 12 bars ago"
First Value: Total confirmed patterns detected since chart loaded
Second Value: How many bars since the last confirmed pattern appeared
How To Use: Helps you understand pattern frequency on your selected symbol and timeframe. If many bars have passed since last pattern, market may be trending without reversal opportunities.
ROW 11 - Bull/Bear Ratio (Optimized/Full mode only)
Format: "28:19 | BULL"
Shows count of bullish vs bearish patterns detected.
Balance:
BULL: More bullish patterns detected (suggests market has had more bullish reversals/continuations)
BEAR: More bearish patterns detected
BAL: Equal counts
How To Use: Extreme imbalances can indicate directional bias in the studied period. A heavily bullish ratio in a downtrend might suggest frequent failed rallies (bearish continuation). Context matters.
ROW 12 - Volume Ratio Detail (Optimized/Full mode only)
Shows current volume vs average volume in absolute terms.
Example: "1.4x | 45230 / 32300"
How To Use: Confirms whether current activity is above or below normal.
ROW 13 - Last Institutional Event (Full mode only)
Shows the most recent institutional pattern type and how many bars ago it occurred.
Example: "DISTRIBUTION | 23 bars"
How To Use: Tracks recency of last anomaly for context.
SETTINGS GUIDE - EVERY PARAMETER EXPLAINED
PERFORMANCE SECTION
Enable All Visuals (Master Toggle)
Default: ON
What It Does: Master kill switch for ALL visual elements (labels, lines, boxes, background colors, dashboard). When OFF, only plot outputs remain (invisible unless you open data window).
When To Change: Turn OFF on mobile devices, 1-second charts, or slow computers to improve performance. You can still receive alerts even with visuals disabled.
Impact: Dramatic performance improvement when OFF, but you lose all visual feedback.
Maximum Object History
Default: 50 | Range: 10-100
What It Does: Limits how many of each object type (labels, lines, boxes) are kept in memory. Older objects beyond this limit are deleted.
When To Change: Lower to 20-30 on fast timeframes (1-minute charts) to prevent slowdown. Increase to 100 on daily charts if you want more historical pattern visibility.
Impact: Lower values = better performance but less historical visibility. Higher values = more history visible but potential slowdown on fast timeframes.
Alert Cooldown (Bars)
Default: 5 | Range: 1-50
What It Does: Minimum number of bars that must pass before another alert of the same type can fire. Prevents alert spam when multiple patterns form in quick succession.
When To Change: Increase to 20+ on 1-minute charts to reduce noise. Decrease to 1-2 on daily charts if you want every pattern alerted.
Impact: Higher cooldown = fewer alerts. Lower cooldown = more alerts.
USER EXPERIENCE SECTION
Show Enhanced Tooltips
Default: ON
What It Does: Enables detailed hover-over tooltips on labels and visual elements.
When To Change: Turn OFF if you encounter Pine Script compilation errors related to tooltip arguments (rare, platform-specific issue).
Impact: Minimal. Just adds helpful hover text.
MARKET STRUCTURE DETECTION SECTION
Pivot Left Bars
Default: 3 | Range: 2-10
What It Does: Number of bars to the LEFT of the center bar that must be higher (for pivot low) or lower (for pivot high) than the center bar for a pivot to be valid.
Example: With value 3, a pivot low requires the center bar's low to be lower than the 3 bars to its left.
When To Change:
Increase to 5-7 on noisy timeframes (1-minute charts) to filter insignificant pivots
Decrease to 2 on slow timeframes (daily charts) to catch more pivots
Impact: Higher values = fewer, more significant pivots = fewer signals. Lower values = more frequent pivots = more signals but more noise.
Pivot Right Bars
Default: 3 | Range: 2-10
What It Does: Number of bars to the RIGHT of the center bar that must pass for confirmation. This creates the non-repainting delay.
Example: With value 3, a pivot is confirmed 3 bars AFTER it forms.
When To Change:
Increase to 5-7 for slower, more confirmed signals (better for swing trading)
Decrease to 2 for faster signals (better for intraday, but still non-repainting)
Impact: Higher values = longer delay but more reliable confirmation. Lower values = faster signals but less confirmation. This setting directly controls your signal delay in Confirmed and Relaxed modes.
Minimum Confluence Score
Default: 60 | Range: 40-95
What It Does: The threshold score required for a pattern to be displayed. Patterns with confluence scores below this threshold are not shown.
When To Change:
Increase to 75+ if you only want high-quality textbook setups (fewer signals)
Decrease to 50-55 if you want to see more developing patterns (more signals, lower average quality)
Impact: This is your primary signal filter. Higher threshold = fewer, higher-quality signals. Lower threshold = more signals but includes weaker setups. Recommended starting point is 60-65.
TECHNICAL PERIODS SECTION
RSI Period
Default: 14 | Range: 5-50
What It Does: Lookback period for RSI calculation.
When To Change:
Decrease to 9-10 for faster, more sensitive RSI that detects shorter-term momentum changes
Increase to 21-28 for slower, smoother RSI that filters noise
Impact: Lower values make RSI more volatile (more frequent extremes and divergences). Higher values make RSI smoother (fewer but more significant divergences). 14 is industry standard.
Volume Moving Average Period
Default: 20 | Range: 10-200
What It Does: Lookback period for calculating average volume. Current volume is compared to this average to determine volume ratio.
When To Change:
Decrease to 10-14 for shorter-term volume comparison (more sensitive to recent volume changes)
Increase to 50-100 for longer-term volume comparison (smoother, less sensitive)
Impact: Lower values make volume ratio more volatile. Higher values make it more stable. 20 is standard.
ATR Period
Default: 14 | Range: 5-100
What It Does: Lookback period for Average True Range calculation used for volatility measurement and label positioning.
When To Change: Rarely needs adjustment. Use 7-10 for faster volatility response, 21-28 for slower.
Impact: Affects volatility ratio calculation and visual label spacing. Minimal impact on signals.
Pressure Percentile Lookback
Default: 50 | Range: 10-300
What It Does: Lookback period for calculating volume pressure percentile ranking. Your current pressure is ranked against the pressure of the last X bars.
When To Change:
Decrease to 20-30 for shorter-term pressure context (more responsive to recent changes)
Increase to 100-200 for longer-term pressure context (smoother rankings)
Impact: Lower values make pressure strength more sensitive to recent bars. Higher values provide more stable, long-term pressure assessment. Capped at 300 for performance reasons.
SIGNAL DETECTION SECTION
Signal Detection Mode
Default: "Divergence + Confluence (Confirmed)"
Options:
Confluence Only (Real-time)
Divergence + Confluence (Confirmed)
Divergence + Confluence (Relaxed)
What It Does: Selects which detection logic mode to use (see "Understanding The Three Detection Modes" section above).
When To Change: Use Confirmed for learning and non-repainting signals. Use Real-time for live scanning without divergence requirement. Use Relaxed for slightly more signals than Confirmed.
Impact: Fundamentally changes when and how signals appear.
VISUAL LAYERS SECTION
All toggles default to ON. Each controls visibility of one visual layer:
Show Market Structure: Pivot markers and support/resistance lines
Show Pressure Zones: Background color shading
Show Divergence Lines: Dotted lines connecting pivots
Show Institutional Footprint Markers: Absorption boxes, hunt labels, exhaustion labels
Show Consolidated Analysis Label: Main pattern detection label
Use Compact Label Format
Default: OFF
What It Does: Switches consolidated label between single-line compact format and multi-line detailed format.
When To Change: Turn ON if you find full labels too large or distracting.
Impact: Visual clarity vs. information density tradeoff.
DASHBOARD SECTION
Dashboard Mode
Default: "Optimized"
Options: Off, Compact, Optimized, Full
What It Does: Controls how much information the dashboard displays.
Off: No dashboard
Compact: 8 rows (essential metrics only)
Optimized: 12 rows (recommended balance)
Full: 13 rows (every available metric)
Dashboard Position
Default: "Top Right"
Options: Top Right, Top Left, Bottom Right, Bottom Left
What It Does: Screen corner where dashboard appears.
HOW TO USE VMDM - PRACTICAL WORKFLOW
STEP 1 - INITIAL SETUP
Add VMDM to your chart
Select your detection mode (Confirmed recommended for learning)
Set your minimum confluence score (start with 60-65)
Adjust pivot parameters if needed (default 3/3 is good for most timeframes)
Enable the visual layers you want to see
STEP 2 - CHART ANALYSIS
Let the indicator load and analyze historical data
Review the patterns that appear historically
Examine the confluence scores - notice which patterns had higher scores
Observe which patterns occurred during supportive pressure zones
Notice the divergence line connections - understand what price vs RSI did
STEP 3 - PATTERN RECOGNITION LEARNING
When a consolidated analysis label appears:
Read the divergence type (regular or hidden, bullish or bearish)
Check the quality tier (textbook, high quality, or valid)
Review the confluence breakdown - which factors contributed
Look at the chart context - where is price relative to structure, trend, etc.
Observe the behavioral footprint markers nearby - do they support the pattern
STEP 4 - REAL-TIME MONITORING
Watch the dashboard for real-time regime and pressure state
Monitor the current confluence score in the dashboard
When it approaches your threshold, be alert for potential pattern formation
When a new pattern appears (after confirmation delay), evaluate it using the workflow above
Use your trading strategy rules to decide if the setup aligns with your criteria
STEP 5 - POST-PATTERN OBSERVATION
After a pattern appears:
Mark the level on your chart
Observe what price does after the pattern completes
Did price respect the reversal/continuation signal
What was the confluence score of patterns that worked vs. those that failed
Learn which quality tiers and confluence levels produce better results on your specific symbol and timeframe
RECOMMENDED TIMEFRAMES AND ASSET CLASSES
VMDM is timeframe-agnostic and works on any asset with volume data. However, optimal performance varies:
BEST TIMEFRAMES
15-Minute to 1-Hour: Ideal balance of signal frequency and reliability. Pivot confirmation delay is acceptable. Sufficient volume data for pressure analysis.
4-Hour to Daily: Excellent for swing trading. Very high-quality signals. Lower frequency but higher significance. Recommended for learning because patterns are clearer.
1-Minute to 5-Minute: Works but requires adjustment. Increase pivot bars to 5-7 for filtering. Decrease max object history to 30 for performance. Expect more noise.
Weekly/Monthly: Works but very infrequent signals. Increase confluence threshold to 70+ to ensure only major patterns appear.
BEST ASSET CLASSES
Forex Majors: Excellent volume data and clear trends. Pressure analysis works well.
Crypto (Major Pairs): Good volume data. High volatility makes divergences more pronounced. Works very well.
Stock Indices (SPY, QQQ, etc.): Excellent. Clean price action and reliable volume.
Individual Stocks: Works well on high-volume stocks. Low-volume stocks may produce unreliable pressure readings.
Commodities (Gold, Oil, etc.): Works well. Clear trends and reactions.
WHAT THIS INDICATOR CANNOT DO - LIMITATIONS
LIMITATION 1 - It Does Not Predict The Future
VMDM identifies when technical conditions align historically associated with potential reversals or continuations. It does not predict what will happen next. A textbook 95-confluence pattern can still fail if fundamental events, news, or larger timeframe structure override the setup.
LIMITATION 2 - Confirmation Delay Means You Miss Early Entry
In Confirmed and Relaxed modes, the non-repainting design means you receive signals AFTER the pivot is confirmed. Price may have already moved significantly by the time you receive the signal. This is the tradeoff for non-repainting reliability. You can use Real-time mode for faster signals but sacrifice divergence confirmation.
LIMITATION 3 - It Does Not Tell You Position Sizing or Risk Management
VMDM provides technical pattern analysis. It does not calculate stop loss levels, take profit targets, or position sizing. You must apply your own risk management rules. Never risk more than you can afford to lose based on a technical signal.
LIMITATION 4 - Volume Pressure Analysis Requires Reliable Volume Data
On assets with thin volume or unreliable volume reporting, pressure analysis may be inaccurate. Stick to major liquid assets with consistent volume data.
LIMITATION 5 - It Cannot Detect Fundamental Events
VMDM is purely technical. It cannot predict earnings reports, central bank decisions, geopolitical events, or other fundamental catalysts that can override technical patterns.
LIMITATION 6 - Divergence Requires Two Pivots
The indicator cannot detect divergence until at least two pivots of the same type have formed. In strong trends without pullbacks, you may go long periods without signals.
LIMITATION 7 - Institutional Pattern Names Are Interpretive
The behavioral footprint patterns are named using common trading education terminology, but they are detected through technical analysis, not actual institutional data access. The patterns are interpretations based on price and volume behavior.
CONCEPT FOUNDATION - WHY THIS APPROACH WORKS
MARKET PRINCIPLE 1 - Momentum Divergence Precedes Price Reversal
Price is the final output of market forces, but momentum (the rate of change in those forces) shifts first. When price makes a new low but the momentum behind that move is weaker (higher RSI low), it signals that sellers are losing strength even though they temporarily pushed price lower. This precedes reversal. This is a fundamental principle in technical analysis taught by Charles Dow, widely observed in market behavior.
MARKET PRINCIPLE 2 - Volume Reveals Conviction
Price can move on low volume (low conviction) or high volume (high conviction). When price makes a new low on declining volume while RSI shows improving momentum, it suggests the new low is not confirmed by participant conviction. Adding volume pressure analysis to momentum divergence adds a confirmation layer that filters false divergences.
MARKET PRINCIPLE 3 - Anomalies Mark Structural Extremes
When volume spikes significantly but range contracts (absorption), or when price spikes beyond structure then reverses (stop hunt), or when aggressive moves are met with large-wick rejection (exhaustion), these anomalies often mark short-term extremes. Combining these structural observations with momentum analysis creates context.
MARKET PRINCIPLE 4 - Confluence Improves Probability
No single technical factor is reliable in isolation. RSI divergence alone fails frequently. Volume analysis alone cannot time entries. Combining multiple independent factors into a weighted system increases the probability that observed patterns have structural significance rather than random noise.
THE EDUCATIONAL VALUE
By visualizing all four layers simultaneously and breaking down the confluence scoring transparently, VMDM teaches you to think in terms of multi-dimensional analysis rather than single-indicator reliance. Over time, you will learn to recognize these patterns manually and understand which combinations produce better results on your traded assets.
INSTITUTIONAL TERMINOLOGY - IMPORTANT CLARIFICATION
This indicator uses the following terms that are common in trading education:
Institutional Footprint
Absorption (Accumulation / Distribution)
Stop Hunt
Exhaustion
CRITICAL DISCLAIMER:
These terms are EDUCATIONAL LABELS for specific price action and volume behavior patterns detected through technical analysis of publicly available chart data (open, high, low, close, volume). This indicator does NOT have access to:
Actual institutional order flow or order book data
Market maker positions or intentions
Broker stop-loss databases
Non-public trading data
Proprietary institutional information
The patterns labeled as "institutional footprint" are interpretations based on observable price and volume behavior that educational trading literature often associates with potential large-participant activity. The detection is algorithmic pattern recognition, not privileged data access.
When this indicator identifies "absorption," it means it detected high volume within a small range - a condition that MAY indicate large orders being filled but is not confirmation of actual institutional participation.
When it identifies a "stop hunt," it means price briefly penetrated a structural level then reversed - a pattern that MAY have triggered stop losses but is not confirmation that stops were specifically targeted.
When it identifies "exhaustion," it means high volume with large rejection wicks - a pattern that MAY indicate aggressive participation meeting strong opposition but is not confirmation of institutional involvement.
These are technical analysis interpretations, not factual statements about market participant identity or intent.
DISCLAIMER AND RISK WARNING
EDUCATIONAL PURPOSE ONLY
This indicator is designed as an educational tool to help traders learn to recognize technical patterns, understand multi-factor analysis, and practice systematic market observation. It is NOT a trading system, signal service, or financial advice.
NO PERFORMANCE GUARANTEE
Past pattern behavior does not guarantee future results. A pattern that historically preceded price movement in one direction may fail in the future due to changing market conditions, fundamental events, or random variance. Confluence scores reflect historical technical alignment, not future certainty.
TRADING INVOLVES SUBSTANTIAL RISK
Trading financial instruments involves substantial risk of loss. You can lose more than your initial investment. Never trade with money you cannot afford to lose. Always use proper risk management including stop losses, position sizing, and portfolio diversification.
NO PREDICTIVE CLAIMS
This indicator does NOT predict future price movement. It identifies when technical conditions align in patterns that historically have been associated with potential reversals or continuations. Market behavior is probabilistic, not deterministic.
BACKTESTING LIMITATIONS
If you backtest trading strategies using this indicator, ensure you account for:
Realistic commission costs
Realistic slippage (difference between signal price and actual fill price)
Sufficient sample size (minimum 100 trades for statistical relevance)
Reasonable position sizing (risking no more than 1-2 percent of account per trade)
The confirmation delay inherent in the indicator (you cannot enter at the exact pivot in Confirmed mode)
Backtests that do not account for these factors will produce unrealistic results.
AUTHOR LIABILITY
The author (BullByte) is not responsible for any trading losses incurred using this indicator. By using this indicator, you acknowledge that all trading decisions are your sole responsibility and that you understand the risks involved.
NOT FINANCIAL ADVICE
Nothing in this indicator, its code, its description, or its visual outputs constitutes financial, investment, or trading advice. Consult a licensed financial advisor before making investment decisions.
FREQUENTLY ASKED QUESTIONS
Q: Why do signals appear in the past, not at the current bar
A: In Confirmed and Relaxed modes, signals appear at confirmed pivots, which requires waiting for right-side confirmation bars (default 3). This creates a delay but prevents repainting. Use Real-time mode if you want current-bar signals without pivot confirmation.
Q: Can I use this for automated trading
A: You can create alert-based automation, but understand that Confirmed mode signals appear AFTER the pivot with delay, so your entry will not be at the pivot price. Real-time mode signals can change as the current bar develops. Automation requires careful consideration of these factors.
Q: How do I know which confluence score to use
A: Start with 60. Observe which patterns work on your symbol/timeframe. If too many false signals, increase to 70-75. If too few signals, decrease to 55. Quality vs. quantity tradeoff.
Q: Do regular divergences mean I should enter a reversal trade immediately
A: No. Regular divergences indicate momentum exhaustion, which is a WARNING sign that trend may reverse, not a confirmation that it will. Use confluence score, market context, support/resistance, and your strategy rules to make entry decisions. Many divergences fail.
Q: What's the difference between regular and hidden divergence
A: Regular divergence = price and momentum move in opposite directions at extremes = potential reversal signal. Hidden divergence = price and momentum move in opposite directions during pullbacks = potential continuation signal. Hidden divergence suggests the pullback is just a correction within the larger trend.
Q: Why does the pressure zone color sometimes conflict with the divergence direction
A: Pressure is real-time current bar analysis. Divergence is confirmed pivot analysis from the past. They measure different things at different times. A bullish divergence confirmed 3 bars ago might appear during current selling pressure. This is normal.
Q: Can I use this on stocks without volume data
A: No. Volume is required for pressure analysis and behavioral pattern detection. Use only on assets with reliable volume reporting.
Q: How often should I expect signals
A: Depends on timeframe and settings. Daily charts might produce 5-10 signals per month. 1-hour charts might produce 20-30. 15-minute charts might produce 50-100. Adjust confluence threshold to control frequency.
Q: Can I modify the code
A: Yes, this is open source. You can modify for personal use. If you publish a modified version, please credit the original and ensure your publication meets TradingView guidelines.
Q: What if I disagree with a pattern's confluence score
A: The scoring weights are based on general observations and may not suit your specific strategy or asset. You can modify the code to adjust weights if you have data-driven reasons to do so.
Final Notes
VMDM - Volume, Momentum and Divergence Master is an educational multi-layer market analysis system designed to teach systematic pattern recognition through transparent, confluence-weighted signal detection. By combining RSI momentum divergence, volume pressure quantification, behavioral footprint pattern recognition, and quality scoring into a unified framework, it provides a comprehensive learning environment for understanding market structure.
Use this tool to develop your analytical skills, understand how multiple technical factors interact, and learn to distinguish high-quality setups from noise. Remember that technical analysis is probabilistic, not predictive. No indicator replaces proper education, risk management, and trading discipline.
Trade responsibly. Learn continuously. Risk only what you can afford to lose.
-BullByte

Accumulation And Distribution Zones (Zeiierman)█ Overview
Accumulation And Distribution Zones (Zeiierman) is a structural zone indicator that highlights where the market has recently been absorbing sell pressure (Accumulation) or releasing buy pressure (Distribution).
The indicator tracks a refined sequence of swing highs and lows and measures how these swings tighten, expand, or step directionally. When they form staircase-style structures such as higher lows with compressing highs for Accumulation or lower highs with compressing lows for Distribution, the script marks these areas as shifts in market control.
Once the full pattern completes, the indicator converts it into an Accumulation or Distribution zone. Each zone is based on a confirmed structural sequence rather than a single point, making it more reliable and reflective of actual market behavior.
The indicator can also display a mini-volume profile within each zone and extend POC levels forward, showing where trading activity clustered most. Combined, these features reveal areas where price has recently shown acceptance, absorption, or rejection, helping you understand whether current price action is reacting to, breaking from, or retesting these important structural regions.
█ How It Works
⚪ Swing Structure
The indicator builds its foundation by detecting swing highs and lows using a configurable Swing Detection Window. Each confirmed swing is stored with its price, time, bar index, and direction. If two consecutive swings share the same direction, only the more extreme one is kept. This produces a clean structural sequence that removes noise and keeps only meaningful turning points.
⚪ Accumulation vs Distribution Pattern Logic
Using the refined swing sequence, the script looks for staircase-style formations that signal shifts in control:
Accumulation (bottoming): higher lows combined with compressing highs.
Distribution (topping): lower highs combined with compressing lows.
Two detection modes are available:
Quick for compact 4-swing formations
Slow for broader 6-swing structures
When a full structural pattern completes, the indicator marks the zone and resets the swing buffer for the next formation.
⚪ Volume Profile Construction
The price range between the zone’s upper and lower boundary is divided into several Rows. For every bar within the zone’s swing range, the bar’s volume is added to the appropriate price row.
Volume is classified as:
Bullish volume when close > open
Bearish volume when close < open
Each row is drawn as two horizontal segments (bull and bear), colored with smooth gradients based on your bull/bear color settings. This creates a compact profile that reveals where trading activity is concentrated inside the zone and whether buyers or sellers dominate those price levels.
█ How to Use
The indicator is designed to provide context and confluence, not raw buy/sell signals.
⚪ Spot Fresh Accumulation & Distribution
Use newly printed zones as a map of where the market has recently:
Absorbed selling and formed a floor (Accumulation below price).
Absorbed buying and formed a cap (Distribution above price).
In a trending environment, fresh accumulation zones below price are often areas to watch for pullbacks, while distribution zones above price can act as sell zones or targets.
⚪ Volume Profile
Longer horizontal bars show where the market traded the most volume inside the zone.
Bull-leaning rows inside an accumulation zone often signal strong buying interest during the formation.
Bear-leaning rows inside a distribution zone highlight concentrated selling pressure.
By combining this volume distribution with the zone label and the broader trend context, you can judge whether the structure is more likely to hold, break, or retest as the price approaches it again.
⚪ POC (Point of Control) Trading
Extended POC zones (Regular or Faded) can be treated as dynamic support/resistance rails:
When price revisits a prior accumulation POC and rejects it from above, the level may act as support. When price retests a distribution POC from below and fails to break through, it can act as resistance.
⚪ Combine with Your Own Strategy
The script does not decide direction for you. You get the most value by combining it with:
Your own trend filters (moving averages, higher timeframe structure, volatility measures).
Your preferred entry models (reversal candles, momentum breaks, liquidity grabs, etc.).
Higher-timeframe mapping.
Think of this tool as a map of where the market did meaningful business. You decide how to trade around those areas.
█ Settings
Acc/Dist Ranges – Master switch for drawing all Accumulation and Distribution zones. Turn this off to temporarily hide boxes while leaving supporting logic active.
Pattern – Shows or hides the swing-based pattern outline that formed each zone. Good for structural debugging and education.
Pattern Sensitivity
Quick – more responsive, detects smaller compact structures.
Slow – stricter, focuses on wider and more established zones.
Swing Detection Window – Pivot width used to confirm swing highs and lows. Larger values filter noise and produce bigger zones; smaller values pick up more minor structures.
Volume Profile – Enables the embedded volume profile inside each zone.
Rows – Number of price slices used to aggregate volume in the zone. Higher values give more detail but increase visual density.
Switch Order – Flips the horizontal order of bull vs bear volume segments within each row.
Extend Zones – Behaviour of POC and zone extension:
None – No forward extension.
Faded Zones – Store and draw up to four past POC zones as faded horizontal levels.
Regular Zones – Extend POC boxes forward until price breaks out.
-----------------
Disclaimer
The content provided in my scripts, indicators, ideas, algorithms, and systems is for educational and informational purposes only. It does not constitute financial advice, investment recommendations, or a solicitation to buy or sell any financial instruments. I will not accept liability for any loss or damage, including without limitation any loss of profit, which may arise directly or indirectly from the use of or reliance on such information.
All investments involve risk, and the past performance of a security, industry, sector, market, financial product, trading strategy, backtest, or individual's trading does not guarantee future results or returns. Investors are fully responsible for any investment decisions they make. Such decisions should be based solely on an evaluation of their financial circumstances, investment objectives, risk tolerance, and liquidity needs.

Trend Pivot Retracements▶ OVERVIEW
Trend Pivot Retracements identifies market trend direction using a Donchian-style channel and dynamically highlights retracement zones during trending conditions. It calculates the percentage pullbacks from recent highs and lows, plots labeled zones with varying intensity, and visually connects key retracement pivots. The indicator also emphasizes price proximity to trend boundaries by dynamically adjusting the thickness of plotted trend bands.
▶ TREND DETECTION & BAND STRUCTURE
The indicator determines the current trend by checking for new 50-bar extremes:
Uptrend: If a new highest high is made, the trend is considered bullish.
Downtrend: If a new lowest low is made, the trend is considered bearish.
Uptrend Band: Plots the 50-bar lowest low as a trailing support level.
Downtrend Band: Plots the 50-bar highest high as a trailing resistance level.
Thickness Variation: The thickness of the band increases the further price moves from it, indicating overextension.
▶ RETRACEMENT LABELING SYSTEM
During a trend, the indicator monitors pivot points in the opposite direction to measure retracements:
Bullish Retracement:
Triggered when a pivot low forms during an uptrend.
Measures % pullback from the most recent swing high (searched up to 20 bars back).
Plots a bold horizontal line at the low and a dashed diagonal from the previous swing high.
Adds a “-%” label above the low; intensity is based on recent 50 pullbacks.
Bearish Retracement:
Triggered when a pivot high forms during a downtrend.
Measures % pullback from the previous swing low (up to 20 bars back).
Plots a bold horizontal line at the high and a dashed diagonal from the prior swing low.
Adds a “%” label below the high with gradient color based on the past 50 extremes.
▶ PIVOT CONNECTION LINES
Each retracement includes a visual connector:
A diagonal dashed line linking the swing extreme (20 bars back) to the retracement point.
This line visually traces the path of price retreat within the trend.
Helps traders understand where the retracement originated and how steep it was.
▶ TREND SWITCH SIGNALS
When trend direction changes:
A diamond marker is plotted on the new pivot confirming the trend shift.
Green diamonds signal new bullish trends at fresh lows.
Magenta diamonds signal new bearish trends at fresh highs.
▶ COLOR INTENSITY & CONTEXTUAL AWARENESS
To help interpret the magnitude of retracements:
The % labels are color-coded using a gradient scale that references the max of the last 50 pullbacks.
Stronger pullbacks result in deeper color intensity, signaling more significant corrections.
Trend bands also use standard deviation normalization to adjust line thickness based on how far price has moved from the band.
This creates a visual cue for potential exhaustion or volatility extremes.
▶ USAGE
Trend Pivot Retracements is a powerful tool for traders who want to:
Identify trend direction and contextual pullbacks within those trends.
Spot key retracement points that may serve as entry opportunities or reversal signals.
Use visual retracement angles to understand market pressure and trend maturity.
Read dynamic band thickness as an alert for price stretch, potential mean reversion, or breakout setups.
▶ CONCLUSION
Trend Pivot Retracements gives traders a clean, visually expressive way to monitor trending markets, while capturing and labeling meaningful retracements. With adaptive color intensity, diagonal connectors, and smart trend switching, it enhances situational awareness and provides immediate clarity on trend health and pullback strength.

MULTI-CONDITION RSI SIGNAL GENERATOR═══════════════════════════════════════════════
MULTI-CONDITION RSI SIGNAL GENERATOR
═══════════════════════════════════════════════
OVERVIEW:
This indicator generates trading signals based on Relative Strength Index (RSI) movements with multiple confirmation layers designed to filter false signals and identify high-probability reversal opportunities.
═══════════════════════════════════════════════
WHAT MAKES THIS ORIGINAL:
═══════════════════════════════════════════════
Unlike basic RSI indicators that simply plot overbought/oversold crossovers, this system combines FOUR distinct confirmation mechanisms:
1. PERSISTENCE FILTERING - Requires RSI to remain in extreme zones for a minimum duration
2. LOOKBACK VALIDATION - Verifies recent extreme zone visits before signaling
3. DIVERGENCE DETECTION - Identifies price/RSI divergence for stronger signals
4. MOMENTUM CONFIRMATION - Provides trend-continuation entries via midline crosses
This multi-layered approach significantly reduces whipsaw trades that plague simple RSI crossover systems.
═══════════════════════════════════════════════
HOW IT WORKS (TECHNICAL METHODOLOGY):
═══════════════════════════════════════════════
STEP 1: RSI CALCULATION
- Standard RSI calculation using user-defined period (default: 14)
- Monitors two extreme zones: Overbought (default: 70) and Oversold (default: 30)
STEP 2: PERSISTENCE FILTERING
The script counts how many bars RSI has spent in extreme zones within the lookback period:
- For overbought signals: Counts bars where RSI > 70
- For oversold signals: Counts bars where RSI < 30
- Signal only triggers if count >= Minimum Duration (default: 4 bars)
This filters out brief spikes that immediately reverse, focusing on sustained extreme conditions that are more likely to lead to genuine reversals.
STEP 3: LOOKBACK VALIDATION
- Checks if RSI reached extreme zones within the Lookback Bars period (default: 20)
- Uses ta.highest() and ta.lowest() functions to verify recent extremes
- Ensures we're trading reversals from meaningful extremes, not random crossovers
STEP 4: BASIC SIGNAL GENERATION
- BUY SIGNAL: RSI crosses above the oversold level (30) after meeting persistence and lookback conditions
- SELL SIGNAL: RSI crosses below the overbought level (70) after meeting persistence and lookback conditions
STEP 5: DIVERGENCE DETECTION
The script identifies two types of divergence over the Divergence Lookback period (default: 5 bars):
A) BULLISH DIVERGENCE (indicates potential upward reversal):
- Price makes a lower low (current low < previous low)
- RSI makes a higher low (current RSI low > previous RSI low)
- Suggests weakening downward momentum
B) BEARISH DIVERGENCE (indicates potential downward reversal):
- Price makes a higher high (current high > previous high)
- RSI makes a lower high (current RSI high < previous RSI high)
- Suggests weakening upward momentum
STEP 6: STRONG SIGNAL CONFIRMATION
- STRONG BUY: Basic buy signal + bullish divergence present
- STRONG SELL: Basic sell signal + bearish divergence present
- These represent the highest-probability setups
STEP 7: MOMENTUM SIGNALS (OPTIONAL)
- MOMENTUM BUY: RSI crosses above 50 after being oversold (trend continuation)
- MOMENTUM SELL: RSI crosses below 50 after being overbought (trend continuation)
- Smaller signals for traders who want trend-following entries
═══════════════════════════════════════════════
SIGNAL TYPES AND VISUAL INDICATORS:
═══════════════════════════════════════════════
📈 GREEN TRIANGLE (below bar) - Standard Buy Signal
RSI crossed above oversold level with confirmation filters
📉 RED TRIANGLE (above bar) - Standard Sell Signal
RSI crossed below overbought level with confirmation filters
🔵 BLUE TRIANGLE (below bar) - Strong Buy Signal
Buy signal + bullish divergence (HIGHEST PRIORITY)
🟣 PURPLE TRIANGLE (above bar) - Strong Sell Signal
Sell signal + bearish divergence (HIGHEST PRIORITY)
🟢 GREEN CIRCLE (small) - Momentum Buy
RSI crosses above 50 after oversold conditions
🔴 RED CIRCLE (small) - Momentum Sell
RSI crosses below 50 after overbought conditions
BACKGROUND SHADING:
- Light red background: RSI currently overbought
- Light green background: RSI currently oversold
═══════════════════════════════════════════════
PARAMETER SETTINGS:
═══════════════════════════════════════════════
1. OVERBOUGHT LEVEL (default: 70, range: 50-90)
- Higher values = fewer but stronger overbought signals
- Lower values = more sensitive to overbought conditions
- Recommended: 70 for standard markets, 80 for crypto/volatile assets
2. OVERSOLD LEVEL (default: 30, range: 10-50)
- Lower values = fewer but stronger oversold signals
- Higher values = more sensitive to oversold conditions
- Recommended: 30 for standard markets, 20 for crypto/volatile assets
3. RSI PERIOD (default: 14, range: 2-50)
- Standard RSI calculation period
- Lower = more sensitive/faster signals
- Higher = smoother/slower signals
- Recommended: 14 (industry standard)
4. MINIMUM DURATION (default: 4, range: 1-20)
- Required bars in extreme zone before signal
- Higher values = fewer signals but better quality
- Lower values = more signals but more false positives
- Recommended: 3-5 for day trading, 5-10 for swing trading
5. LOOKBACK BARS (default: 20, range: 5-100)
- How far back to check for extreme zone visits
- Should match your typical trading timeframe
- Recommended: 20 for intraday, 50 for daily charts
6. DIVERGENCE LOOKBACK (default: 5, range: 2-20)
- Period for comparing price/RSI highs and lows
- Lower values = more frequent divergence signals
- Higher values = more significant divergences
- Recommended: 5-10 depending on timeframe
═══════════════════════════════════════════════
HOW TO USE THIS INDICATOR:
═══════════════════════════════════════════════
RECOMMENDED TRADING APPROACH:
1. PRIMARY ENTRIES: Focus on Strong Buy/Sell signals (blue/purple triangles)
- These have the highest win rate due to divergence confirmation
- Wait for price action confirmation (support/resistance, candlestick patterns)
2. SECONDARY ENTRIES: Regular Buy/Sell signals (green/red triangles)
- Use these when Strong signals are infrequent
- Require additional confirmation from other indicators or chart patterns
3. TREND CONTINUATION: Momentum signals (small circles)
- Best used when overall trend is clear
- Not recommended for reversal trading
4. FILTER TRADES: Use background shading as context
- Be cautious entering longs when background is red (overbought)
- Be cautious entering shorts when background is green (oversold)
RISK MANAGEMENT GUIDELINES:
- Never risk more than 2-5% of capital per trade
- Use stop losses below recent swing lows (buys) or above swing highs (sells)
- Target at least 1.5:1 reward-to-risk ratio
- Consider position sizing based on signal strength
TIMEFRAME RECOMMENDATIONS:
- 15min - 1hour: Day trading with adjusted parameters (lower minimum duration)
- 4hour - Daily: Swing trading with default parameters
- Weekly: Position trading with increased lookback periods
COMPLEMENTARY TOOLS:
This indicator works best when combined with:
- Support and resistance levels
- Trend indicators (moving averages, trend lines)
- Volume analysis
- Price action patterns (engulfing candles, pin bars)
═══════════════════════════════════════════════
LIMITATIONS AND CONSIDERATIONS:
═══════════════════════════════════════════════
- This is NOT a standalone trading system - requires additional analysis
- RSI-based strategies perform best in ranging/choppy markets
- May generate fewer signals in strong trending markets
- Divergence signals can be early - wait for price confirmation
- Not recommended for highly illiquid assets
- Backtest on your specific market before live trading
- No indicator is 100% accurate - always use proper risk management
═══════════════════════════════════════════════
TECHNICAL NOTES:
═══════════════════════════════════════════════
- Code is original and does not reuse external libraries
- Uses Pine Script v5 native functions only
- Alert conditions included for all signal types
- No repainting - signals appear and remain fixed
- Efficient calculation methods minimize processing load
═══════════════════════════════════════════════
ALERT SETUP:
═══════════════════════════════════════════════
Four alert conditions are available:
1. "Buy Alert" - Triggers on standard buy signals
2. "Sell Alert" - Triggers on standard sell signals
3. "Strong Buy Alert" - Triggers on divergence-confirmed buy signals
4. "Strong Sell Alert" - Triggers on divergence-confirmed sell signals
To set up alerts: Right-click chart → Add Alert → Select desired condition
═══════════════════════════════════════════════
This indicator is provided for educational and informational purposes. Always practice proper risk management and never trade with money you cannot afford to lose.

Dominant DATR [CHE] Dominant DATR — Directional ATR stream with dominant-side EMA, bands, labels, and alerts
Summary
Dominant DATR builds two directional volatility streams from the true range, assigns each bar’s range to the up or down side based on the sign of the close-to-close move, and then tracks the dominant side through an exponential average. A rolling band around the dominant stream defines recent extremes, while optional gradient coloring reflects relative magnitude. Swing-based labels mark new higher highs or lower lows on the dominant stream, and alerts can be enabled for swings, zero-line crossings, and band breakouts. The result is a compact pane that highlights regime bias and intensity without relying on price overlays.
Motivation: Why this design?
Conventional ATR treats all range as symmetric, which can mask directional pressure, cause late regime shifts, and produce frequent false flips during noisy phases. This design separates the range into up and down contributions, then emphasizes whichever side is stronger. A single smoothed dominant stream clarifies bias, while the band and swing markers help distinguish continuation from exhaustion. Optional normalization by close makes the metric comparable across instruments with different price scales.
What’s different vs. standard approaches?
Reference baseline: Classic ATR or a basic EMA of price.
Architecture differences:
Directional weighting of range using positive and negative close-to-close moves.
Separate moving averages for up and down contributions combined into one dominant stream.
Rolling highest and lowest of the dominant stream to form a band.
Optional normalization by close, window-based scaling for color intensity, and gamma adjustment for visual contrast.
Event logic for swing highs and lows on the dominant stream, with label buffering and pruning.
Configurable alerts for swings, zero-line crossings, and band breakouts.
Practical effect: You see when volatility is concentrated on one side, how strong that bias currently is, and when the dominant stream pushes through or fails at its recent envelope.
How it works (technical)
Each bar’s move is split into an up component and a down component based on whether the close increased or decreased relative to the prior close. The bar’s true range is proportionally assigned to up or down using those components as weights.
Each side is smoothed with a Wilder-style moving average. The dominant stream is the side with the larger value, recorded as positive for up dominance and negative for down dominance.
The dominant stream is then smoothed with an exponential moving average to reduce noise and provide a responsive yet stable signal line.
A rolling window tracks the highest and lowest values of the dominant EMA to form an envelope. Crossings of these bounds indicate unusual strength or weakness relative to recent history.
For visualization, the absolute value of the dominant EMA is scaled over a lookback window and passed through a gamma curve to modulate gradient intensity. Colors are chosen separately for up and down regimes.
Swing events are detected by comparing the dominant EMA to its recent extremes over a short lookback. Labels are placed when a prior bar set an extreme and the current bar confirms it. A managed array prunes older labels when the user-defined maximum is exceeded.
Alerts mirror these events and also include zero-line crossings and band breakouts. The script does not force closed-bar confirmation; users should configure alert execution timing to suit their workflow.
There are no higher-timeframe requests and no security calls. State is limited to simple arrays for labels and persistent color parameters.
Parameter Guide
Parameter — Effect — Default — Trade-offs/Tips
ATR Length — Smoothing of directional true range streams — fourteen — Longer reduces noise and may delay regime shifts; shorter increases responsiveness.
EMA Length — Smoothing of the dominant stream — twenty-five — Lower values react faster; higher values reduce whipsaw.
Band Length — Window for recent highs and lows of the dominant stream — ten — Short windows flag frequent breakouts; long windows emphasize only exceptional moves.
Normalize by Close — Divide by close price to produce a percent-like scale — false — Useful across assets with very different price levels.
Enable gradient color — Turn on magnitude-based coloring — true — Visual aid only; can be disabled for simplicity.
Gradient window — Lookback used to scale color intensity — one hundred — Larger windows stabilize the color scale.
Gamma (lines) — Adjust gradient intensity curve — zero point eight — Lower values compress variation; higher values expand it.
Gradient transparency — Transparency for gradient plots — zero, between zero and ninety — Higher values mute colors.
Up dark / Up neon — Base and peak colors for up dominance — green tones — Styling only.
Down dark / Down neon — Base and peak colors for down dominance — red tones — Styling only.
Show zero line / Background tint — Visual references for regime — true and false — Background tint can help quick scanning.
Swing length — Bars used to detect swing highs or lows — two — Larger values demand more structure.
Show labels / Max labels / Label offset — Label visibility, cap, and vertical offset — true, two hundred, zero — Increase cap with care to avoid clutter.
Alerts: HH/LL, Zero Cross, Band Break — Toggle alert rules — true, false, false — Enable only what you need.
Reading & Interpretation
The dominant EMA above zero indicates up-side dominance; below zero indicates down-side dominance.
Band lines show recent extremes of the dominant EMA; pushes through the band suggest unusual momentum on the dominant side.
Gradient intensity reflects local magnitude of dominance relative to the chosen window.
HH/LL labels appear when the dominant stream prints a new local extreme in the current regime and that extreme is confirmed on the next bar.
Zero-line crosses suggest regime flips; combine with structure or filters to reduce noise.
Practical Workflows & Combinations
Trend following: Consider entries when the dominant EMA is on the regime side and expands away from zero. Band breakouts add confirmation; structure such as higher highs or lower lows in price can filter signals.
Exits and stops: Tighten exits when the dominant stream stalls near the band or fades toward zero. Opposite swing labels can serve as early caution.
Multi-asset and multi-timeframe: Works across liquid assets and common timeframes. For lower noise instruments, reduce smoothing slightly; for high noise, increase lengths and swing length.
Behavior, Constraints & Performance
Repaint and confirmation: No security calls and no future-looking references. Swing labels confirm one bar later by design. Real-time crosses can change intra-bar; use bar-close alerts if needed.
Resources: `max_bars_back` is two thousand. The script uses an array for labels with pruning, gradient color computations, and a simple while loop that runs only when the label cap is exceeded.
Known limits: The EMA can lag at sharp turns. Normalization by close changes scale and may affect thresholds. Extremely gappy data can produce abrupt shifts in the dominant side.
Sensible Defaults & Quick Tuning
Starting point: ATR Length fourteen, EMA Length twenty-five, Band Length ten, Swing Length two, gradient enabled.
Too many flips: Increase EMA Length and swing length, or enable only swing alerts.
Too sluggish: Decrease EMA Length and Band Length.
Inconsistent scales across symbols: Enable Normalize by Close.
Visual clutter: Disable gradient or reduce label cap.
What this indicator is—and isn’t
This is a volatility-bias visualization and signal layer that highlights directional pressure and intensity. It is not a complete trading system and does not produce position sizing or risk management. Use it with market structure, context, and independent risk controls.
Disclaimer
The content provided, including all code and materials, is strictly for educational and informational purposes only. It is not intended as, and should not be interpreted as, financial advice, a recommendation to buy or sell any financial instrument, or an offer of any financial product or service. All strategies, tools, and examples discussed are provided for illustrative purposes to demonstrate coding techniques and the functionality of Pine Script within a trading context.
Any results from strategies or tools provided are hypothetical, and past performance is not indicative of future results. Trading and investing involve high risk, including the potential loss of principal, and may not be suitable for all individuals. Before making any trading decisions, please consult with a qualified financial professional to understand the risks involved.
By using this script, you acknowledge and agree that any trading decisions are made solely at your discretion and risk.
Do not use this indicator on Heikin-Ashi, Renko, Kagi, Point-and-Figure, or Range charts, as these chart types can produce unrealistic results for signal markers and alerts.
Best regards and happy trading
Chervolino

Multipower Entry SecretMultipower Entry Secret indicator is designed to be the ultimate trading companion for traders of all skill levels—especially those who struggle with decision-making due to unclear or overwhelming signals. Unlike conventional trading systems cluttered with too many lines and confusing alerts, this indicator provides a clear, adaptive, and actionable guide for market entries and exits.
Key Points:
Clear Buy/Sell/Wait Signals:
The script dynamically analyzes price action, candle patterns, volume, trend strength, and higher time frame context. This means it gives you “Buy,” “Sell,” or “Wait” signals based on real, meaningful market information—filtering out the noise and weak trades.
Multi-Timeframe Adaptive Analysis:
It synchronizes signals between higher and current timeframes, ensuring you get the most reliable direction—reducing the risk of getting caught in fake moves or sudden reversals.
Automatic Support, Resistance & Liquidity Zones:
Key levels like support, resistance, and liquidity zones are auto-detected and displayed directly on the chart, helping you make precise decisions without manual drawing.
Real-Time Dashboard:
All relevant information, such as trend strength, market intent, volume sentiment, and the reason behind each signal, is neatly summarized in a dashboard—making monitoring effortless and intuitive.
Customizable & Beginner-Friendly:
Whether you’re a newcomer wanting straightforward guidance or a professional needing advanced customization, the indicator offers flexible options to adjust analysis depth, timeframes, sensitivity, and more.
Visual & Clutter-Free:
The design ensures that your chart remains clean and readable, showing only the most important information. This minimizes mental overload and allows for instant decision-making.
Who Will Benefit?
Beginners who want to learn trading logic, avoid common traps, and see the exact reason behind every signal.
Advanced traders who require adaptive multi-timeframe analytics, fast execution, and stress-free monitoring.
Anyone who wants to save screen time, reduce analysis paralysis, and have more confidence in every trade they take.
1. No Indicator Clutter
Intent:
Many traders get confused by charts filled with too many indicators and signals. This often leads to hesitation, missed trades, or taking random, risky trades.
In this Indicator:
You get a clean and clutter-free chart. Only the most important buy/sell/wait signals and relevant support/resistance/liquidity levels are shown. These update automatically, removing the “overload” and keeping your focus sharp, so your decision-making is faster and stress-free.
2. Exact Entry Guide
Intent:
Traders often struggle with entry timing, leading to FOMO (fear of missing out) or getting trapped in sudden market reversals.
In this Indicator:
The system uses powerful adaptive logic to filter out weak signals and only highlight the strongest market moves. This not only prevents you from entering late or on noise, but also helps avoid losses from false breakouts or whipsaws. You get actionable suggestions—when to enter, when to hold back—so your entries are high-conviction and disciplined.
3. HTF+LTF Logic: Multitimeframe Sync Analysis
Intent:
Most losing trades happen when you act only on the short-term chart, ignoring the bigger market trend.
In this Indicator:
Signals are based on both the current chart timeframe (LTF) and a higher (HTF, like hourly/daily) timeframe. The indicator synchronizes trend direction, momentum, and structure across both levels, quickly adapting to show you when both are aligned. This filtering results in “only trade with the bigger trend”—dramatically increasing your win rate and market confidence.
4. Auto Support/Resistance & Liquidity Zones
Intent:
Drawing support/resistance and liquidity zones manually is time-consuming and error-prone, especially for beginners.
In this Indicator:
The system automatically identifies and plots the most crucial support/resistance levels and liquidity zones on your chart. This is based on adaptive, real-time price and volume analysis. These zones highlight where major institutional activity, trap setups, or real breakouts/reversals are most likely, removing guesswork and giving you a clear reference for entries, exits, and stop placements.
5. Clear Action/Direction
Intent:
Traders need certainty—what does the market want right now? Most indicators are vague.
In this Indicator:
Your dashboard always displays in plain words (like “BUY”, “SELL”, or “WAIT”) what action makes sense in the current market phase. Whether it’s a bull trap, volume spike, wick reversal, or exhaustion—it’s interpreted and explained clearly. No more confusion—just direct, real-time advice.
6. For Everyone (Beginner to Pro)
Intent:
Most advanced indicators are overwhelming for new traders; simple ones lack depth for professionals.
In this Indicator:
It is simple enough for a beginner—just add it to the chart and instantly see what action to consider. At the same time, it includes advanced adaptive analysis, multi-timeframe logic, and customizable settings so professional traders can fine-tune it for their strategies.
7. Ideal Usage and User Benefits
Instant Decision Support:
Whenever you’re unsure about a trade, just look at the indicator’s suggestion for clarity.
Entry Learning:
Beginners get real-time “practice” by not only seeing signals, but also the reason behind them—improving your chart reading and market understanding.
Screen Time & Stress Reduction:
Clear, relevant information only; no noise, less fatigue, faster decisions.
Makes Trading Confident & Simple:
The smart dashboard splits actionable levels (HTF, LTF, action) so you never miss a move, avoid traps, and stay aligned with high-probability trades.
8. Advanced Input Settings (Smart Customization)
Explained with Examples:
Enable Wick Analysis:
Finds candles with strong upper/lower wicks (signs of rejection/buying/selling force), alerting you to hidden reversals and protecting from FOMO entries.
Enable Absorption:
Detects when heavy order flow from one side is “absorbed” by the other (shows where institutional buyers/sellers are likely active, helps spot fake breakouts).
Enable Unusual Breakout:
Highlights real breakouts—large volatility plus high volume—so you catch genuine moves and avoid random spikes.
Enable Range/Expansion:
Smartly flags sudden range expansions—when the market goes from quiet to volatile—so you can act at the start of real trends.
Trend Bar Lookback:
Adjusts how many bars/candles are used in trend calculations. Short (fast trades, more signals), long (more reliability, fewer whipsaws).
Bull/Bear Bars for Strong Trend Min:
Sets how many candles in a row must support a trend before calling it “strong”—prevents flipping signals, keeps you disciplined.
Volume MA Length:
Lets you adjust how many bars back volume is averaged—fine-tune for your asset and trading style for best volume signals.
Swing Lookback Bars:
Set how many bars to use for swing high/low detection—short (quick swing levels), long (stronger support/resistance).
HTF (Bias Window):
Decide which higher timeframe the indicator should use for big-picture market mood. Adjustable for any style (scalp, swing, position).
Adaptive Lookback (HTF):
Choose how much HTF history is used for detecting major extremes/zones. Quick adjust for more/less sensitivity.
Show Support/Resistance, Liquidity Zones, Trendlines:
Toggle them on/off instantly per your needs—keeps your chart relevant and tailored.
9. Live Dashboard Sections Explained
Intent HTF:
Shows if the bigger timeframe currently has a Bullish, Bearish, or Neutral (“Chop”) intent, based on strict volume/price body calculations. Instant clarity—no more guessing on trend bias.
HTF Bias:
Clear message about which side (buy/sell/sideways) controls the market on the higher timeframe, so you always trade with the “big money.”
Chart Action:
The central action for the current bar—Whether to Buy, Sell, or Wait—calculated from all indicator logic, not just one rule.
TrendScore Long/Short:
See how many candles in your chosen window were bullish or bearish, at a glance. Instantly gauge market momentum.
Reason (WHY):
Every time a signal appears, the “reason” cell tells you the primary logic (breakout, wick, strong trend, etc.) behind it. Full transparency and learning—never trade blindly.
Strong Trend:
Shows if the market is currently in a powerful trend or not—helping you avoid choppy, risky entries.
HTF Vol/Body:
Displays current higher timeframe volume and candle body %—helping spot when big players are active for higher probability trades.
Volume Sentiment:
A real-time analysis of market psychology (strong bullish/bearish, neutral)—making your decision-making much more confident.
10. Smart and User-Friendly Design
Multi-timeframe Adaptive:
All calculations can now be drawn from your choice of higher or current timeframe, ensuring signals are filtered by larger market context.
Flexible Table Position:
You can set the live dashboard/summary anywhere on the chart for best visibility.
Refined Zone Visualization:
Liquidity and order blocks are visually highlighted, auto-tuning for your settings and always cleaning up to stay clutter-free.
Multi-Lingual & Beginner Accessible:
With Hindi and simple English support, descriptions and settings are accessible for a wide audience—anyone can start using powerful trading logic with zero language barrier.
Efficient Labels & Clear Reasoning:
Signal labels and reasons are shown/removed dynamically so your chart stays informative, not messy.
Every detail of this indicator is designed to make trading both simpler and smarter—helping you avoid the common pitfalls, learn real price action, stay in sync with the market’s true mood, and act with discipline for higher consistency and confidence.
This indicator makes professional-grade market analysis accessible to everyone. It’s your trusted assistant for making smarter, faster, and more profitable trading decisions—providing not just signals, but also the “why” behind every action. With auto-adaptive logic, clear visuals, and strong focus on real trading needs, it lets you focus on capturing the moves that matter—every single time.

Auto Channel [SciQua]Auto Channel
Purpose
Auto Channel finds the single best parallel price channel from recent price action and keeps it updated in real time. It uses ZigZag pivots to build candidate channels, scores each candidate for quality, then plots the winner. When price closes outside the channel, the script flags a breakout and can fire alerts.
How it works
1. ZigZag pivots
The script uses TradingView’s TradingView/ZigZag/7 library to generate a stream of swing highs and lows based on a percentage reversal threshold and a leg depth. These pivots are the only points the channel logic evaluates, which keeps the search fast and focused on structure rather than noise.
2. Channel candidates
From the most recent pivots, the script forms all combinations of two swing highs and two swing lows.
It computes a slope for the high line and a slope for the low line and requires that they be nearly parallel within a user-defined tolerance.
3. Quality scoring and selection
For every valid candidate, the script checks the recent pivot segments against the trial channel and computes:
Inside ratio: fraction of tested pivots that sit fully inside the channel after applying the tolerance buffer.
Violation sum: total magnitude of the breaches for any pivots outside the channel.
Current width: distance between upper and lower lines at the current bar.
The “best” channel is chosen by:
1. highest inside ratio
2. then widest current width
3. then smallest violation sum
4. Plot and projection
The upper and lower lines are anchored to the chosen pivot pairs and extend to the left. The script also projects each line to the current bar to compute the live upper and lower channel prices. Those levels drive the breakout checks and alerts.
5. Breakouts and alerts
A breakout is detected when the bar closes above the projected upper line or closes below the projected lower line, after applying the tolerance buffer. Triangle markers highlight fresh breakouts, and you can enable alert conditions to automate notification or strategy handoff.
Inputs:
ZigZag
Price deviation for reversals (%)
Default 0.2. Larger values produce fewer, larger swings. Smaller values produce more, smaller swings.
Pivot legs
Default 2. Controls the lookback depth ZigZag uses to confirm pivots.
ZigZag Color
Visual only.
Tip: If you are not seeing a stable channel, increase the ZigZag percentage to reduce minor swings.
Channel search
Number of recent pivots to consider
Default 12. Higher values search more history and try more channel combinations. Lower values make the search faster and more reactive.
Max slope difference for parallel
Default 0.0005. Maximum allowed difference between the upper and lower line slopes. Smaller values enforce stricter parallelism.
Max price tolerance outside channel
Default 0.0. A buffer added to the channel boundaries during validation and breakout checks. Use this to ignore tiny wicks that poke the lines.
Minimum inside to outside pivots ratio for valid channel (0.00–1.00)
Default 1.00. Require that at least this fraction of checked pivots lie inside the channel. For a more permissive fit, try 0.60 to 0.85.
Styling
Upper Line Color
Lower Line Color
Breakout Above Color
Breakout Below Color
Plots and visuals
Upper channel line
Lower channel line
Triangle markers on the bar that first confirms a close outside the channel, above or below.
Lines extend left from their pivot anchors. Projection to the current bar is used internally to test for breakouts and to set alerts.
Alerts
The script defines two alert conditions:
Close Above Channel
Triggers when the bar closes above the projected upper line plus tolerance.
Close Below Channel
Triggers when the bar closes below the projected lower line minus tolerance.
Practical usage
Trend channels
In a steady trend, a high inside ratio with a moderate width often highlights the dominant channel. Consider trend entries near the lower line in an uptrend or near the upper line in a downtrend, with exits or stops beyond the opposite boundary.
Breakout trades
Combine the channel breakout alert with volume or a separate momentum filter. The tolerance input helps avoid false triggers from small wicks.
Tuning for timeframe and symbol
• Faster markets or lower timeframes usually benefit from a larger ZigZag percentage and a smaller pivot count.
• Slower markets or higher timeframes can use more pivots and a tighter slope difference to enforce cleaner geometry.
Notes and limitations
Channels are derived from ZigZag pivots. If your ZigZag settings change, the detected channel will also change.
The script plots only the single best channel at any time to keep the chart clean.
Breakout markers appear on confirmed bars. For historical bars, markers appear only where a breakout would have been confirmed at that time.
Lines extend left from their anchors. The script projects the lines internally to the current bar for checks and alerts.
License and attribution
License
Creative Commons Attribution-NonCommercial 4.0 International (CC BY-NC 4.0).
Open source for educational and personal use only. Commercial use requires written permission.
Attribution
© 2025 SciQua — Joshua Danford
Libraries
Uses TradingView/ZigZag/7.
Changelog
v1.0
Initial release. Automatic parallel channel detection from ZigZag pivots, quality scoring, live plotting, and close-based breakout alerts.
FAQ
Why do I not see any channel sometimes?
There may not be a valid pair of highs and lows that pass the slope, inside ratio, and tolerance checks. Loosen the constraints by increasing Max slope difference, lowering Minimum inside ratio, or increasing the ZigZag percentage.
The channel looks too narrow or too wide?
Adjust Number of recent pivots and Minimum inside ratio. A higher inside ratio tends to favor cleaner, sometimes wider channels. A lower ratio may admit narrower, more reactive channels.
How can I reduce false breakout alerts?
Increase Max price tolerance outside channel to ignore small wicks. Add a volume or momentum confirmation in your personal alert workflow.
Thank you for using Auto Channel . Feedback and improvements are welcome.

Sweep + BOS (Lines + First Confirmed Only)🔍 Indicator: Sweep + BOS (Break of Structure with Visual Lines)
🧠 Overview
This indicator combines Swing detection, Liquidity Sweeps, and Break of Structure (BOS) logic, with:
Customizable swing length,
BOS signals only after confirmed sweeps,
BOS shown only once per sweep,
Visual labels and connecting lines to highlight structure breaks clearly.
⚙️ Inputs
Swing Length:
Defines how many candles to use to identify a swing high/low. Must be an odd number (e.g., 3, 5, 7...).
Sweep Lookback Window:
Sets how far back the script checks for a sweep (false breakout over a swing).
BOS Validity After Sweep:
Number of bars within which a BOS can be considered valid after a sweep.
Toggle Options:
Show/hide:
Swing Labels
Sweep Labels
BOS Labels
BOS Connecting Lines
📌 Logic Breakdown
✅ Swings
Swing High: A candle’s high is greater than the highs of all N candles on both sides.
Swing Low: A candle’s low is lower than the lows of all N candles on both sides.
💧 Liquidity Sweeps
Sweep High:
Price spikes above a previous Swing High,
Then closes back below it (false breakout).
Sweep Low:
Price drops below a previous Swing Low,
Then closes back above it.
🔁 Break of Structure (BOS)
A BOS is only shown if:
It occurs after a valid sweep (within X bars),
It hasn’t been already plotted for that sweep,
BOS ↑ is only possible after Sweep Low,
BOS ↓ is only possible after Sweep High,
Opposite BOS type resets the last BOS state.
BOS ↑ (Bullish):
Confirmed when price closes above previous Swing High after Sweep Low.
Label appears at the candle low.
A line is drawn from the Swing Low to the BOS candle.
BOS ↓ (Bearish):
Confirmed when price closes below previous Swing Low after Sweep High.
Label appears at the candle high.
A line is drawn from the Swing High to the BOS candle.
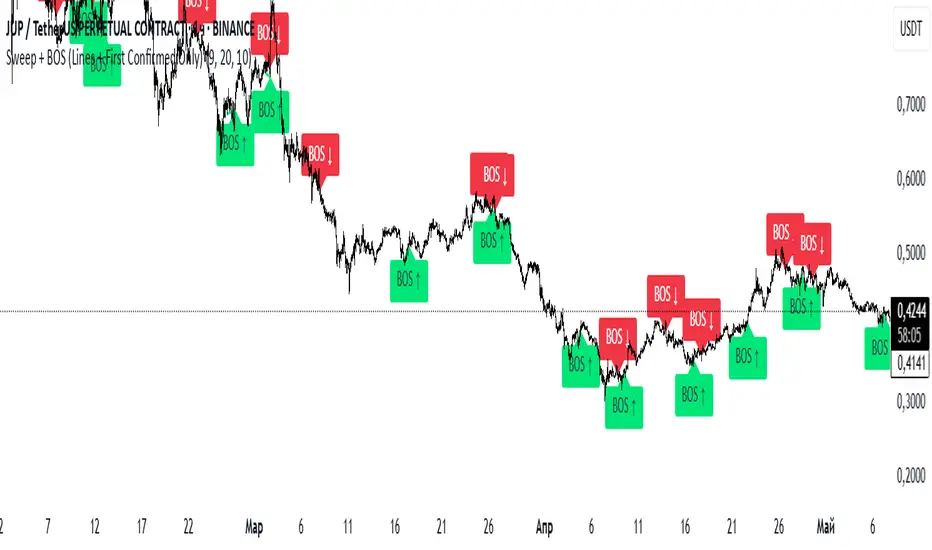
Pullback Candle (Bullish & Bearish, No EMA)🔍 Purpose
This indicator detects simple pullback reversal patterns based on price action and swing highs/lows — without any moving average or trend filters.
It highlights:
Bullish pullbacks (potential bounce/long setups)
Bearish pullbacks (potential rejection/short setups)
📈 Bullish Pullback Criteria
Three-bar pattern:
Bar 3: Highest close
Bar 2: Lower close
Bar 1: Even lower close
Current bar closes above previous bar (bullish reversal)
One of the last two candles is the lowest low of the past 6 bars (swing low)
📍 Result: A small green cross is plotted below the bar, and the bar is colored green.
📉 Bearish Pullback Criteria
Three-bar pattern:
Bar 3: Lowest close
Bar 2: Higher close
Bar 1: Even higher close
Current bar closes below previous bar (bearish reversal)
One of the last two candles is the highest high of the past 10 bars (swing high)
📍 Result: A small red cross is plotted above the bar, and the bar is colored red.
🔔 Alerts
One alert condition each for bullish and bearish pullback detection.
Can be used to trigger TradingView alerts.
🛠️ Customization
No inputs — fully automated logic
Clean, minimal, and fast
Can be extended with labels, alert sounds, or signals

Dynamic Liquidity Depth [BigBeluga]
Dynamic Liquidity Depth
A liquidity mapping engine that reveals hidden zones of market vulnerability. This tool simulates where potential large concentrations of stop-losses may exist — above recent highs (sell-side) and below recent lows (buy-side) — by analyzing real price behavior and directional volume. The result is a dynamic two-sided volume profile that highlights where price is most likely to gravitate during liquidation events, reversals, or engineered stop hunts.
🔵 KEY FEATURES
Two-Sided Liquidity Profiles:
Plots two separate profiles on the chart — one above price for potential sell-side liquidity , and one below price for potential buy-side liquidity . Each profile reflects the volume distribution across binned zones derived from historical highs and lows.
Real Stop Zone Simulation:
Each profile is offset from the current high or low using an ATR-based buffer. This simulates where traders might cluster their stop-losses above swing highs (short stops) or below swing lows (long stops).
Directional Volume Analysis:
Buy-side volume is accumulated only from bullish candles (close > open), while sell-side volume is accumulated only from bearish candles (close < open). This directional filtering enhances accuracy by capturing genuine pressure zones.
Dynamic Volume Heatmap:
Each liquidity bin is rendered as a horizontal box with a color gradient based on volume intensity:
- Low activity bins are shaded lightly.
- High-volume zones appear more vividly in red (sell) or lime (buy).
- The maximum volume bin in each profile is emphasized with a brighter fill and a volume label.
Extended POC Zones:
The Point of Control (PoC) — the bin with the most volume — is extended backwards across the entire lookback period to mark critical resistance (sell-side) or support (buy-side) levels.
Total Volume Summary Labels:
At the center of each profile, a summary label displays Total Buy Liquidity and Total Sell Liquidity volume.
This metric helps assess directional imbalance — when buy liquidity is dominant, the market may favor upward continuation, and vice versa.
Customizable Profile Granularity:
You can fine-tune both Resolution (Bins) and Offset Distance to adjust how far profiles are displaced from price and how many levels are calculated within the ATR range.
🔵 HOW IT WORKS
The indicator calculates an ATR-based buffer above highs and below lows to define the top and bottom of the liquidity zones.
Using a user-defined lookback period, it scans historical candles and divides the buffered zones into bins.
Each bin checks if bullish (or bearish) candles pass through it based on price wicks and body.
Volume from valid candles is summed into the corresponding bin.
When volume exists in a bin, a horizontal box is drawn with a width scaled by relative volume strength.
The bin with the highest volume is highlighted and optionally extended backward as a zone of importance.
Total buy/sell liquidity is displayed with a summary label at the side of the profile.
🔵 USAGE/b]
Identify Stop Hunt Zones: High-volume clusters near swing highs/lows are likely liquidation zones targeted during fakeouts.
Fade or Follow Reactions: Price hitting a high-volume bin may reverse (fade opportunity) or break with strength (confirmation breakout).
Layer with Other Tools: Combine with market structure, order blocks, or trend filters to validate entries near liquidity.
Adjust Offset for Sensitivity: Use higher offset to simulate wider stop placement; use lower for tighter scalping zones.
🔵 CONCLUSION
Dynamic Liquidity Depth transforms raw price and volume into a spatial map of liquidity. By revealing areas where stop orders are likely hidden, it gives traders insight into price manipulation zones, potential reversal levels, and breakout traps. Whether you're hunting for traps or trading with the flow, this tool equips you to navigate liquidity with precision.

ICT & SMC Multi-Timeframe by [KhedrFX]Transform your trading experience with the ICT & SMC Multi-Timeframe by indicator. This innovative tool is designed for traders who want to harness the power of multi-timeframe analysis, enabling them to make informed trading decisions based on key market insights. By integrating concepts from the Inner Circle Trader (ICT) and Smart Money Concepts (SMC), this indicator provides a comprehensive view of market dynamics, helping you identify potential trading opportunities with precision.
Key Features
- Multi-Timeframe Analysis: Effortlessly switch between various timeframes (5 minutes, 15 minutes, 30 minutes, 1 hour, 4 hours, daily, and weekly) to capture the full spectrum of market movements.
- High and Low Levels: Automatically calculates and displays the highest and lowest price levels over the last 20 bars, highlighting critical support and resistance zones.
- Market Structure Visualization: Identifies the last swing high and swing low, allowing you to recognize current market trends and potential reversal points.
- Order Block Detection: Detects significant order blocks, pinpointing areas of strong buying or selling pressure that can indicate potential market reversals.
- Custom Alerts: Set alerts for when the price crosses above or below identified order block levels, enabling you to act swiftly on trading opportunities.
How to Use the Indicator
1. Add the Indicator to Your Chart
- Open TradingView.
- Click on the "Indicators" button at the top of the screen.
- Search for "ICT & SMC Multi-Timeframe by " in the search bar.
- Click on the indicator to add it to your chart.
2. Select Your Timeframe
- Use the dropdown menu to choose your preferred timeframe (5, 15, 30, 60, 240, D, W) for analysis.
3. Interpret the Signals
- High Level (Green Line): Represents the highest price level over the last 20 bars, acting as a potential resistance level.
- Low Level (Red Line): Represents the lowest price level over the last 20 bars, acting as a potential support level.
- Last Swing High (Blue Cross): Indicates the most recent significant high, useful for identifying potential reversal points.
- Last Swing Low (Orange Cross): Indicates the most recent significant low, providing insight into market structure.
- Order Block High (Purple Line): Marks the upper boundary of a detected order block, suggesting potential selling pressure.
- Order Block Low (Yellow Line): Marks the lower boundary of a detected order block, indicating potential buying pressure.
4. Set Alerts
- Utilize the alert conditions to receive notifications when the price crosses above or below the order block levels, allowing you to stay informed about potential trading opportunities.
5. Implement Risk Management
- Always use proper risk management techniques. Consider setting stop-loss orders based on the identified swing highs and lows or the order block levels to protect your capital.
Conclusion
The ICT & SMC Multi-Timeframe by indicator is an essential tool for traders looking to enhance their market analysis and decision-making process. By leveraging multi-timeframe insights, market structure visualization, and order block detection, you can navigate the complexities of the market with confidence. Start using this powerful indicator today and take your trading to the next level.
⚠️ Trade Responsibly
This tool helps you analyze the market, but it’s not a guarantee of profits. Always do your own research, manage risk, and trade with caution.

02 SMC + BB Breakout (Improved)This strategy combines Smart Money Concepts (SMC) with Bollinger Band breakouts to identify potential trading opportunities. SMC focuses on identifying key price levels and market structure shifts, while Bollinger Bands help pinpoint overbought/oversold conditions and potential breakout points. The strategy also incorporates higher timeframe trend confirmation to filter out trades that go against the prevailing trend.
Key Components:
Bollinger Bands:
Calculated using a Simple Moving Average (SMA) of the closing price and a standard deviation multiplier.
The strategy uses the upper and lower bands to identify potential breakout points.
The SMA (basis) acts as a centerline and potential support/resistance level.
The fill between the upper and lower bands can be toggled by the user.
Higher Timeframe Trend Confirmation:
The strategy allows for optional confirmation of the current trend using a higher timeframe (e.g., daily).
It calculates the SMA of the higher timeframe's closing prices.
A bullish trend is confirmed if the higher timeframe's closing price is above its SMA.
This helps filter out trades that go against the prevailing long-term trend.
Smart Money Concepts (SMC):
Order Blocks:
Simplified as recent price clusters, identified by the highest high and lowest low over a specified lookback period.
These levels are considered potential areas of support or resistance.
Liquidity Zones (Swing Highs/Lows):
Identified by recent swing highs and lows, indicating areas where liquidity may be present.
The Swing highs and lows are calculated based on user defined lookback periods.
Market Structure Shift (MSS):
Identifies potential changes in market structure.
A bullish MSS occurs when the closing price breaks above a previous swing high.
A bearish MSS occurs when the closing price breaks below a previous swing low.
The swing high and low values used for the MSS are calculated based on the user defined swing length.
Entry Conditions:
Long Entry:
The closing price crosses above the upper Bollinger Band.
If higher timeframe confirmation is enabled, the higher timeframe trend must be bullish.
A bullish MSS must have occurred.
Short Entry:
The closing price crosses below the lower Bollinger Band.
If higher timeframe confirmation is enabled, the higher timeframe trend must be bearish.
A bearish MSS must have occurred.
Exit Conditions:
Long Exit:
The closing price crosses below the Bollinger Band basis.
Or the Closing price falls below 99% of the order block low.
Short Exit:
The closing price crosses above the Bollinger Band basis.
Or the closing price rises above 101% of the order block high.
Position Sizing:
The strategy calculates the position size based on a fixed percentage (5%) of the strategy's equity.
This helps manage risk by limiting the potential loss per trade.
Visualizations:
Bollinger Bands (upper, lower, and basis) are plotted on the chart.
SMC elements (order blocks, swing highs/lows) are plotted as lines, with user-adjustable visibility.
Entry and exit signals are plotted as shapes on the chart.
The Bollinger band fill opacity is adjustable by the user.
Trading Logic:
The strategy aims to capitalize on Bollinger Band breakouts that are confirmed by SMC signals and higher timeframe trend. It looks for breakouts that align with potential market structure shifts and key price levels (order blocks, swing highs/lows). The higher timeframe filter helps avoid trades that go against the overall trend.
In essence, the strategy attempts to identify high-probability breakout trades by combining momentum (Bollinger Bands) with structural analysis (SMC) and trend confirmation.
Key User-Adjustable Parameters:
Bollinger Bands Length
Standard Deviation Multiplier
Higher Timeframe
Higher Timeframe Confirmation (on/off)
SMC Elements Visibility (on/off)
Order block lookback length.
Swing lookback length.
Bollinger band fill opacity.
This detailed description should provide a comprehensive understanding of the strategy's logic and components.
***DISCLAIMER: This strategy is for educational purposes only. It is not financial advice. Past performance is not indicative of future results. Use at your own risk. Always perform thorough backtesting and forward testing before using any strategy in live trading.***

ICT Liquidity Levels [TakingProphets]Overview
This indicator is designed to dynamically identify and display key liquidity levels—areas where market participants are likely to engage. By analyzing price swing points, it highlights potential support and resistance zones that can signal reversals or breakouts. The script distinguishes between buyside and sellside liquidity levels, presenting them with customizable visual cues and labels for immediate clarity.
How It Works
Swing Point Detection:
The indicator uses a pivot-based method (with a configurable “Base Swing Strength”) to detect swing highs and lows. Each detected swing is evaluated for its “swing size” (percentage price movement), and if it exceeds a user-defined threshold, the level is classified as major.
Level Creation and Classification:
Overview
Built on core ICT principles, this indicator identifies key liquidity zones—areas where market imbalances can lead to liquidity sweeps. By dynamically analyzing swing points, it offers traders a real-time view of where liquidity is clustering, allowing for a deeper understanding of market structure. 🚀
How It Works
Swing Point Detection 🔍
• Uses a pivot-based method with a configurable “Base Swing Strength” to detect significant price swings.
• Calculates the swing size (percentage change) to flag zones that exceed the “Major Level Threshold” as major liquidity zones.
Level Creation & Classification 🛠️
• Buyside Liquidity Levels (BSL):
Identified from swing highs, marking zones where buying liquidity clusters.
• Sellside Liquidity Levels (SSL):
Identified from swing lows, highlighting zones of concentrated selling liquidity.
• Each zone is stored with its price, bar index, and classification (major or standard) before being drawn as a horizontal line on the chart.
Dynamic Level Management 🔄
• Extension: Liquidity lines automatically extend from their detection point to the current bar.
• Consolidation: When levels are close in price, the script merges them—updating labels (e.g., “REQH” or “REQL”) to denote unified liquidity zones.
• Traded-Through Detection: Adjusts or removes levels if the market moves beyond them, based on your settings.
• Age-Based Cleanup: Inactive zones are automatically removed after a set number of bars to maintain clarity.
Customization Options ⚙️
Visual Settings:
• Choose from solid, dashed, or dotted line styles and adjust line width.
• Option to display labels with customizable placement (left or right) for optimal clarity.
Color & Opacity:
• Set distinct colors for buyside and sellside liquidity zones.
• Configure opacity for zones that have been traded through, keeping them visible yet de-emphasized.
Detection & Cleanup Parameters:
• Adjust “Base Swing Strength” to control pivot detection sensitivity.
• Set the “Major Level Threshold %” to filter for significant liquidity zones.
• Decide whether to retain or remove zones once price moves through them.
• Define how many bars should pass before inactive zones are automatically deleted.
How to Use 🚀
Apply the Indicator:
Simply add the script to your chart—it automatically detects and marks key liquidity zones based on recent price action.
Adjust Inputs:
Fine-tune parameters like swing strength, threshold percentages, and visual settings to match the asset’s characteristics and your trading strategy.
Interpret the Visuals:
• Major Liquidity Zones:
Highlighted with thicker lines and distinct labels (e.g., “Major BSL/SSL”), indicating areas of heightened liquidity concentration.
• Consolidated Zones:
Merged labels (e.g., “REQH/REQL”) denote unified liquidity zones where clustering is significant.
• Traded-Through Zones:
Changes in opacity signal that the market has moved beyond a previously identified liquidity zone.
Underlying ICT Concepts 💡
Liquidity Pools & Sweeps:
Focused on identifying where liquidity is concentrated, the indicator aligns with ICT methodologies that highlight zones crucial for liquidity sweeps.
Pivot Analysis for Liquidity:
Enhances traditional pivot detection to spotlight liquidity clusters, providing a deeper insight into market structure.
Real-Time Adaptation:
With continuous updates and built-in cleanup, the indicator ensures that liquidity zones accurately reflect current market conditions.
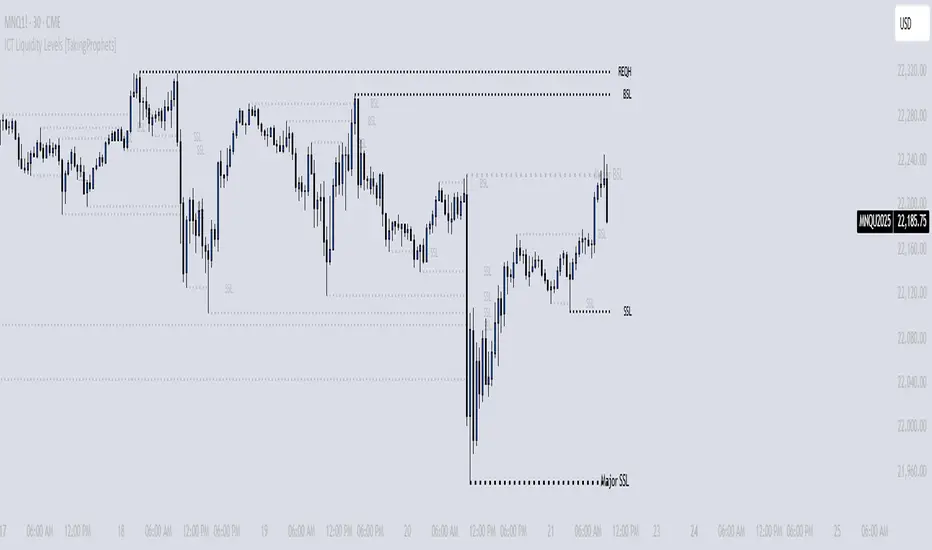
Gann Swing Strategy [1 Bar - Multi Layer]Use this Strategy to Fine-tune inputs for your Gann swing strategy.
Strategy allows you to fine-tune the indicator for 1 TimeFrame at a time; cross Timeframe Input fine-tuning is done manually after exporting the chart data.
MEANINGFUL DESCRIPTION:
The Gann Swing Chart using the One-Bar type, also known as the Minor Trend Chart, is designed to follow single-bar movements in the market. It helps identify trends by tracking price movements. When the market makes a higher high than the previous bar from a low price, the One-Bar trend line moves up, indicating a new high and establishing the previous low as a One-Bar bottom. Conversely, when the market makes a lower low than the previous bar from a high price, the One-Bar swing line moves down, marking a new low and setting the previous high as a One-Bar top. The crossing of these swing tops and bottoms indicates a change in trend direction.
HOW TO USE THE INDICATOR / Gann-swing Strategy:
The indicator shows 1, 2, and 3-bar swings. The strategy triggers a buy when the price crosses the previously determined high.
HOW TO USE THE STRATEGY:
Strategy to Fine-Tune Inputs for Your Gann Swing Strategy
This strategy allows for the fine-tuning of indicators for one timeframe at a time. Cross-timeframe input fine-tuning is done manually after exporting the chart data.
Meaningful Description:
The Gann Swing Chart using the One-Bar type, also known as the Minor Trend Chart, is designed to follow single-bar movements in the market. It helps identify trends by tracking price movements. When the market makes a higher high than the previous bar from a low price, the One-Bar trend line moves up, indicating a new high and establishing the previous low as a One-Bar bottom. Conversely, when the market makes a lower low than the previous bar from a high price, the One-Bar swing line moves down, marking a new low and setting the previous high as a One-Bar top. The crossing of these swing tops and bottoms indicates a change in trend direction.
How to Use the Indicator / Gann-Swing Strategy:
The indicator shows 1, 2, and 3-bar swings. The strategy triggers a buy when the price crosses the previously determined high.
How to Use the Strategy:
The strategy initiates a buy if the price breaks 1, 2, or 3-bar highs, or any combination thereof. Use the inputs to determine which highs or lows need to be crossed for the strategy to go long or short.
ORIGINALITY & USEFULNESS:
The One-Bar Swing Chart stands out for its simplicity and effectiveness in capturing minor market trends. Developed by meomeo105, this Gann high and low algorithm forms the basis of the strategy. I used my approach to creating strategy out of Gann swing indicator.
DETAILED DESCRIPTION:
What is a Swing Chart?
Swing charts help traders visualize price movements and identify trends by focusing on price highs and lows. They are instrumental in spotting trend reversals and continuations.
What is the One-Bar Swing Chart?
The One-Bar Swing Chart, also known as the Minor Trend Chart, follows single-bar price movements. It plots upward swings from a low price when a higher high is made, and downward swings from a high price when a lower low is made.
Key Features:
Trend Identification : Highlights minor trends by plotting swing highs and lows based on one-bar movements.
Simple Interpretation : Crossing a swing top indicates an uptrend, while crossing a swing bottom signals a downtrend.
Customizable Periods : Users can adjust the period to fine-tune the sensitivity of the swing chart to market movements.
Practical Application:
Bullish Trend : When the One-Bar Swing line moves above a previous swing top, it indicates a bullish trend.
Bearish Trend : When the One-Bar Swing line moves below a previous swing bottom, it signals a bearish trend.
Trend Reversal : Watch for crossings of swing tops and bottoms to detect potential trend reversals.
The One-Bar Swing Chart is a powerful tool for traders looking to capture and understand market trends. By following the simple rules of swing highs and lows, it provides clear and actionable insights into market direction.
Why the Strategy Uses 100% Allocation of a Portfolio:
This strategy allocates 100% of the portfolio to trading this specific pair, which does not mean 100% of all capital but 100% of the allocated trading capital for this pair. The strategy is swing-based and does not use take profit (TP) or stop losses.
