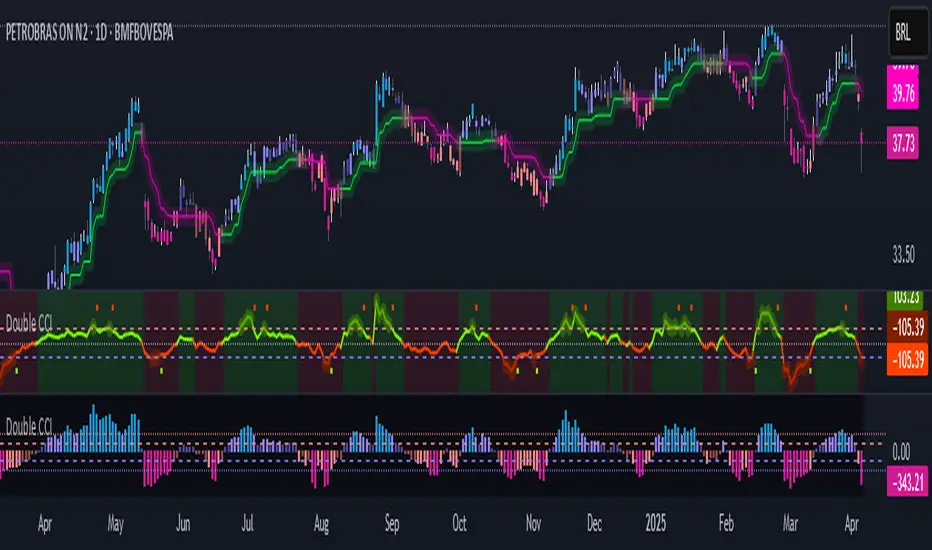
Double CCIThe Commodity Channel Index (CCI) is a momentum oscillator used in technical analysis primarily to identify overbought and oversold levels by measuring an instrument's variations away from its statistical mean. Besides overbought/oversold levels, CCI is often used to find reversals as well as divergences. Originally, the indicator was designed to be used for identifying trends in commodities, however it is now used in a wide range of financial instruments.
There are several steps involved in calculating the CCI. The following example is for a typical 14 Period CCI:
CCI = (Typical Price - 14 Period SMA of TP) / (.015 x Mean Deviation)
Typical Price (TP) = (High + Low + Close)/3
Constant = .015
The Constant is set at .015 for scaling purposes. By including the constant, the majority of CCI values will fall within the 100 to -100 range.
Mean Deviation:
1) Subtract the most recent 14 Period Simple Moving from each typical price (TP) for the Period.
2) Sum these numbers strictly using absolute values.
3) Divide the value generated in step 2 by the total number of Periods (14 in this case).
Overbought and Oversold conditions can be used in their more traditional sense to identify future reversals . Remember true overbought/oversold thresholds values can and often do vary between instruments.
During a Bullish Trend , price crossing above the overbought threshold may indicate strong confidence in the move and price will continue to rise.
During a Bearish Trend , price crossing below the oversold threshold may indicate strong confidence in the move and price will continue to fall.
The first option is a modified CCI indicator that uses the "Arnaud Legoux Moving Average" instead of the SMA, and the source uses the VWAP instead of the HLC3. Added to this version an option to calculate CCI with different types of moving averages:
Green dots mean they are overbought
Orange dots mean they are oversold
Added a "SuperTrend Background" based on the modified CCI indicator:
Bull event = CCI crossing over the 0 line
Bear event = CCI crossing below the 0 line
Added a signal as EMA (modified CCI, signal length)
The second option is a standard CCI indicator that shows a coloured histogram of important levels, giving a good visual of the CCI levels. Added to this version is an extra coloured level +/-200 and an option to use Traditional CCI calculations according to user @JustUncleL
LEVELS:
Aqua: Greater than 200.
Lavender: Greater than 100 and less than 200.
Dark Lavender: Greater than 0 and less than 100.
Dark Coral: Less than 0 and greater than -100.
Coral: Less than -100 and greater than -200.
Light Red: Less than -200.
Buscar en scripts para "supertrend"
[blackcat] L1 Tether LineLevel: 1
Background
Omega Research proposed Tether line in June 2000. I utilized it in fast-slow line form to follow trend.
Function
Due it can provides good support and resistance, using it as "moving average" fast-slow line form can provide very stable golden cross and dead cross signal.
You can adjust parameters to fit for your trading pair and use it and compare it with Supertrend indicator.
Key Signal
Tether_fast --> Tether Fast Line.
Tether_slow --> Tether Slow Line.
Remarks
This is a Level 1 free and open source indicator.
Feedbacks are appreciated.

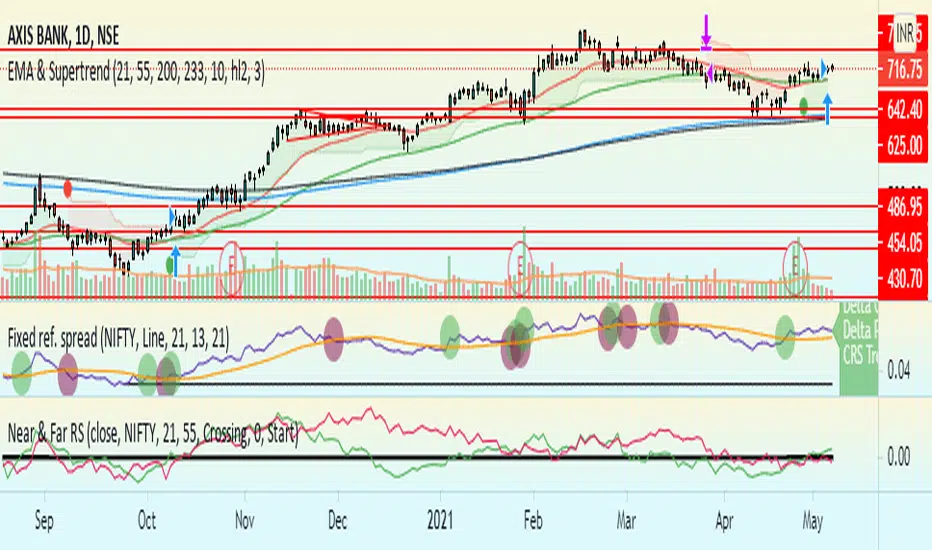
EMA & SupertrendStrategy has been built based on the crossover of 21 EMA (EMA 1) and 55 EMA (EMA 2). Along with with strategy, user can alter the period of EMA 1 & EMA 2 based on their suitability.
When EMA 1 crossover EMA2 or when prices closes above EMA 1 and EMA 1 is greater than EMA 2, strategy will generate Buy signal.
Position gets closed when price closes below EMA 2.
200 EMA, 233 EMA and Supertrend has been added for study purpose.
3x SuperTrend IndicatorSimplified version of SuperTrend Indicator which plots up to 3 lines at once. Script is mainly for users of free TradingView version.

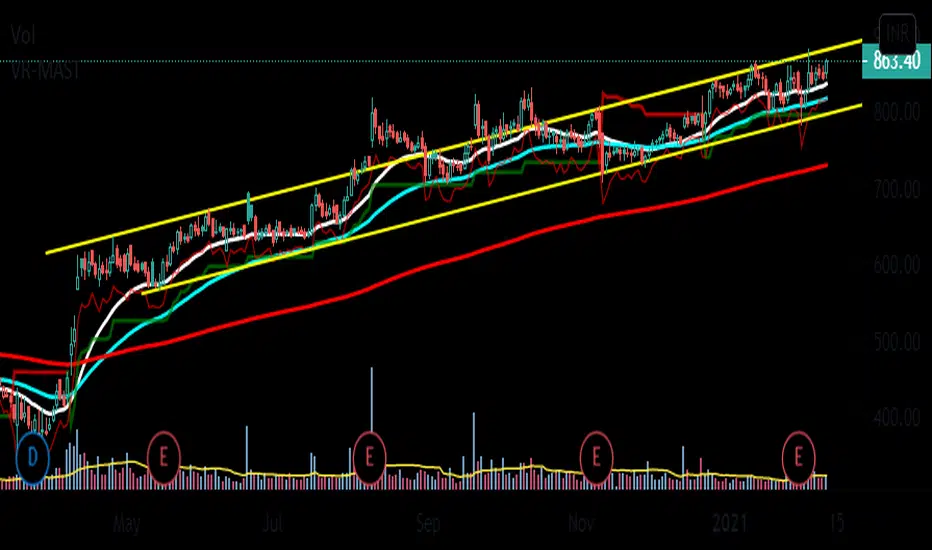
VR-MASTThis is a my script for a super simple trading strategy - ZEST.
Identify Zone of Value, Enter on pullback, place proper Stop Loss and set achievable Targets.
So, to identify Zone of Value, I have EMA in my script.
20EMA generally acts as a dynamic Support/Resistance zone.
For Buy Stop Loss, we have 1ATR below Swing Low.
Then, we have SuperTrend for Trailing Stop Loss.
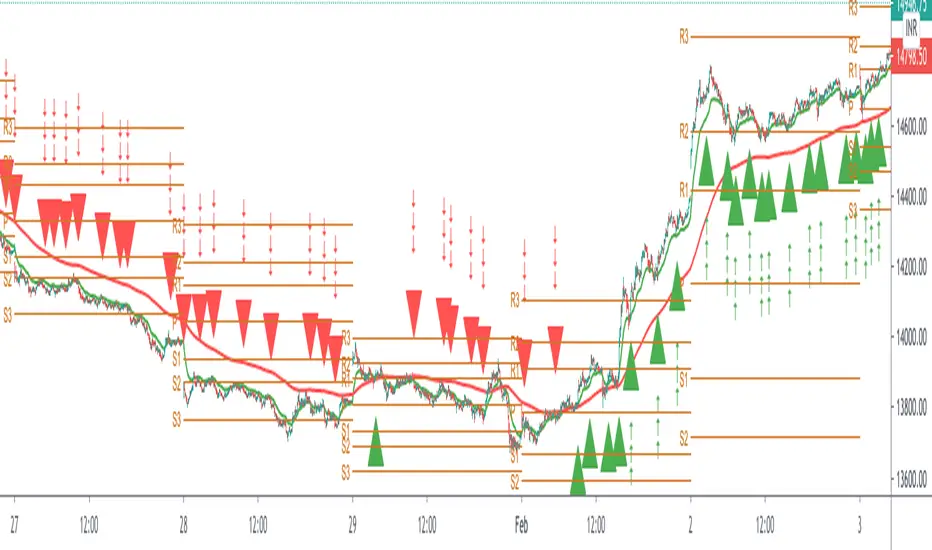
[THETA] Tema Hema Evwma Trade ActionTHETA
Is an Intraday Strategy Indicator, To be used over 1 minute chart and in conjunction with built in pine indicator Pivot Point Standard, {Fibonacci One}
I came across this Strategy Indicator while reading through the Forex Trading Journals, and thought of sharing you guys
The Indicator Comprises of amalgamation of
TEMA : Triple Exponential Moving Average
HMA : Hulls Moving Average
EVWMA and EMA: Elastic Volume weighted Moving Average and Exponential Moving Average
Filter Action by Rajandran R Supertrend
So
Theta = ( tema(src, length) + hma(src, length) + ema(src, length) + evwma(src, length) )/4
The lengths in use are: 8,21,34,55,89,144,233,610
How to Use
Use on 1 min chart for best results
UsE in Conjuction with Fibonacci Pivot Points, (.which is present in option of built in pine indicator : Pivot Point Standard )
Provision For Alert
Long theta Signal
Short theta Signal
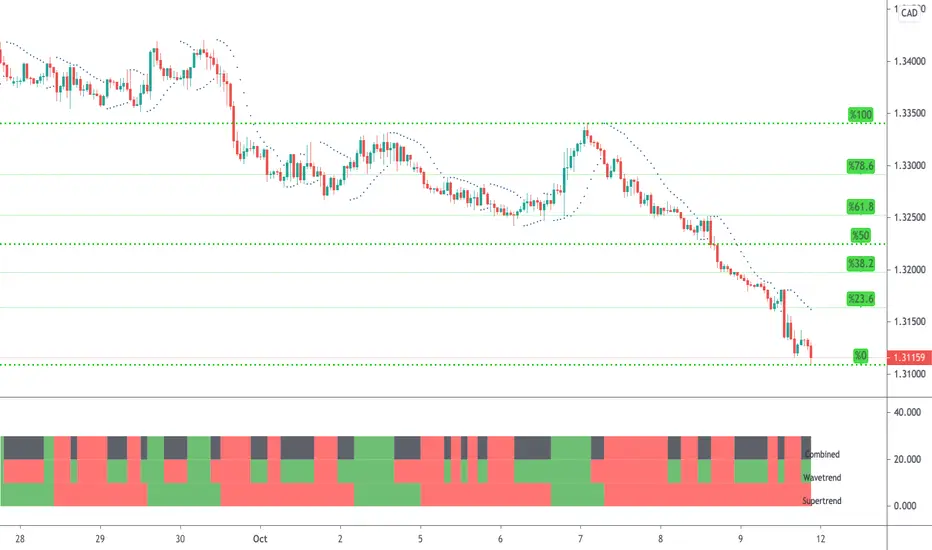
WaveTrend & Supertrend Comparison/CombinedThis compares two reasonably reliable strategies and shows where they are in agreement.
When the top line is GREEN - Then consider BUYing
When the top line is RED - Then consider SELLing
There are also alerts available.
Multi StrategyDuring the course of a trade, we can find ourselves changing strategies depending on the market. Instead of using many different templates, I have a simple indicator that clearly says "Buy", "Sell" or "Stay Out". The great thing about this approach, is we instantly observe the majority are in agreement and that decides which way to place our trade.
This indicator includes the following strategies:
- QQE
- Ichimoku using much faster settings.
- Parabolic SAR
- Supertrend
- TTM Oscillator
- The Squeeze strategy
- The Alligator Strategy
Using this indicator is simple, if the lines are mainly green then buy, if mainly red then sell OR don't trade. So...
Green Line - This strategy is in a buy position
Orange or Black Line - This strategy is undecided
Red Line - This strategy is in a sell position
There are also some green and red circles for reference that appear showing when that bar has broken through the Ichimoku cloud.
The trader's approach is simple, when all indicators are green or red, then take the trade. As soon as one indicator changes, then re-evaluate using your normal process, such as price action, to determine whether to close the trade or continue.
I can customise this further or add other strategies, please message me.

Trends & RangesTrends & Ranges uses EMA ATR bands as a SuperTrend indicator.
How to use:
This indicator can be used to give you a direction bias, with the added function to create ranges which often lead to reversals or flat trading periods. Trade the break-out or wait for pull backs in the direction of the trend.
I'm not great at explaining stuff and will probably make things only more complicated, so I won't bother for now,
but if you have a question on how the script works I will gladly give it a try.
The option "Flexible Trends" will disable the min/max function (trailing or non trailing).
Flexible Trends enabled:
Flexible Trends disabled:
Settings are not optimized for any asset or time frame, you will have to do that for yourself. Feel free to share them in the comments.
Thanks for showing interest, enjoy and good luck! :)


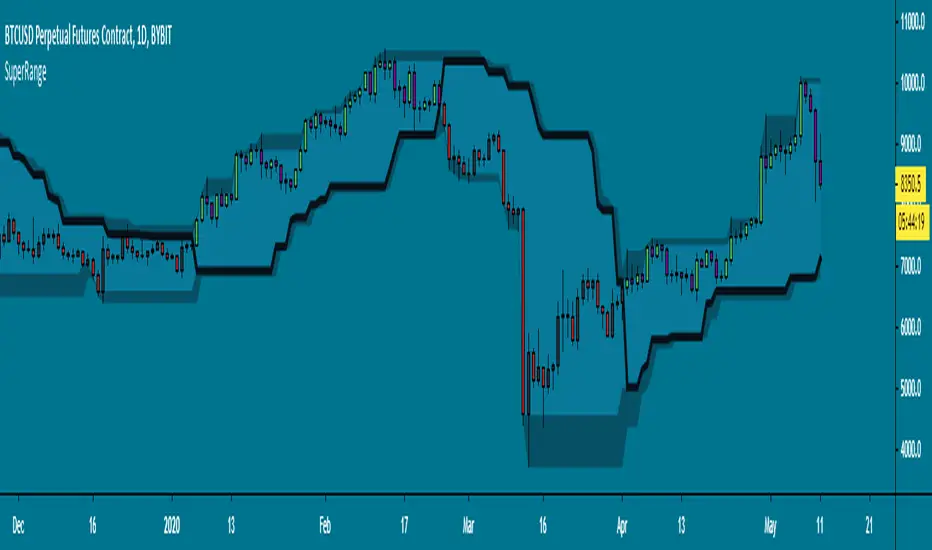
SuperRange - evoA SuperTrend like indicator based on highest and lowest candle close from a few bars back. It looks almost the same as Donchian Channels but with a dominant trend direction inside (Black line).
Uptrend: Candle closed higher than highest close
Downtrend: Candle closed lower than lowest close
This works best on higher time frames since a daily close is more powerful than a 15 minute close.
A few examples how you could use this:
Use support & resistance
Apply a moving average
Buy and sell the break-out
All perfect world examples, this does not happen all the time off course.. Its just for the idea. There are many ways to trade this so feel free to share in the comments, good luck and follow the trend! :)

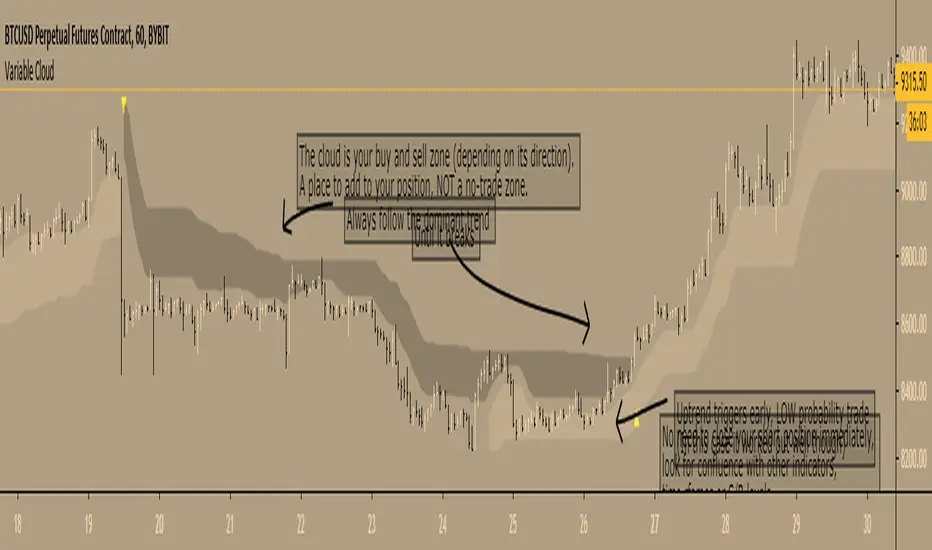
Variable Cloud - evoA Super Trend based on the high and low of a Moving Average, to get an easy view what the current trend is and where to buy and sell.
TIPS
- The 'Closing Source' option is the candle value that triggers the clouds. 'High/Low System' means that a downtrend is over when the candle LOW closes greater than the downtrend (dark cloud), an uptrend is over when the candle HIGH closes less than the uptrend (light cloud). The other options speak for themselves.
- Ideally place your stop loss outside the cloud, as you want to stay in the trend until it breaks to the opposite direction (but that's up to you of course).
- Reversal trades are low probability, you can see them as reversals or ranging before the market continues, I like to lower my risk on those set ups till it breaks the dominant trend.
Here are the scripts I used:
Everget's SuperTrend
LazyBear's VMA
Thanks LazyBear and Everget, I learn a lot from your scripts :)
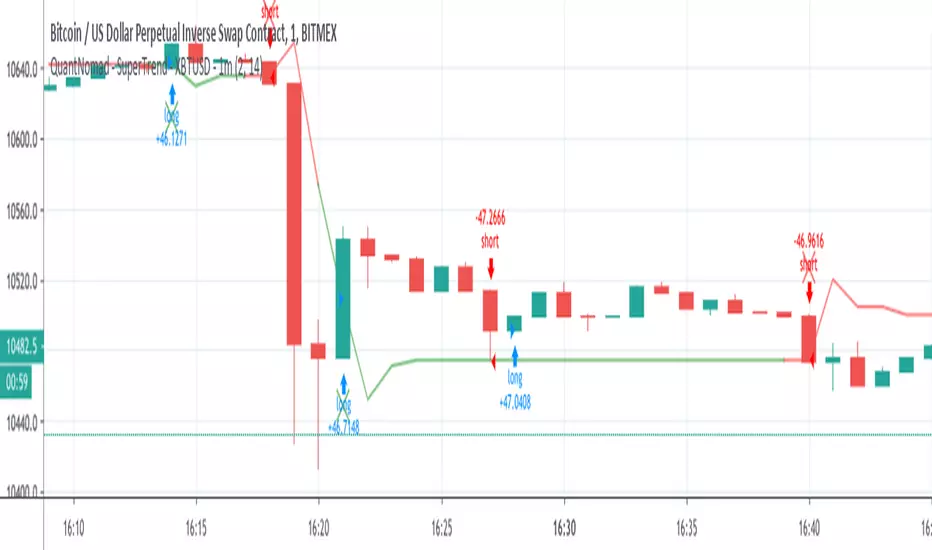
QuantNomad - SuperTrend - XBTUSD - 1mInteresting performance for Super Trend strategy for XBTUSD 1m chart.
Params: ST Mult: 2, ST Period 14.
Performance: 144% profit, 1988 trades, only 41% prof, 2.04% dd , 2.51 Sharpe.
On its own, it might be not a very good strategy, but the big amount of trades allows you to add more filters and improve it.
And remember:
Past performance does not guarantee future results.
QuantNomad - SuperTrend - TSLA - 1mInteresting performance for Super Trend strategy for Tesla ( TSLA ) 1m chart.
Params: ST Mult: 3, ST Period 120.
Performance:61% profit, 637 trades, only 33% prof, 4.84% dd , 0.4 Sharpe.
On its own, it might be not a very good strategy, but the big amount of trades allows you to add more filters and improve it.
The strategy is not bad both with "when" params when strategy executed on open of next bar and with stop orders when strategy enters on exact Super Trend level.
You can comment/uncomment lines in the code and switch from one approach to another.
And remember:
Past performance does not guarantee future results.


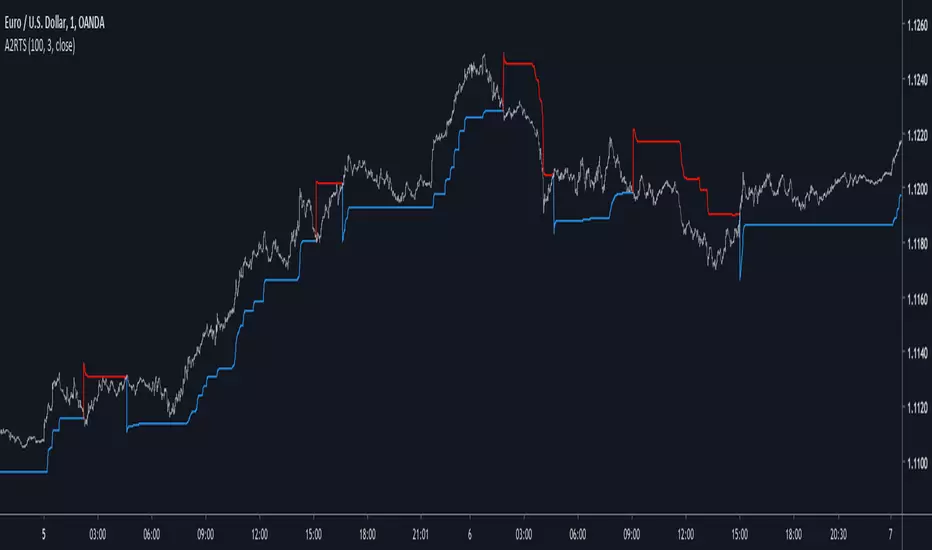
Adaptive Autonomous Recursive Trailing StopIntroduction
Trailing stop are important indicators in technical analysis, today i propose a new trailing stop A2RTS based on my last published indicator A2RMA (1), this last indicator directly used an error measurement thus providing a way to create enveloppes, which provide a direct way to create trailing stops based on highest/lowest rules.
The Indicator
If you need a more detailed explanation of this indicator i encourage you to check the A2RMA indicator post i made, parameters does not differ from the supertrend, thus having a length parameter and a factor parameter who is here described as gamma , gamma control how far away are the bands from each others thus spotting longer terms trends when gamma is higher.
On BTCUSD
Something worth mentioning is that the indicator sometimes behave like my MTA trailing stop indicator (2) who is closer to the price when a trend persist thus providing early exit points, however A2RTS behave a bit better.
Price can sometimes break the trailing stop, this can be interpreted as a support/resistance or just as an exit point, the support resistance methodology on trailing stop is not the most recommended.
Sometimes it is recommended to have an higher length rather than an high gamma like in this case for INTEL CORP, below gamma = 3 and length = 20
The microprocessor market like to use higher length's instead of higher gamma's , A2RMA is a non-linear filter, this would explain such behaviour.
Conclusion
Trailing stops might not suffer as much from whipsaw trades than MA crossovers but they still remain inefficient when market is not trending, results of the proposed indicator on major forex pairs are more than disappointing, but i hope this will serve as basis for other trailing stops that might act a little bit better. I conclude this post by thanking everyone who support my work and i encourage you to modify this indicator and share it with the community.
Thanks for reading !
Cited Articles
Doji's/Engulfing Candles/Supertrend v1.0The Script locates Bearish/Bullish Engulfing Candlesticks and Dojis in combination with Supertrend v1.0.
Original Authors: HPotter + Rajandran R

Noro's SuperTrend Strategy v2.0 LimitThis strategy same as "Noro's SuperTrend Strategy v1.0". But it is used limit orders. The price for the limit orders is the price of closing of the previous bar. The color filter of a candle is used.

RSI ST MTFUsing this script with some changes
I try to build the RSI SUPERTREND model with MTF function
I think its need more work to refine it but as idea its nice

ACW SUPERTREND VERSION 5 Updated 29 October 2018//Author - PRINZ MASTER TRADER
//ACW SUPERTREND VERSION 5
numerous code changes that enable more accurate signal delivery and accuracy
removed false signals
enabled higher roe targets on higher time frames
works best on H2 with ethusd bitmex and all time frames on xbtusd bitmex
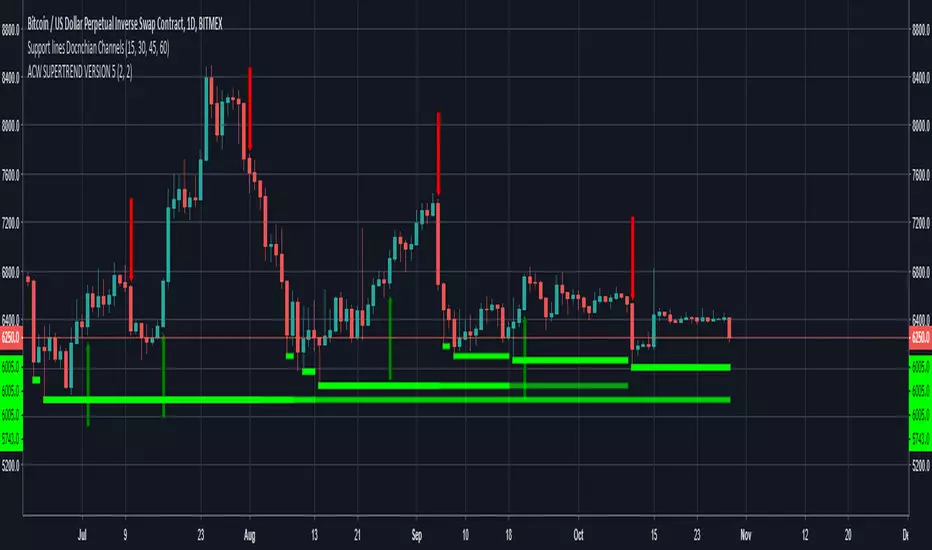
Alpha Capital Wealth - Supertrend Any Crypto Any TimeframeAlpha Capital Wealth - Supertrend Any Crypto Any Timeframe

ACW SUPERTREND v3 as per testing
xbtusd works fine on 5,15,30 and above
100% accuracy on 30mins
ethusd works on any time frame
100% accuracy on 30mins
updated the code script to provide go long , go short 2/3 candles as compared to acw supertrend v2
script is still being updated
