TSM 1987 RSI + Supertrend + High Volume StrategyRSI + Supertrend + High Volume Strategy is a rule-based trading strategy designed to capture high-probability trend reversals and continuations using a combination of trend, momentum, and volume confirmation.
The strategy uses Supertrend to identify the primary market direction, RSI to confirm momentum strength, and High Volume to validate participation from strong market players. Trades are triggered only when all conditions align, helping to filter out low-quality signals.
Each BUY and SELL signal is plotted on the chart along with the exact trade date, and the script is fully compatible with TradingView’s Strategy Tester for backtesting performance across different markets and timeframes.
🔑 Core Logic
BUY
Supertrend turns bullish
RSI is above the defined trend level
Volume is significantly higher than average
SELL
Supertrend turns bearish
RSI is below the defined trend level
Volume confirms strong selling pressure
🎯 Best Use
Works well for intraday and swing trading
Suitable for stocks, indices, crypto, and forex
Designed for trend-following with confirmation
⚠️ Disclaimer
This strategy is for educational purposes only.
Always use proper risk management and stop-loss.
Past performance does not guarantee future results.
Buscar en scripts para "supertrend"

TSM RSI + Supertrend + High Volume Strategy (BACKTESTED) 1987RSI + Supertrend + High Volume Strategy is a rule-based trading strategy designed to capture high-probability trend reversals and continuations using a combination of trend, momentum, and volume confirmation.
The strategy uses Supertrend to identify the primary market direction, RSI to confirm momentum strength, and High Volume to validate participation from strong market players. Trades are triggered only when all conditions align, helping to filter out low-quality signals.
Each BUY and SELL signal is plotted on the chart along with the exact trade date, and the script is fully compatible with TradingView’s Strategy Tester for backtesting performance across different markets and timeframes.
Core Logic
BUY
Supertrend turns bullish
RSI is above the defined trend level
Volume is significantly higher than average
SELL
Supertrend turns bearish
RSI is below the defined trend level
Volume confirms strong selling pressure
🎯 Best Use
Works well for intraday and swing trading
Suitable for stocks, indices, crypto, and forex
Designed for trend-following with confirmation
⚠️ Disclaimer
This strategy is for educational purposes only.
Always use proper risk management and stop-loss.
Past performance does not guarantee future results.

Next Candle PredictorAdvanced TradingView Indicator for Precise Buy and Sell Signals
Overview:
The Predicta Futures - Next Candle Predictor is a cutting-edge TradingView indicator designed to forecast the next candle's direction in futures and cryptocurrency markets. Leveraging a multi-indicator confluence strategy, this tool provides traders with actionable long and short prediction percentages, enhanced by dynamic ADX-based thresholds and visual projection candles. Ideal for scalping, day trading, or swing trading on platforms like MEXC or Binance futures, it combines Supertrend, MACD, RSI, Stochastic, ADX, and volume analysis to deliver high-probability buy and sell signals while minimizing false positives.
Key Features:
• Multi-Indicator Confluence Scoring:
Integrates Supertrend for trend direction, EMAs (8, 21, 50) for alignment, MACD for momentum crossovers, RSI for overbought/oversold conditions, Stochastic for divergence detection, ADX for trend strength, and volume ratios for confirmation. A customizable confluence score (0-6) ensures signals meet user-defined criteria, reducing whipsaws in volatile markets.
• Dynamic Prediction Thresholds:
ADX-driven adjustments lower the required prediction percentage (e.g., 60% in strong trends) for "PERFECT TIME" entries, adapting to market conditions like ranging or trending phases.
• Visual Analysis Table:
A sleek, color-coded dashboard displays progress bars for each indicator, prediction percentages, and status (e.g., "PERFECT TIME" or "WAIT"). Supports long and short analyses with intuitive ASCII bars for quick scans.
• Projection Candles:
Simulates potential next-candle outcomes with volatility-scaled (via Bollinger Bands width) green long and red short candles, aiding in visualizing price targets.
• Buy/Sell Signals and Alerts:
Generates labeled "BUY" and "SELL" arrows on EMA crossovers within confirmed trends, with separate alerts for basic signals and high-confluence "PERFECT TIME" opportunities.
• Customizable Inputs:
Adjust ATR periods, Supertrend factors, minimum confluence scores, and volume ratios to tailor the indicator for stocks, forex, or crypto perpetual futures.
How It Works:
This TradingView script calculates long and short scores using weighted contributions from key indicators, normalizing them into prediction percentages. A confluence check—factoring trend, EMA alignment, MACD, Stochastic, volume, and ADX—triggers "PERFECT TIME" only when conditions align robustly. For example:
• In a downtrend (Supertrend red), with bearish MACD and Stochastic, and sufficient volume, the indicator highlights short opportunities.
• Dynamic thresholds ensure aggressive entries in strong trends (ADX >25) and conservative ones in weak trends.
• Backtested for reliability, it excels in identifying reversals and continuations, making it a must-have for traders seeking an edge in futures trading strategies.
Usage Instructions:
1. Add the indicator to your TradingView chart. (Search: Next Candle Predictor)
2. Customize settings via the inputs panel (e.g., set minConfluence to 5 for stricter signals).
3. Monitor the analysis table for predictions and confluence scores.
4. Act on "BUY/SELL" labels or "PERFECT TIME" alerts, combining with your risk management.
5. Enable projection candles for visual forecasting of the next bar.
Compatible with all timeframes, from 1-minute scalping to daily swings. Note: This is not financial advice; always verify signals with additional analysis.
Join thousands of traders enhancing their strategies—add it to your charts today and elevate your trading performance!
Please rate and review if it boosts your trades!
Thank you!

XAUUSD 5m — NY Supertrend+RSI Optimizer (1:2 RR) — $240k/orderThis strategy is built for XAUUSD (Gold) on the 5-minute timeframe, focusing exclusively on the New York trading session (08:00–17:00 NY time) — the most volatile and liquid hours of the day.
It combines a Supertrend trend filter with RSI momentum signals to identify high-probability entries, using a 1:2 risk–reward ratio for disciplined trade management.
🧠 Strategy Logic:
Buy Condition: RSI crosses above 55 while Supertrend indicates an uptrend
Sell Condition: RSI crosses below 45 while Supertrend indicates a downtrend
Session Filter: Trades only between 08:00 → 17:00 New York time
Risk/Reward: 1:2 (Take-Profit = 2× Stop-Loss distance from Supertrend line)
Position Size: $240,000 notional per order
Auto-Exit: Closes all trades at NY session end
⚡ Highlights:
Targets NY session volatility
Combines trend + momentum for cleaner entries
Strict 1:2 RR for consistent outcomes
Avoids overnight exposure
⚠️ Disclaimer:
This script is intended for educational and research purposes only.
Past performance is not indicative of future results.
Always forward-test on demo before using live capital.

XAUUSD 5m — CET 13:00→01:00 Supertrend + RSI (1:2 RR) — $240KThis strategy is designed for XAUUSD (Gold) on the 5-minute chart, optimized for trading during the most active hours (13:00–01:00 CET).
It combines a Supertrend direction filter with RSI crossovers for precise entries, and applies a 1:2 risk–reward ratio for consistent risk management.
🧠 Logic Overview:
Buy Signal: RSI crosses above 55 while Supertrend is bullish
Sell Signal: RSI crosses below 45 while Supertrend is bearish
Trading Hours: 13:00 → 01:00 CET (corresponding to 07:00 → 19:00 New York time)
Risk Management: Fixed 1:2 RR (TP = 2× SL distance from Supertrend line)
Session Management: Automatically closes all trades after 01:00 CET
Order Size: $240,000 notional exposure per position
💡 Best used for:
Scalping or intraday trading on XAUUSD during high-volatility hours.
The setup works best when combined with strong price action or volume confirmation.
⚠️ Disclaimer:
This script is for educational and testing purposes only.
Past performance does not guarantee future results.
Always test on demo before using live funds.

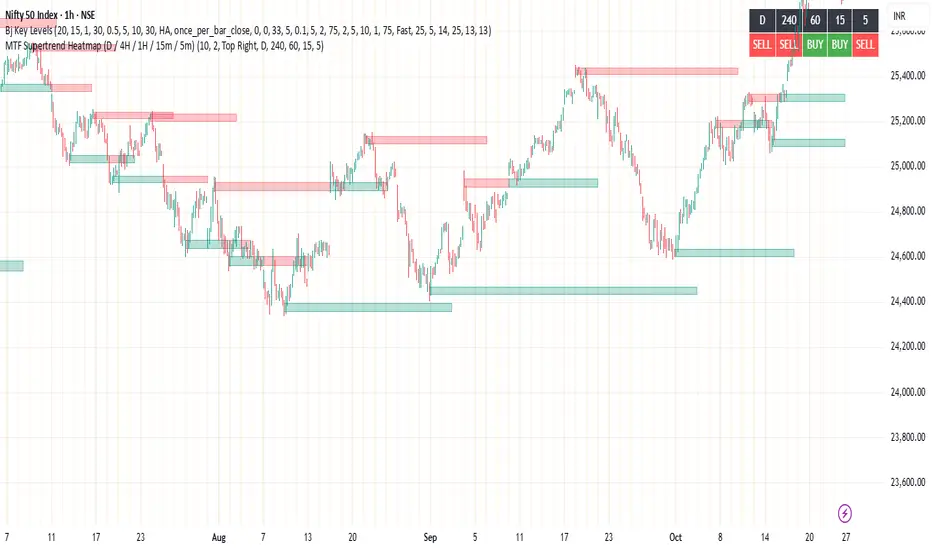
MTF Supertrend Heatmap (D / 4H / 1H / 15m / 5m)MTF Supertrend Heatmap (D / 4H / 1H / 15m / 5m)
A clean dashboard that tells you whether the same Supertrend (ATR Length, Multiplier) is BUY or SELL across five timeframes—all on one chart. Higher-TF values are fetched with request.security() and, when Confirm HTF bar close is ON, they do not repaint after that bar closes.
Optional toggles let you plot the current-TF Supertrend line and show bar-anchored flip markers (BUY/SELL) for each timeframe. Includes alerts for ALL-TF alignment and MAJORITY (≥3/5) agreement. Timeframes and Supertrend parameters are fully configurable. Use the heatmap for quick confirmation, reduce noise by keeping markers off unless needed.
Multiple Symbol Trend Screener [Pineify]Multiple Symbol Trend Screener Pineify – Ultimate Multi-Indicator Scanner for TradingView
Empower your trading with deep market insights across multiple symbols using this feature-rich Pine Script screener. The Multiple Symbol Trend Screener Pineify enables traders to monitor and compare trends, reversals, and consolidations in real-time across the biggest equity symbols on TradingView, through a synergistic blend of popular technical indicators.
Key Features
Monitor up to 15 symbols and their trends simultaneously
Integrates 7 professional-grade indicators: MA Distance, Aroon, Parabolic SAR (PSAR), ADX, Supertrend, Keltner Channel, and BBTrend
Color-coded table display for instant visual assessment
Customizable lookback periods, indicator types, and calculation methods
SEO optimized for multi-symbol trend detection, screener, and advanced TradingView indicator
How It Works
This indicator leverages TradingView’s Pine Script v6 and request.security() to process multiple symbols across selected timeframes. Data populates a dynamic table, updating each cell based on the calculated value of every underlying indicator. MA Distance highlights deviation from moving averages; Aroon flags emerging trend strength; PSAR marks potential trend reversals; ADX assesses trend momentum; Supertrend detects bullish/bearish phases; Keltner Channel and BBTrend offer volatility and power insights.
Set up your preferred symbols and timeframes
Each indicator runs its calculation per symbol using its parameter group
All results are displayed in a table for a comprehensive dashboard view
Trading Ideas and Insights
Traders can use this screener for cross-market comparison, directional bias, entry/exit filtering, and comprehensive trend evaluation. The screener is excellent for swing trading, day trading, and portfolio tracking. It enables confirmation across multiple frameworks — for example, spotting momentum with ADX before confirming direction with Supertrend and PSAR.
Identify correlated movements or divergences across selected assets
Spot synchronized trend changes for basket trading ideas
Filter symbols by volatility, strength, or trend status for precise trade selection
How Multiple Indicators Work Together
The screener’s edge lies in its intelligent correlation of popular indicators. MA Distance measures the proximity to chosen moving averages, ideal for spotting overbought/oversold conditions. Aroon reveals the strength of new price trends, PSAR indicates reversal signals, and ADX quantifies the momentum of these trends. Supertrend provides a directional phase, while Keltner Channel & BBTrend analyze volatility shifts and band compressions. This amalgamation allows for a robust, multi-dimensional market snapshot, capturing details missed by single-indicator tools.
By displaying all key metrics side-by-side, the screener enables holistic decision-making, revealing confluence zones and contradiction areas across multiple tickers and timeframes.
Unique Aspects
Original implementation combining seven independent trend and momentum indicators for each symbol
Rich customization for symbols, timeframes, and all indicator parameters
Intuitive color-coding for quick reading of bullish/bearish/neutral signals
Comprehensive dashboard for instant actionable insights
How to Use
Load the indicator onto your TradingView chart
Go to the script’s settings and input your preferred symbols and relevant timeframes
Set your desired parameters for each indicator group: Moving Average type, Aroon length, PSAR values, ADX smoothing, etc.
Observe the results in the top-right table, then use it to filter candidates and validate trade setups
The screener is suitable for all timeframes and asset classes available on TradingView. Make sure your chart’s timeframe matches the one used in the scanner for optimal accuracy.
Customization
Choose up to 15 symbols to monitor in a single dashboard
Customize lookback periods, indicator types, colors, and display settings
Configure alerting options and thresholds for advanced trade automation
Conclusion
The Multiple Symbol Trend Screener Pineify sets a new standard for multi-asset screening on TradingView. By elegantly merging seven proven technical indicators, the screener delivers powerful trend detection, reversal analysis, and volatility monitoring — all in one dashboard. Take your trading to new heights with in-depth, customizable market surveillance.

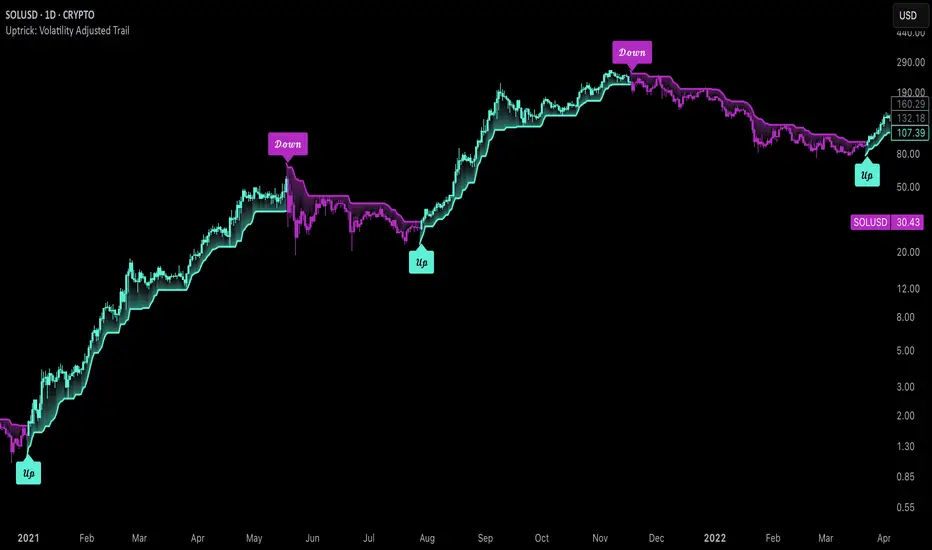
Uptrick: Volatility Adjusted TrailIntroduction
The "Uptrick: Volatility Adjusted Trail" is a dynamic trailing band indicator. It adapts in real time to changing market conditions by adjusting both to volatility and trend consistency. Inspired by Supertrend-style logic, it enhances traditional approaches by introducing adaptive mechanisms for more context-sensitive behavior in both trending and consolidating environments.
Overview
This indicator combines an exponential moving average (EMA) as its basis with an Average True Range (ATR)-derived multiplier that adjusts dynamically. Unlike fixed-multiplier tools, this indicator modifies its band distances in real time according to volatility expansion and trend persistence. The result is a trailing system that adapts to the prevailing market regime, providing traders with clearer signals for trend bias, stop placement, and potential momentum shifts.
Originality
The script’s originality lies in its multi-layered approach to trail calculation. It introduces a real-time ATR multiplier adjustment driven by two factors: a volatility expansion ratio and a trend persistence model. The expansion ratio compares the current ATR to its moving average, making the indicator more sensitive during volatile conditions and less sensitive during quieter periods. The trend persistence model assesses directional consistency to widen the bands during sustained trends. This dual adjustment method creates a system that evolves with market behavior, making it more responsive and adaptive than static-band or fixed-multiplier alternatives.
Components & Inspiration
This indicator was designed with specific components that work together:
Exponential Moving Average (EMA): Chosen as the central baseline because it responds faster to recent price changes than a simple moving average, providing a more current reference for trailing bands.
Average True Range (ATR): Used as the volatility measure because it accounts for both intraday and gap movement, making it a robust and widely accepted standard for market volatility.
Dynamic Multiplier: The multiplier is adjusted by both volatility expansion and trend persistence to produce bands that tighten during low volatility and widen during consistent trends. This combination was chosen to give the indicator the ability to self-regulate across different market regimes.
Trend Persistence Model: Integrated to assess directional consistency, ensuring the bands expand during strong trends, which can prevent premature stop-outs.
Flip Confirmation Logic: Added to filter out noise by requiring multiple bar closes beyond a band before confirming a state change, reducing false reversals.
For inspiration, the indicator draws on the core idea behind Supertrend—using a baseline and volatility-derived bands to define trailing stop levels. However, while Supertrend uses a fixed ATR multiplier, this indicator introduces a dynamic multiplier system and persistence weighting, making it more adaptive and suited for varying conditions.
Inputs and Parameters
Basis EMA Length
Defines the period for the EMA that serves as the core price reference.
ATR Length
Sets the lookback period for the Average True Range calculation used in band spacing.
Base ATR Mult
The base multiplier applied to ATR before adjustments. Forms the starting scale of the band offset.
Volatility Expansion Sensitivity
Controls how strongly the band spacing reacts to short-term volatility bursts. Higher values create more pronounced band expansions or contractions.
Trend Persistence Window
Determines how many bars are used to calculate directional trend consistency using a smoothed step function.
Persistence Impact
Scales how much influence the trend persistence has on band widening. Values range from 0 (no effect) to 1 (maximum effect).
Min Effective Mult
Sets the minimum value that the adjusted multiplier can reach. Prevents the bands from becoming too narrow.
Max Effective Mult
Sets the maximum value the adjusted multiplier can reach. Prevents the bands from over-expanding during high volatility.
Bars Above/Below to Confirm Flip
Number of consecutive bars required to close above or below the opposing trail before confirming a bullish or bearish flip. Helps reduce noise and false signals.
Show Flip Labels
Enables or disables the display of flip markers on the chart.
Label Size
Allows users to adjust the size of flip labels from Tiny to Huge.
Label ATR Offset
Adjusts the vertical placement of flip labels in relation to the trail using an ATR-based offset.
Features and Logic
EMA Basis: All calculations stem from an EMA that tracks the centerline of price action.
Dynamic ATR Multiplier: The ATR multiplier adjusts in real time based on volatility expansion and trend persistence.
Clamped Multiplier: The adjusted multiplier is limited between user-defined minimum and maximum values to keep the band scale practical.
Upper and Lower Bands: Bands are plotted above and below the EMA using the dynamic multiplier and ATR values.
Trailing Logic: The script uses Supertrend-style trailing logic, updating the active band in the current trend direction and resetting the opposite band.
Trend State Detection: A state variable tracks the current market regime (bullish, bearish, or neutral). Transitions are confirmed only after a user-specified number of bars close beyond the respective bands.
Visual Elements: Trail lines and fill zones are color-coded (bullish cyan, bearish magenta). Candlestick and bar colors match the trend state. Optional flip labels mark confirmed transitions.
Alerts: Built-in alert conditions allow users to receive real-time notifications for bullish or bearish flips.
Usage Guidelines
This indicator can be used for:
Defining context-aware dynamic stop levels that adjust with market behavior.
Identifying trend direction and reversal points based on adaptive logic.
Filtering entry or exit signals during trending vs. consolidating conditions.
Supplementing trade management strategies with responsive visual markers.
Entering long or short positions based on the appearance of flip labels and managing stop losses by following the adaptive trail.
Traders may tune the parameters to suit different trading styles or timeframes. For example, lower ATR and EMA values may suit intraday setups, while longer settings may benefit swing or positional trading.
Summary
The "Uptrick: Volatility Adjusted Trail" provides a flexible, adaptive trailing band system that accounts for both volatility and directional consistency. By combining an EMA baseline with a dynamic ATR multiplier influenced by volatility expansion and trend persistence, it creates a context-sensitive trailing system that aligns with changing market conditions. Customizable confirmation, flip labels, alerts, and dynamic visual cues make it a versatile tool for trend-following, breakout filtering, and trailing stop logic.
Disclaimer
This indicator is provided for educational and research purposes only. It does not constitute financial advice. Trading involves risk, and past performance does not guarantee future results. Always conduct your own analysis and risk management before making trading decisions.
Mutanabby_AI | Fresh Algo V24Mutanabby_AI | Fresh Algo V24: Advanced Multi-Mode Trading System
Overview
The Mutanabby_AI Fresh Algo V24 represents a sophisticated evolution of multi-component trading systems that adapts to various market conditions through advanced operational configurations and enhanced analytical capabilities. This comprehensive indicator provides traders with multiple signal generation approaches, specialized assistant functions, and dynamic risk management tools designed for professional market analysis across diverse trading environments.
Primary Signal Generation Framework
The Fresh Algo V24 operates through two fundamental signal generation approaches that accommodate different market perspectives and trading philosophies. The Trending Signals Mode serves as the primary trend-following mechanism, combining Wave Trend Oscillator analysis with Supertrend directional signals and Squeeze Momentum breakout detection. This mode incorporates ADX filtering that requires values exceeding 20 to ensure sufficient trend strength exists before signal activation, making it particularly effective during sustained directional market movements where momentum persistence creates profitable trading opportunities.
The Contrarian Signals Mode provides an alternative approach targeting reversal opportunities through extreme market condition identification. This mode activates when the Wave Trend Oscillator reaches critical threshold levels, specifically when readings surpass 65 indicating potential bearish reversal conditions or drop below 35 suggesting bullish reversal opportunities. This methodology proves valuable during overextended market phases where mean reversion becomes statistically probable.
Advanced Filtering Mechanisms
The system incorporates multiple sophisticated filtering mechanisms designed to enhance signal quality and reduce false positive occurrences. The High Volume Filter requires volume expansion confirmation before signal activation, utilizing exponential moving average calculations to ensure institutional participation accompanies price movements. This filter substantially improves signal reliability by eliminating low-conviction breakouts that lack adequate volume support from professional market participants.
The Strong Filter provides additional trend confirmation through 200-period exponential moving average analysis. Long position signals require price action above this benchmark level, while short position signals necessitate price action below it. This ensures strategic alignment with longer-term trend direction and reduces the probability of trading against major market movements that could invalidate shorter-term signals.
Cloud Filter Configuration System
The Fresh Algo V24 offers four distinct cloud filter configurations, each optimized for specific trading timeframes and market approaches. The Smooth Cloud Filter utilizes the mathematical relationship between 150-period and 250-period exponential moving averages, providing stable trend identification suitable for position trading strategies. This configuration generates signals exclusively when price action aligns with cloud direction, creating a more deliberate but highly reliable signal generation process.
The Swing Cloud Filter employs modified Supertrend calculations with parameters specifically optimized for swing trading timeframes. This filter achieves optimal balance between responsiveness and stability, adapting effectively to medium-term price movements while filtering excessive market noise that typically affects shorter-term analytical systems.
For active intraday traders, the Scalping Cloud Filter utilizes accelerated Supertrend calculations designed to capture rapid trend changes effectively. This configuration provides enhanced signal generation frequency suitable for compressed timeframe strategies. The advanced Scalping+ Cloud Filter incorporates Hull Moving Average confirmation, delivering maximum responsiveness for ultra-short-term trading while maintaining signal quality through additional momentum validation processes.
Specialized Assistant Functionality
The system includes two distinct assistant modes that provide supplementary market analysis capabilities. The Trend Assistant Mode activates advanced cloud analysis overlays that display dynamic support and resistance zones calculated through adaptive volatility algorithms. These levels automatically adjust to current market conditions, providing visual guidance for identifying trend continuation patterns and potential reversal areas with mathematical precision.
The Trend Tracker Mode concentrates on long-term trend identification by displaying major exponential moving averages with color-coded fill areas that clarify directional bias. This mode maintains visual simplicity while providing comprehensive trend context evaluation, enabling traders to quickly assess broader market direction and align shorter-term strategies accordingly.
Dynamic Risk Management System
The integrated risk management system automatically adapts across all operational modes, calculating stop loss and take profit targets using Average True Range multiples that adjust to current market volatility. This approach ensures consistent risk parameters regardless of selected operational mode while maintaining relevance to prevailing market conditions.
Stop loss placement occurs at dynamically calculated distances from entry points, while three progressive take profit targets establish at customizable ATR multiples respectively. The system automatically updates these levels upon trend direction changes, ensuring current market volatility influences all risk calculations and maintains appropriate risk-reward ratios throughout trade management.
Comprehensive Market Analysis Dashboard
The sophisticated dashboard provides real-time market analysis including volatility measurements, institutional activity assessment, and multi-timeframe trend evaluation across five-minute through four-hour periods. This comprehensive market context assists traders in selecting appropriate operational modes based on current market characteristics rather than relying exclusively on historical performance data.
The multi-timeframe analysis ensures mode selection considers broader market context beyond the primary trading timeframe, improving overall strategic alignment and reducing conflicts between different temporal market perspectives. The dashboard displays market state classification, volatility percentages, institutional activity levels, current trading session information, and trend pressure indicators with professional formatting and clear visual hierarchy.
Enhanced Trading Assistants
The Fresh Algo V24 includes specialized trading assistant features that complement the primary signal generation system. The Reversal Dot functionality identifies potential reversal points through Wave Trend Oscillator analysis, displaying visual indicators when crossover conditions occur at extreme levels. These reversal indicators provide early warning signals for potential trend changes before they appear in the primary signal system.
The Dynamic Take Profit Labels feature automatically identifies optimal profit-taking opportunities through RSI threshold analysis, marking potential exit points at multiple levels for long positions and corresponding levels for short positions. This automated profit management system helps traders optimize exit timing without requiring constant manual monitoring of technical indicators.
Advanced Alert System
The comprehensive alert system accommodates all operational modes while providing granular notification control for various signal types and risk management events. Traders can configure separate alerts for normal buy signals, strong buy signals, normal sell signals, strong sell signals, stop loss triggers, and individual take profit target achievements.
Cloud crossover alerts notify traders when trend direction changes occur, providing early indication of potential strategy adjustments. The alert system includes detailed trade setup information, timeframe data, and relevant entry and exit levels, ensuring traders receive complete context for informed decision-making without requiring constant chart monitoring.
Technical Foundation Architecture
The Fresh Algo V24 combines multiple proven technical analysis components including Wave Trend Oscillator for momentum assessment, Supertrend for directional bias determination, Squeeze Momentum for volatility analysis, and various exponential moving averages for trend confirmation. Each component contributes specific market insights while the unified system provides comprehensive market evaluation through their mathematical integration.
The multi-component approach reduces dependency on individual indicator limitations while leveraging the analytical strengths of each technical tool. This creates a robust analytical framework capable of adapting to diverse market conditions through appropriate mode selection and parameter optimization, ensuring consistent performance across varying market environments.
Market State Classification
The indicator incorporates advanced market state classification through ADX analysis, distinguishing between trending, ranging, and transitional market conditions. This classification system automatically adjusts signal sensitivity and filtering parameters based on current market characteristics, optimizing performance for prevailing conditions rather than applying static analytical approaches.
The volatility measurement system calculates current market activity levels as percentages, providing quantitative assessment of market energy and helping traders select appropriate operational modes. Institutional activity detection through volume analysis ensures signal generation aligns with professional market participation patterns.
Implementation Strategy Considerations
Successful implementation requires careful matching of operational modes to prevailing market conditions and individual trading objectives. Trending modes demonstrate optimal performance during directional markets with sustained momentum characteristics, while contrarian modes excel during range-bound or overextended market conditions where reversal probability increases.
The cloud filter configurations provide varying degrees of confirmation strength, with smoother settings reducing false signal occurrence at the expense of some responsiveness to price changes. Traders must balance signal quality against signal frequency based on their risk tolerance and available trading time, utilizing the comprehensive customization options to optimize performance for their specific requirements.
Multi-Timeframe Integration
The system provides seamless multi-timeframe analysis through the integrated dashboard, displaying trend alignment across multiple time horizons from five-minute through four-hour periods. This analysis helps traders understand broader market context and avoid conflicts between different temporal perspectives that could compromise trade outcomes.
Session analysis identifies current trading session characteristics, providing context for expected market behavior patterns and helping traders adjust their approach based on typical session volatility and participation levels. This geographic market awareness enhances strategic decision-making and improves timing for trade execution.
Advanced Visualization Features
The indicator includes sophisticated visualization capabilities through gradient candle coloring based on MACD analysis, providing immediate visual feedback on momentum strength and direction. This enhancement allows rapid market assessment without requiring detailed indicator analysis, improving efficiency for traders managing multiple instruments simultaneously.
The cloud visualization system uses color-coded fill areas to clearly indicate trend direction and strength, with automatic adaptation to selected operational modes. This visual clarity reduces analytical complexity while maintaining comprehensive market information display through professional chart presentation.
Performance Optimization Framework
The Fresh Algo V24 incorporates performance optimization features including signal strength classification, automatic parameter adjustment based on market conditions, and dynamic filtering that adapts to current volatility levels. These optimizations ensure consistent performance across varying market environments while maintaining signal quality standards.
The system automatically adjusts sensitivity levels based on selected operational modes, ensuring appropriate responsiveness for different trading approaches. This adaptive framework reduces the need for manual parameter adjustments while maintaining optimal performance characteristics for each operational configuration.
Conclusion
The Mutanabby_AI Fresh Algo V24 represents a comprehensive solution for professional trading analysis, combining multiple analytical approaches with advanced visualization and risk management capabilities. The system's strength lies in its adaptive multi-mode design and sophisticated filtering mechanisms, providing traders with versatile tools for various market conditions and trading styles.
Success with this system requires understanding the relationship between different operational modes and their optimal application scenarios. The comprehensive dashboard and alert system provide essential market context and trade management support, enabling systematic approach to market analysis while maintaining flexibility for individual trading preferences.
The indicator's sophisticated architecture and extensive customization options make it suitable for traders at all experience levels, from those seeking systematic signal generation to advanced practitioners requiring comprehensive market analysis tools. The multi-timeframe integration and adaptive filtering ensure consistent performance across diverse market conditions while providing clear guidelines for strategic implementation.

Four Supertrend By Baljit AujlaThis Pine Script is an implementation of a "Four Supertrend" indicator by Baljit Aujla. It calculates and plots four Supertrend indicators based on the Average True Range (ATR) method, allowing for different ATR periods and multipliers for each line.
Here is an explanation of the key components:
Inputs
1:- ATR Periods: Four different periods for ATR, adjustable by the user (defaults: 10, 11, 12, 13).
2:- ATR Multipliers: Four different multipliers for the ATR, adjustable by the user (defaults: 1.0, 2.0, 3.0, 4.0).
3:- Source: The data source used for calculation, default is the average of high and low prices (hl2).
4:- Change ATR Calculation Method: Option to switch between the traditional ATR and a simple moving average of true range (SMA of TR).
5:- Signal Display- Options to show buy/sell signals and highlight trends.
Logic:
The script computes four separate Supertrend lines using the ATR method for each line. For each of the four lines, it calculates an uptrend and downtrend threshold, and the trend direction changes when the close price crosses these thresholds.
For each trend line:
1. Uptrend and Downtrend Calculation: The script uses ATR-based bands above and below the price. The uptrend line is calculated by subtracting the ATR multiplied by a given multiplier from the source price, and the downtrend line is calculated by adding the ATR multiplied by a multiplier to the source price.
2. Trend Reversal Logic: The trend switches based on the price action relative to the uptrend and downtrend lines. If the price moves above the downtrend, it signals a switch to an uptrend, and vice versa for a downtrend.
3. Signal Generation: Buy signals occur when the trend changes from negative to positive (down to up), and sell signals occur when the trend changes from positive to negative (up to down).
Plots:
The script plots:
Uptrend and Downtrend Lines: These are visualized as green and red lines for each trend.
Buy/Sell Signals: Small circles are drawn on the chart when a trend change occurs (buy and sell signals).
Trend Highlighting: Background highlighting is applied to show when the market is in an uptrend (green) or downtrend (red).
Alerts:
The script has commented-out alert conditions (alertcondition), which can be enabled to send notifications when a buy or sell signal occurs, or when a trend change happens.
Enhancements:
1. Background Highlighting: This is an option to visually emphasize uptrends and downtrends by filling the background with respective colors.
2. Signal Visibility: You can toggle whether to show the buy/sell signals on the chart.
3. ATR Calculation Method: Option to change the ATR calculation method (using SMA of TR vs the default ATR).
The script is useful for identifying multi-timeframe trends with adjustable parameters and provides both signals and visual markers on the chart to aid in trading decisions.
Issues and Improvements:
The code seems to be truncated, specifically for the last Supertrend line (Line 4). To fully complete the functionality for the fourth line, the logic for up4, down4 and tread4 needs to be finished, similar to the other three lines.
Would you like help finishing the script for the fourth line or improving specific parts of it?

HTFBands█ OVERVIEW
Contains type and methods for drawing higher-timeframe bands of several types:
Bollinger bands
Parabolic SAR
Supertrend
VWAP
By copy pasting ready made code sections to your script you can add as many multi-timeframe bands as necessary.
█ HOW TO USE
Please see instructions in the code. (Important: first fold all sections of the script: press Cmd + K then Cmd + - (for Windows Ctrl + K then Ctrl + -)
█ FULL LIST OF FUNCTIONS AND PARAMETERS
atr2(length)
An alternate ATR function to the `ta.atr()` built-in, which allows a "series float"
`length` argument.
Parameters:
length (float) : (series int/float) Length for the smoothing parameter calculation.
Returns: (float) The ATR value.
pine_supertrend2(factor, atrLength, wicks)
An alternate SuperTrend function to `supertrend()`, which allows a "series float"
`atrLength` argument.
Parameters:
factor (float) : (series int/float) Multiplier for the ATR value.
atrLength (float) : (series int/float) Length for the ATR smoothing parameter calculation.
wicks (simple bool) : (simple bool) Condition to determine whether to take candle wicks into account when
reversing trend, or to use the close price. Optional. Default is false.
Returns: ( ) A tuple of the superTrend value and trend direction.
method getDefaultBandQ1(bandType)
For a given BandType returns its default Q1
Namespace types: series BandTypes
Parameters:
bandType (series BandTypes)
method getDefaultBandQ2(bandType)
For a given BandType returns its default Q2
Namespace types: series BandTypes
Parameters:
bandType (series BandTypes)
method getDefaultBandQ3(bandType)
For a given BandType returns its default Q3
Namespace types: series BandTypes
Parameters:
bandType (series BandTypes)
method init(this, bandsType, q1, q2, q3, vwapAnchor)
Initiates RsParamsBands for each band (used in htfUpdate() withi req.sec())
Namespace types: RsParamsBands
Parameters:
this (RsParamsBands)
bandsType (series BandTypes)
q1 (float) : (float) Depending on type: BB - length, SAR - AF start, ST - ATR's prd
q2 (float) : (float) Depending on type: BB - StdDev mult, SAR - AF step, ST - mult
q3 (float) : (float) Depending on type: BB - not used, SAR - AF max, ST - not used
vwapAnchor (series VwapAnchors) : (VwapAnchors) VWAP ahcnor
method init(this, bandsType, tf, showRecentBars, lblsShow, lblsMaxLabels, lblSize, lnMidClr, lnUpClr, lnLoClr, fill, fillClr, lnWidth, lnSmoothen)
Initialises object with params (incl. input). Creates arrays if any.
Namespace types: HtfBands
Parameters:
this (HtfBands)
bandsType (series BandTypes) : (BandTypes) Just used to enable/disable - if BandTypes.none then disable )
tf (string) : (string) Timeframe
showRecentBars (int) : (int) Only show over this number of recent bars
lblsShow (bool) : (bool) Show labels
lblsMaxLabels (int) : (int) Max labels to show
lblSize (string) : (string) Size of the labels
lnMidClr (color) : (color) Middle band color
lnUpClr (color) : (color) Upper band color
lnLoClr (color) : (color) Lower band color
fill (bool)
fillClr (color) : (color) Fill color
lnWidth (int) : (int) Line width
lnSmoothen (bool) : (bool) Smoothen the bands
method htfUpdateTuple(rsPrms, repaint)
(HTF) Calculates Bands within request.security(). Returns tuple . If any or all of the bands are not available returns na as their value.
Namespace types: RsParamsBands
Parameters:
rsPrms (RsParamsBands) : (RsParamsBands) Parameters of the band.
repaint (bool) : (bool) If true does not update on realtime bars.
Returns: A tuple (corresponds to fields in RsReturnBands)
method importRsRetTuple(this, htfBi, mid, up, lo, dir)
Imports a tuple returned from req.sec() into an HtfBands object
Namespace types: HtfBands
Parameters:
this (HtfBands) : (HtfBands) Object to import to
htfBi (int) : (float) Higher timeframe's bar index (Default = na)
mid (float)
up (float) : (float) Value of upper band (Default = na)
lo (float) : (float) Value of lower band (Default = na)
dir (int) : (int) Direction (for bands like Parabolic SAR) (Default = na)
method addUpdDrawings(this, rsPrms)
Draws band's labels
Namespace types: HtfBands
Parameters:
this (HtfBands)
rsPrms (RsParamsBands)
method update(this)
Sets band's values to na on intrabars if `smoothen` is set.
Namespace types: HtfBands
Parameters:
this (HtfBands)
method newRsParamsBands(this)
A wraper for RsParamsBands.new()
Namespace types: LO_A
Parameters:
this (LO_A)
method newHtfBands(this)
A wraper for HtfBands.new()
Namespace types: LO_B
Parameters:
this (LO_B)
RsParamsBands
Used to pass bands' params to req.sec()
Fields:
bandsType (series BandTypes) : (enum BandTypes) Type of the band (BB, SAR etc.)
q1 (series float) : (float) Depending on type: BB - length, SAR - AF start, ST - ATR's prd
q2 (series float) : (float) Depending on type: BB - StdDev mult, SAR - AF step, ST - mult
q3 (series float) : (float) Depending on type: BB - not used, SAR - AF max, ST - not used
vwapAnchor (series VwapAnchors)
RsReturnBands
Used to return bands' data from req.sec(). Params of the bands are in RsParamsBands
Fields:
htfBi (series float) : (float) Higher timeframe's bar index (Default = na)
upBand (series float) : (float) Value of upper band (Default = na)
loBand (series float) : (float) Value of lower band (Default = na)
midBand (series float) : (float) Value of middle band (Default = na)
dir (series int) : (float) Direction (for bands like Parabolic SAR) (Default = na)
BandsDrawing
Contains plot visualization parameters and stores and keeps track of lines, labels and other visual objects (not plots)
Fields:
lnMidClr (series color) : (color) Middle band color
lnLoClr (series color) : (color) Lower band color
lnUpClr (series color) : (color) Upper band color
fillUpClr (series color)
fillLoClr (series color)
lnWidth (series int) : (int) Line width
lnSmoothen (series bool) : (bool) Smoothen the bands
showHistory (series bool) : (bool) If true show bands lines, otherwise only current level
showRecentBars (series int) : (int) Only show over this number of recent bars
arLbl (array) : (label Labels
lblsMaxLabels (series int) : (int) Max labels to show
lblsShow (series bool) : (bool) Show labels
lblSize (series string) : (string) Size of the labels
HtfBands
Calcs and draws HTF bands
Fields:
rsRet (RsReturnBands) : (RsReturnBands) Bands' values
rsRetNaObj (RsReturnBands) : (RsReturnBands) Dummy na obj for returning from request.security()
rsPrms (RsParamsBands) : (RsParamsBands) Band parameters (for htfUpdate() called in req.sec() )
drw (BandsDrawing) : (BandsDrawing) Contains plot visualization parameters and stores and keeps track of lines, labels and other visual objects (not plots)
enabled (series bool) : (bool) Toggles bands on/off
tf (series string) : (string) Timeframe
LO_A
LO Library object, whose only purpose is to serve as a shorthand for library name in script code.
Fields:
dummy (series string)
LO_B
LO Library object, whose only purpose is to serve as a shorthand for library name in script code.
Fields:
dummy (series string)

Trend Strength | Flux Charts💎 GENERAL OVERVIEW
Introducing the new Trend Strength indicator! Latest trends and their strengths play an important role for traders. This indicator aims to make trend and strength detection much easier by coloring candlesticks based on the current strength of trend. More info about the process in the "How Does It Work" section.
Features of the new Trend Strength Indicator :
3 Trend Detection Algorithms Combined (RSI, Supertrend & EMA Cross)
Fully Customizable Algorithm
Strength Labels
Customizable Colors For Bullish, Neutral & Bearish Trends
📌 HOW DOES IT WORK ?
This indicator uses three different methods of trend detection and combines them all into one value. First, the RSI is calculated. The RSI outputs a value between 0 & 100, which this indicator maps into -100 <-> 100. Let this value be named RSI. Then, the Supertrend is calculated. Let SPR be -1 if the calculated Supertrend is bearish, and 1 if it's bullish. After that, latest EMA Cross is calculated. This is done by checking the distance between the two EMA's adjusted by the user. Let EMADiff = EMA1 - EMA2. Then EMADiff is mapped from -ATR * 2 <-> ATR * 2 to -100 <-> 100.
Then a Total Strength (TS) is calculated by given formula : RSI * 0.5 + SPR * 0.2 + EMADiff * 0.3
The TS value is between -100 <-> 100, -100 being fully bearish, 0 being true neutral and 100 being fully bullish.
Then the Total Strength is converted into a color adjusted by the user. The candlesticks in the chart will be presented with the calculated color.
If the Labels setting is enabled, each time the trend changes direction a label will appear indicating the new direction. The latest candlestick will always show the current trend with a label.
EMA = Exponential Moving Average
RSI = Relative Strength Index
ATR = Average True Range
🚩 UNIQUENESS
The main point that differentiates this indicator from others is it's simplicity and customization options. The indicator interprets trend and strength detection in it's own way, combining 3 different well-known trend detection methods: RSI, Supertrend & EMA Cross into one simple method. The algorithm is fully customizable and all styling options are adjustable for the user's liking.
⚙️ SETTINGS
1. General Configuration
Detection Length -> This setting determines the amount of candlesticks the indicator will look for trend detection. Higher settings may help the indicator find longer trends, while lower settings will help with finding smaller trends.
Smoothing -> Higher settings will result in longer periods of time required for trend to change direction from bullish to bearish and vice versa.
EMA Lengths -> You can enter two EMA Lengths here, the second one must be longer than the first one. When the shorter one crosses under the longer one, this will be a bearish sign, and if it crosses above it will be a bullish sign for the indicator.
Labels -> Enables / Disables trend strength labels.

FlexiMA x FlexiST - Strategy [presentTrading]█ Introduction and How it is Different
The FlexiMA x FlexiST Strategy blends two analytical methods - FlexiMA and FlexiST, which are opened in my early post.
- FlexiMA calculates deviations between an indicator source and a dynamic moving average, controlled by a starting factor and increment factor.
- FlexiST, on the other hand, leverages the SuperTrend model, adjusting the Average True Range (ATR) length for a comprehensive trend-following oscillator.
This synergy offers traders a more nuanced and multifaceted tool for market analysis.
BTC 6H L/S Performance
Local
█ Strategy, How It Works: Detailed Explanation
The strategy combines two components: FlexiMA and FlexiST, each utilizing unique methodologies to analyze market trends.
🔶FlexiMA Component:
- Calculates deviations between an indicator source and moving averages of variable lengths.
- Moving average lengths are dynamically adjusted using a starting factor and increment factor.
- Deviations are normalized and analyzed to produce median and standard deviation values, forming the FlexiMA oscillator.
Length indicator (50)
🔶FlexiST Component:
- Uses SuperTrend indicators with varying ATR (Average True Range) lengths.
- Trends are identified based on the position of the indicator source relative to the SuperTrend bands.
- Deviations between the indicator source and SuperTrend values are calculated and normalized.
Starting Factor (5)
🔶Combined Strategy Logic:
- Entry Signals:
- Long Entry: Triggered when median values of both FlexiMA and FlexiST are positive.
- Short Entry: Triggered when median values of both FlexiMA and FlexiST are negative.
- Exit Signals:
- Long Exit: Triggered when median values of FlexiMA or FlexiST turn negative.
- Short Exit: Triggered when median values of FlexiMA or FlexiST turn positive.
This strategic blend of FlexiMA and FlexiST allows for a nuanced analysis of market trends, providing traders with signals based on a comprehensive view of market momentum and trend strength.
█ Trade Direction
The strategy is designed to cater to various trading preferences, offering "Long", "Short", and "Both" options. This flexibility allows traders to align the strategy with their specific market outlook, be it bullish, bearish, or a combination of both.
█ Usage
Traders can effectively utilize the FlexiMA x FlexiST Strategy by first selecting their desired trade direction. The strategy then generates entry signals when the conditions for either the FlexiMA or FlexiST are met, indicating potential entry points in the market. Conversely, exit signals are generated when the conditions for these indicators diverge, thus signaling a potential shift in market trends and suggesting a strategic exit point.
█ Default Settings
1. Indicator Source (HLC3): Provides a balanced and stable price source, reducing the impact of extreme market fluctuations.
2. Indicator Lengths (20 for FlexiMA, 10 for FlexiST): Longer FlexiMA length smooths out short-term fluctuations, while shorter FlexiST length allows for quicker response to market changes.
3. Starting Factors (1.0 for FlexiMA, 0.618 for FlexiST): Balanced start for FlexiMA and a harmonized approach for FlexiST, resonating with natural market cycles.
4. Increment Factors (1.0 for FlexiMA, 0.382 for FlexiST): FlexiMA captures a wide range of market behaviors, while FlexiST provides a gradual transition to capture finer trend shifts.
5. Normalization Methods ('None'): Uses raw deviations, suitable for markets where absolute price movements are more significant.
6. Trade Direction ('Both'): Allows strategy to consider both long and short opportunities, ideal for versatile market engagement.
*More details:
1. FlexiMA
2. FlexiST

Micro Dots with VMA line [Crypto_Chili_]In the chart photo is a quick description of each part of the indicator is.
The Micro Dots were hours of testing different combinations of indicators and settings to find what looked and worked best. This is what I came up with, use it as a rough draft as it could probably be added to or changed around.
One simple way to use the indicator is if price is above VMA with green dots, look to long. If price is below VMA with red dots look to short.
Variable Moving Average - Also known as VMA or Track Line, is an Exponential Moving Average. VMA adjusts its smoothing constant on the basis of Market Volatility. This can help to measure the macro trend.
Micro Trend Dots - A Supertrend with extras filters. Supertrend is a trend-following indicator based on ATR (In this indicator TrueRange instead). The extra filters on top of the Supertrend help add confluence to them to give more confidence in the micro trend.
Credit to @LazyBear for the Variable Moving Average
Credit to @KivancOzbilgic for his Supertrend
Send me a message if you create something with the Micro Dots I'd love it see it!
Thank you friends I hope you enjoy!
No Signal is 100% correct at what it's trying to do. Use caution when trading!
Practice Risk Management.

HSupertrendLibrary "HSupertrend"
Supertrend implementation based on harmonic patterns
hsupertrend(zProperties, pProperties, errorPercent, showPatterns, patternColor)
derives supertrend based on harmonic patterns
Parameters:
zProperties : ZigzagProperties containing Zigzag length and source array
pProperties : PatternProperties used for calculation
errorPercent : Error threshold for scanning patterns
showPatterns : Draw identified patterns structure on chart
patternColor : Color of the pattern lines to be drawn
Returns:
ZigzagProperties
ZigzagProperties contains values required for zigzag calculation
Fields:
length : Zigzag length
source : Array containing custom OHLC. If not set, array.from(high, low) is used
PatternProperties
PatternProperties are essential pattern parameters used for calculation of bullish and bearish zones
Fields:
base : Base for calculating entry and stop of pattern. Can be CD, minmax or correction. Default is CD
entryPercent : Distance from D in terms of percent of Base in the direction of pattern
stopPercent : Distance from D in terms of percent of Base in the opposite direction of pattern
useClosePrices : When set uses close price for calculation of supertrend breakout

3x Supertrend and Stoch RSIBased on the strategy if Trade pro "HIGHEST PROFIT Triple Supertrend Trading Strategy Proven 100 Trade Results"
Your entry long signal will show when two of the three supertrend are green and the stochastic rsi cross up and the candle is above the ema
Your entry short signal will show when two of the three supertrend are red and the stochastic rsi cross down and the candle is below the ema
You can change the settings of the three supertrend and the stochastic rsi

Dr.Om's SuperTrend IndicatorRiding along the Super Trend -
Super Trend Bullish candle (STBullCandle) is a candle where low is lower than supertrend and close is greater than super trend.
Conditions for going Long -
1. High of current candle should be higher than high of STBullCandle.
2. We can consider 1 or 2 candles after the STBullCandle for this condition.
3. If filterRsi is enabled, then we make an additional check of RSI being greater than the weighted moving average.
4. Should not be holding an existing long position
5. SuperTrend should be positive
Super Trend Bearish candle (STBearCandle) is a candle where high is higher than supertrend and close is lower than super trend.
Conditions for going Short -
1. Low of current candle should be lower than low of STBullCandle.
2. We can consider 1 or 2 candles after the STBearCandle for this condition.
3. If filterRsi is enabled, then we make an additional check of RSI being lower than the weighted moving average.
4. Should not be holding an existing short position
5. SuperTrend should be negative.
If holding long, EXIT LONG Position Criteria -
1. SL would be if close is lesser than the ST candle low
2. Direction of ST becomes Negative
3. If Reward to Risk ratio is given, then exit if target is achieved.
If holding short, EXIT SHORT Position Criteria -
1. SL would be if close is higher than the ST candle high
2. Direction of ST becomes +ve
3. If Reward to Risk ratio is given, then exit if target is achieved.

Kadunagra-Pivot Point SuperTrend-trades analysis
📊 Pivot Point SuperTrend Strategy (MA-Filtered, 100% Equity)
This strategy is a trend-following system that combines Pivot Point–based SuperTrend logic with a higher-timeframe Moving Average filter and percentage-based risk control.
---
🔹 Core Logic
1️⃣ Trend Detection (Pivot Point SuperTrend)
Uses pivot highs and lows to calculate a dynamic center line
Builds ATR-based upper and lower bands
Determines market trend:
Bullish trend when price breaks above the trailing band
Bearish trend when price breaks below the trailing band
Trend changes generate:
Buy signal → trend flips from bearish to bullish
Sell signal → trend flips from bullish to bearish
---
2️⃣ Moving Average Trend Filter (User-Selectable)
A single Moving Average is used as a higher-timeframe confirmation
User can select the MA type from a dropdown:
SMA, EMA, WMA, VWMA, RMA, or HMA
Trade rules:
Long trades only when price is above the selected MA
Short trades only when price is below the selected MA
This helps avoid counter-trend trades and improves signal quality.
---
3️⃣ Trade Execution & Position Sizing
Strategy uses 100% of account equity per trade
No pyramiding
Long and short trades are handled symmetrically
---
4️⃣ Risk Management (Percentage Stop-Loss)
Uses a fixed percentage stop-loss
Stop-loss is calculated from the actual entry price:
Long SL → Entry Price − SL%
Short SL → Entry Price + SL%
Ensures consistent risk control across all trades
---
⏱ Recommended Timeframe & Market
✅ Default / Optimized Use Case
Timeframe: 4-Hour (4H)
Market: BTC (Bitcoin)
MA Length (default): 200 EMA
ATR Factor & Period: Tuned for swing-style trend moves
These default parameters are best suited for 4H BTC based on trend behavior and volatility.
---
⚙️ Customization & Flexibility
All parameters are fully adjustable and can be optimized for:
Different timeframes (1H, Daily, etc.)
Other cryptocurrencies or markets
More aggressive or conservative risk profiles
You can modify:
Pivot period
ATR factor & period
MA type and length
Stop-loss percentage
---
🧠 Strategy Style Summary
✔ Trend-following
✔ MA-filtered confirmation
✔ No repaint logic
✔ Works best in trending markets
✔ Suitable for swing trading

[CT] Smart Supertrend Smart Supertrend is an overlay trend and context indicator that combines three different ideas into one visual: a dynamic “cloud” that adapts to market cycle speed, a pivot-point anchored trailing line that behaves like a smarter Supertrend, and an ADX strength filter that helps separate real trends from noisy sideways movement. It is designed to keep you aligned with the dominant direction while giving you a clean framework for entries, pullbacks, and exits.
The “cloud” is the heart of the script’s regime read. Internally, it builds an adaptive smoothing engine that reacts to how efficiently the price is moving. When the price is moving in a clean, directional way, the cloud becomes more responsive. When the price is choppy and overlapping, the cloud becomes slower and steadier. The cloud itself is drawn as two lines, Cloud A and Cloud B, and the filled area between them. When the adaptive KAMA slope is rising, the cloud is treated as bullish and uses your Up color. When it is falling, the cloud is treated as bearish and uses your Down color. This creates a quick visual of whether the market is behaving like an uptrend regime or a downtrend regime without relying on one fixed moving average length that can be too fast in chop or too slow in trend.
The PP line is the trade management spine. It is built from pivot logic that detects meaningful swing highs and swing lows using your PP Period. Those pivots are blended into a centerline, and then an ATR band is applied around that center using your ATR Period and ATR Factor. That band is turned into a trailing line that “ratchets” in the direction of the current trend. When the price is above the trailing logic, the script considers the trend state to be long. When the price is below, it considers the trend state to be short. The reason this feels different from a basic Supertrend is that the anchor comes from pivots and smoothing rather than only a direct ATR band around price, so it tends to track structure more naturally and reduce some of the fast flipping you see in choppy sections.
The ADX filter is the quality control layer. It computes plus DI, minus DI, and ADX over your ADX Length, and then checks whether ADX is above your threshold. When ADX is above the threshold, it suggests the market is trending enough for trend signals to matter. When ADX is below the threshold, the script is telling you the environment is more sideways, which is where most trend systems get chopped up. In the original logic, the “best” conditions occur when the cloud direction agrees with the DI direction, and ADX is strong, because that means direction and strength are aligned.
How you trade it starts with using the cloud as your directional bias. When the cloud is bullish, you prioritize longs and you treat shorts as lower quality or countertrend. When the cloud is bearish, you prioritize shorts and you treat longs as lower quality. Next, you use the PP line as the “line in the sand” for trend state and risk placement. In a bullish environment, price holding above the PP line is your confirmation that the structure-anchored trailing level is supporting the move. In a bearish environment, price holding below the PP line is your confirmation that the trailing level is capping rallies.
A clean, practical entry approach is to wait for agreement between the cloud and the PP line, then take pullbacks into that framework. For long trades, the highest quality setups occur when the cloud is bullish, the PP line is below price, and ADX is above the threshold with plus DI leading minus DI. In that state, you can look for pullbacks that dip toward the PP line or into the cloud region and then reject back upward, because you’re buying a retracement inside a confirmed trend regime rather than chasing extension. For short trades, the mirror applies: the cloud is bearish, the PP line is above price, ADX is above the threshold with minus DI leading, and you sell rallies back into the PP line or cloud that fail and rotate down.
Stops and exits can be built around the PP line because it is already an ATR-based trailing structure level. For a long, a conservative stop is placed just below the PP line with a buffer related to ATR, because if price closes and holds below that line you are likely seeing a trend condition break. For a short, the stop goes just above the PP line with a similar buffer. For profit taking, many traders scale out when price stretches far away from the PP line or when the cloud begins to lose slope and compress, because that often signals trend momentum is slowing. Another simple exit rule is to reduce or close when the PP line flips trend state against your position, or when the ADX falls back under the threshold after a run, because that frequently marks a transition into consolidation where trailing systems can give back gains.
If you enable signals in versions that plot them, the logic is meant to highlight moments when the PP line flips trend and the cloud is not contradicting that flip, then further filters those into “higher quality” conditions when cloud direction and ADX trend strength agree. In practice, you should still treat signals as prompts, not automatic trades. The best results come from using the signal as a timing cue while you still enforce the bigger rule of alignment: cloud direction, PP line trend state, and ADX strength all pointing the same way, with entries taken on pullbacks rather than on late breakout candles.
Finally, be aware that all adaptive smoothing systems will look different across markets and timeframes, so the main tuning knobs are your Cloud Length, PP Period, ATR Factor, and ADX Threshold. If you want fewer flips and more “position trading” behavior, increase the ATR Factor and consider a higher ADX threshold. If you want earlier entries and more sensitivity, lower ATR Factor and lower the threshold, but expect more chop. The indicator is at its best when you treat it as a regime and structure tool: let the cloud tell you the side, let the PP line define where you are wrong, and let ADX decide whether it’s a trend day or a chop day before you commit size.

Apex Adaptive TrailApex Adaptive Trail: Adaptive Volatility Trend System
This custom trend-following indicator improves on standard SuperTrend implementations by addressing two key weaknesses: excessive whipsaws during high volatility and false signals in ranging markets.
Core Logic:
- Synthetic Heikin Ashi values are calculated internally (without changing chart candles) to provide smoother source data for trend detection.
- ATR-based trailing stop with adaptive multiplier: dynamically adjusts between 0.8x and 1.5x the base factor based on current volatility (ATR / 50-period SMA of ATR). Widens in volatile conditions, tightens in quiet markets.
- Weighted Confluence Score (0-100%): Combines four independent filters, each contributing 25%:
• Price position relative to 21-period EMA (trend alignment)
• ADX > 20 (momentum strength)
• Choppiness Index < 60 (trending vs ranging detection)
• Alignment with Daily EMA(50) trend direction
Signals are only generated when price crosses the adaptive trail AND the confluence score exceeds 75% (standard) or 90% (MAX 🔥 ultra-strong). This combination significantly reduces low-quality entries compared to traditional SuperTrend crossovers.
Key Features:
- Dynamic confidence cloud (opacity based on score)
- Real-time dashboard showing volatility state, active filters, trend bias, and estimated historical win rate
- Optional dynamic/fixed profit targets
- Fully customizable filters and adaptive behavior
Usage: Best on 15m to 4H timeframes for trend-following strategies (Crypto, Forex, Indices). Enter on APEX signals, use trail as stop-loss, TP lines for partial exits.
This script integrates established concepts into a unique adaptive framework with volatility-responsive risk management and multi-filter validation.
Disclaimer: For educational and analysis purposes only. Past performance is not indicative of future results. Always use proper risk management.
"This script combines established indicators (ATR trailing, ADX, Choppiness Index, EMA, MTF) into a unique adaptive system with dynamic volatility adjustment and weighted confluence scoring – features not found together in standard SuperTrend variations."

XAUUSD Multi-Timeframe Supertrend Alert v2**Indicator Overview: XAUUSD Multi-Timeframe Supertrend Alert v2**
**Core Components:**
1. **Multi-Timeframe Supertrend System**
- Two Supertrend indicators (ST1 & ST2) with customizable timeframes
- ST1 typically set to Daily, ST2 to Weekly as main trend
- Visualized with distinct colors and background fills
2. **Customizable SMA**
- Adjustable period and timeframe
- Plotted as blue line for additional trend reference
3. **Neutral Zone System**
- Creates a neutral line offset from ST1 by customizable tick distance
- Yellow dashed line that adjusts based on ST1 trend direction
- **Alert Conditions:**
- **Test Buy Zone**: Both ST1 & ST2 in uptrend AND price enters neutral zone above ST1
- **Test Sell Zone**: Both ST1 & ST2 in downtrend AND price enters neutral zone below ST1
4. **Distance Lines from ST2**
- Upper/lower lines at customizable tick distance from ST2
- Purple dashed lines with touch alerts
**Trading Signals:**
- **Bullish Signal**: Price above ST2 but below ST1 (potential buy)
- **Bearish Signal**: Price below ST2 but above ST1 (potential sell)
- **Neutral Zone Alerts**: Price enters defined zone when both trends align
- **Line Touch Alerts**: Price touches distance lines from ST2
**Alert System:**
- Limited to 3 consecutive alerts per signal type
- Visual markers (triangles, diamonds, circles)
- Background coloring for signal zones
- Separate alert conditions for each signal type
**Visual Features:**
- Candles colored green/red based on signals
- Clear trend visualization with colored backgrounds
- Real-time alert markers without information table clutter
This indicator provides multi-timeframe trend analysis with precise entry zone detection and comprehensive alert system for XAUUSD trading. SAM89 M15, ST1 (5:10) M5, ST2 ( 1,5:20) H1, Test Buy Sell 7000, Line 15000

StdDev Supertrend {CHIPA}StdDev Supertrend ~ C H I P A is a supertrend style trend engine that replaces ATR with standard deviation as the volatility core. It can operate on raw prices or log return volatility, with optional smoothing to control noise.
Key features include:
Supertrend trailing rails built from a stddev scaled envelope that flips the regime only when price closes through the opposite rail.
Returns-based mode that scales volatility by log returns for more consistent behavior across price regimes.
Optional smoothing on the volatility input to tune responsiveness versus stability.
Directional gap fill between price and the active trend line on the main chart; opacity adapts to the distance (vs ATR) so wide gaps read stronger and small gaps stay subtle.
Secondary pane view of the rails with the same adaptive fade, plus an optional candle overlay for context.
Clean alerts that fire once when state changes
Use cases: medium-term trend following, stop/flip systems, and visual regime confirmation when you prefer stddev-based distance over ATR.
Note: no walk-forward or robustness testing is implied; parameter choices and risk controls are on you.

Tuga SupertrendDescription
This strategy uses the Supertrend indicator enhanced with commission and slippage filters to capture trends on the daily chart. It’s designed to work on any asset but is especially effective in markets with consistent movements.
Use the date inputs to set the backtest period (default: from January 1, 2018, through today, June 30, 2025).
The default input values are optimized for the daily chart. For other timeframes, adjust the parameters to suit the asset you’re testing.
Release Notes
June 30, 2025
• Updated default backtest period to end on June 30, 2025.
• Default commission adjusted to 0.1 %.
• Slippage set to 3 ticks.
• Default slippage set to 3 ticks.
• Simplified the strategy name to “Tuga Supertrend”.
Default Parameters
Parameter Default Value
Supertrend Period 10
Multiplier (Factor) 3
Commission 0.1 %
Slippage 3 ticks
Start Date January 1, 2018
End Date June 30, 2025
