ATR SL/TP Precision Zones (Dots)ATR SL/TP Precision Zones (Dots) is a volatility-based tool designed to help traders set accurate Stop Loss and Take Profit levels based on real market volatility — not fixed pips or emotion.
This indicator uses ATR (Average True Range) multiplied by 1.2 to calculate dynamic distance bands.
Instead of drawing a ribbon or channel, it places simple dots above and below each candle:
Upper Dot (Green) → Suggested Take Profit / Price Stretch Zone
Lower Dot (Red) → Suggested Stop Loss Cushion / Support Expansion Zone
Because ATR measures market volatility, these dots expand during high volatility and tighten during slow markets, helping traders avoid stop-loss hunts and premature exits.
Why This Works
Most traders lose because:
They set SL too close → stopped out by noise
They set TP too far → price never reaches it
This tool calibrates those distances automatically based on real price movement behavior.
ATR = volatility
Volatility = market breathing room
This indicator ensures your trade has room to breathe, increasing win consistency.
Best Use Cases
Scalping
Swing trading
Trend continuation entries
Reversal confirmations with support/resistance
Works on Crypto / Forex / Stocks / Futures
Buscar en scripts para "stop loss"

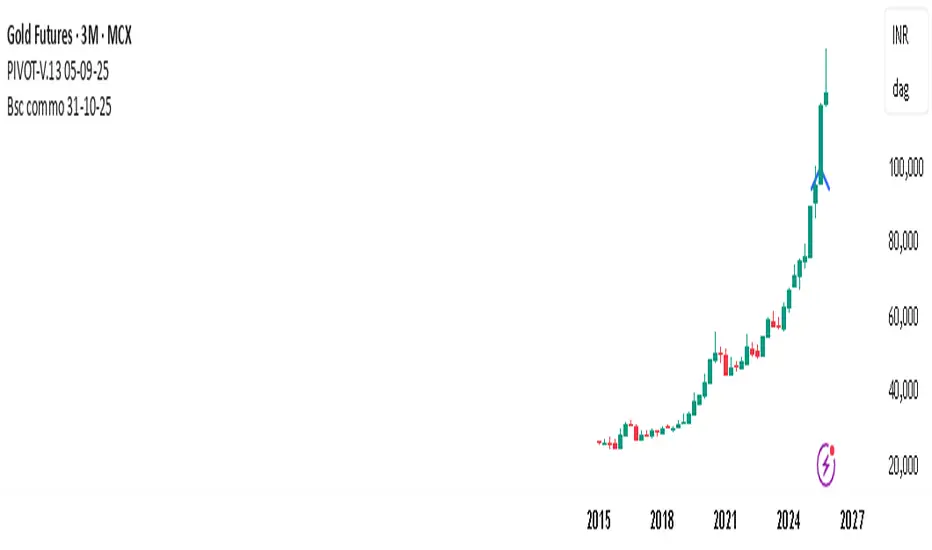
PIVOT-V.13 05-09-25This Pine Script automatically detects pivot levels and generates buy/sell signals based on price action around those pivots. It identifies key support and resistance zones derived from previous period highs, lows, and closes, then marks optimal entry, target, and stop-loss levels on the chart.
The script is designed to assist traders in systematic decision-making using pivot-based strategies.
🔍 Core Features
Automatic Pivot Detection: Calculates and updates pivots in real-time using standard formulas.
Smart Trade Setup:
Buy Signal: Triggered when price action confirms strength above a pivot or resistance level.
Sell Signal: Triggered when price action confirms weakness below a pivot or support level.
Entry, Target & Stop-Loss Levels: Automatically plots potential entry points, stop-loss levels, and take-profit zones based on the nearest pivot structure.
Customizable Settings:
Choose pivot type and timeframe (daily, weekly, or monthly).
Adjust risk ratio, stop size, and confirmation filters.
Enable/disable visual labels or alerts.
Visual Clarity: Clearly marks all pivot levels and trade signals on the chart with colored labels and lines.
🎯 Purpose
This script helps traders quickly identify high-probability entry zones and maintain disciplined trade management by following pre-defined pivot-based rules — reducing emotional bias and enhancing consistency.
Smart Money Flow Index (SMFI) - Advanced SMC [PhenLabs]📊Smart Money Flow Index (SMFI)
Version: PineScript™v6
📌Description
The Smart Money Flow Index (SMFI) is an advanced Smart Money Concepts implementation that tracks institutional trading behavior through multi-dimensional analysis. This comprehensive indicator combines volume-validated Order Block detection, Fair Value Gap identification with auto-mitigation tracking, dynamic Liquidity Zone mapping, and Break of Structure/Change of Character detection into a unified system.
Unlike basic SMC indicators, SMFI employs a proprietary scoring algorithm that weighs five critical factors: Order Block strength (validated by volume), Fair Value Gap size and recency, proximity to Liquidity Zones, market structure alignment (BOS/CHoCH), and multi-timeframe confluence. This produces a Smart Money Score (0-100) where readings above 70 represent optimal institutional setup conditions.
🚀Points of Innovation
Volume-Validated Order Block Detection – Only displays Order Blocks when formation candle exceeds customizable volume multiplier (default 1.5x average), filtering weak zones and highlighting true institutional accumulation/distribution
Auto-Mitigation Tracking System – Fair Value Gaps and Order Blocks automatically update status when price mitigates them, with visual distinction between active and filled zones preventing trades on dead levels
Proprietary Smart Money Score Algorithm – Combines weighted factors (OB strength 25%, FVG proximity 20%, Liquidity 20%, Structure 20%, MTF 15%) into single 0-100 confidence rating updating in real-time
ATR-Based Adaptive Calculations – All distance measurements use 14-period Average True Range ensuring consistent function across any instrument, timeframe, or volatility regime without manual recalibration
Dynamic Age Filtering – Automatically removes liquidity levels and FVGs older than configurable thresholds preventing chart clutter while maintaining relevant levels
Multi-Timeframe Confluence Integration – Analyzes higher timeframe bias with customizable multipliers (2-10x) and incorporates HTF trend direction into Smart Money Score for institutional alignment
🔧Core Components
Order Block Engine – Detects institutional supply/demand zones using characteristic patterns (down-move-then-strong-up for bullish, up-move-then-strong-down for bearish) with minimum volume threshold validation, tracks mitigation when price closes through zones
Fair Value Gap Scanner – Identifies price imbalances where current candle's low/high leaves gap with two-candle-prior high/low, filters by minimum size percentage, monitors 50% fill for mitigation status
Liquidity Zone Mapper – Uses pivot high/low detection with configurable lookback to mark swing points where stop losses cluster, extends horizontal lines to visualize sweep targets, manages lifecycle through age-based removal
Market Structure Analyzer – Tracks pivot progression to identify trend through higher-highs/higher-lows (bullish) or lower-highs/lower-lows (bearish), detects Break of Structure and Change of Character for trend/reversal confirmation
Scoring Calculation Engine – Evaluates proximity to nearest Order Blocks using ATR-normalized distance, assesses FVG recency and distance, calculates liquidity proximity with age weighting, combines structure bias and MTF trend into smoothed final score
🔥Key Features
Customizable Display Limits – Control maximum Order Blocks (1-10), Liquidity Zones (1-10), and FVG age (10-200 bars) to maintain clean charts focused on most relevant institutional levels
Gradient Strength Visualization – All zones render with transparency-adjustable coloring where stronger/newer zones appear more solid and weaker/older zones fade progressively providing instant visual hierarchy
Educational Label System – Optional labels identify each zone type (Bullish OB, Bearish OB, Bullish FVG, Bearish FVG, BOS) with color-coded text helping traders learn SMC concepts through practical application
Real-Time Smart Money Score Dashboard – Top-right table displays current score (0-100) with color coding (green >70, yellow 30-70, red <30) plus trend arrow for at-a-glance confidence assessment
Comprehensive Alert Suite – Configurable notifications for Order Block formation, Fair Value Gap detection, Break of Structure events, Change of Character signals, and high Smart Money Score readings (>70)
Buy/Sell Signal Integration – Automatically plots triangle markers when Smart Money Score exceeds 70 with aligned market structure and fresh Order Block detection providing clear entry signals
🎨Visualization
Order Block Boxes – Shaded rectangles extend from formation bar spanning high-to-low of institutional candle, bullish zones in green, bearish in red, with customizable transparency (80-98%)
Fair Value Gap Zones – Rectangular areas marking imbalances, active FVGs display in bright colors with adjustable transparency, mitigated FVGs switch to gray preventing trades on filled zones
Liquidity Level Lines – Dashed horizontal lines extend from pivot creation points, swing highs in bearish color (short targets above), swing lows in bullish color (long targets below), opacity decreases with age
Structure Labels – "BOS" labels appear above/below price when Break of Structure confirmed, colored by direction (green bullish, red bearish), positioned at 1% beyond highs/lows for visibility
Educational Info Panel – Bottom-right table explains key terminology (OB, FVG, BOS, CHoCH) and score interpretation (>70 high probability) with semi-transparent background for readability
📖Usage Guidelines
General Settings
Show Order Blocks – Default: On, toggles visibility of institutional supply/demand zones, disable when focusing solely on FVGs or Liquidity
Show Fair Value Gaps – Default: On, controls FVG zone display including active and mitigated imbalances
Show Liquidity Zones – Default: On, manages liquidity line visibility, disable on lower timeframes to reduce clutter
Show Market Structure – Default: On, toggles BOS/CHoCH label display
Show Smart Money Score – Default: On, controls score dashboard visibility
Order Block Settings
OB Lookback Period – Default: 20, Range: 5-100, controls bars scanned for Order Block patterns, lower values detect recent activity, higher values find older blocks
Min Volume Multiplier – Default: 1.5, Range: 1.0-5.0, sets minimum volume threshold as multiple of 20-period average, higher values (2.0+) filter for strongest institutional candles
Max Order Blocks to Display – Default: 3, Range: 1-10, limits simultaneous Order Blocks shown, lower settings (1-3) maintain focus on most recent zones
Fair Value Gap Settings
Min FVG Size (%) – Default: 0.3, Range: 0.1-2.0, defines minimum gap size as percentage of close price, lower values detect micro-imbalances, higher values focus on significant gaps
Max FVG Age (bars) – Default: 50, Range: 10-200, removes FVGs older than specified bars, lower settings (10-30) for scalping, higher (100-200) for swing trading
Show FVG Mitigation – Default: On, displays filled FVGs in gray providing visual history, disable to show only active untouched imbalances
Liquidity Zone Settings
Liquidity Lookback – Default: 50, Range: 20-200, sets pivot detection period for swing highs/lows, lower values (20-50) mark shorter-term liquidity, higher (100-200) identify major swings
Max Liquidity Age (bars) – Default: 100, Range: 20-500, removes liquidity lines older than specified bars, adjust based on timeframe
Liquidity Sensitivity – Default: 0.5, Range: 0.1-1.0, controls pivot detection sensitivity, lower values mark only major swings, higher values identify minor swings
Max Liquidity Zones to Display – Default: 3, Range: 1-10, limits total liquidity levels shown maintaining chart clarity
Market Structure Settings
Pivot Length – Default: 5, Range: 3-15, defines bars to left/right for pivot validation, lower values (3-5) create sensitive structure breaks, higher (10-15) filter for major shifts
Min Structure Move (%) – Default: 1.0, Range: 0.1-5.0, sets minimum percentage move required between pivots to confirm structure change
Multi-Timeframe Settings
Enable MTF Analysis – Default: On, activates higher timeframe trend analysis incorporation into Smart Money Score
Higher Timeframe Multiplier – Default: 4, Range: 2-10, multiplies current timeframe to determine analysis timeframe (4x on 15min = 1hour)
Visual Settings
Bullish Color – Default: Green (#089981), sets color for bullish Order Blocks, FVGs, and structure elements
Bearish Color – Default: Red (#f23645), defines color for bearish elements
Neutral Color – Default: Gray (#787b86), controls color of mitigated zones and neutral elements
Show Educational Labels – Default: On, displays text labels on zones identifying type (OB, FVG, BOS), disable once familiar with patterns
Order Block Transparency – Default: 92, Range: 80-98, controls Order Block box transparency
FVG Transparency – Default: 92, Range: 80-98, sets Fair Value Gap zone transparency independently from Order Blocks
Alert Settings
Alert on Order Block Formation – Default: On, triggers notification when new volume-validated Order Block detected
Alert on FVG Formation – Default: On, sends alert when Fair Value Gap appears enabling quick response to imbalances
Alert on Break of Structure – Default: On, notifies when BOS or CHoCH confirmed
Alert on High Smart Money Score – Default: On, alerts when Smart Money Score crosses above 70 threshold indicating high-probability setup
✅Best Use Cases
Order Block Retest Entries – After Break of Structure, wait for price retrace into fresh bullish Order Block with Smart Money Score >70, enter long on zone reaction targeting next liquidity level
Fair Value Gap Retracement Trading – When price creates FVG during strong move then retraces, enter as price approaches unfilled gap expecting institutional orders to continue trend
Liquidity Sweep Reversals – Monitor price approaching swing high/low liquidity zones against prevailing Smart Money Score trend, after stop hunt sweep watch for rejection into premium Order Block/FVG
Multi-Timeframe Confluence Setups – Identify alignment when current timeframe Order Block coincides with higher timeframe FVG plus MTF analysis showing matching trend bias
Break of Structure Continuations – After BOS confirms trend direction, trade pullbacks to nearest Order Block or FVG in direction of structure break using Smart Money Score >70 as entry filter
Change of Character Reversal Plays – When CHoCH detected indicating potential reversal, look for Smart Money Score pivot with opposing Order Block formation then enter on structure confirmation
⚠️Limitations
Lagging Pivot Calculations – Pivot-based features (Liquidity Zones, Market Structure) require bars to right of pivot for confirmation, meaning these elements identify levels retrospectively with delay equal to lookback period
Whipsaw in Ranging Markets – During choppy conditions, Order Blocks fail frequently and structure breaks produce false signals as Smart Money Score fluctuates without clear institutional bias, best used in trending markets
Volume Data Dependency – Order Block volume validation requires accurate volume data which may be incomplete on Forex pairs or limited in crypto exchange feeds
Subjectivity in Scoring Weights – Proprietary 25-20-20-20-15 weighting reflects general institutional behavior but may not optimize for specific instruments or market regimes, user cannot adjust factor weights
Visual Complexity on Lower Timeframes – Sub-hour timeframes generate excessive zones creating cluttered charts, requires aggressive display limit reduction and higher minimum thresholds
No Fundamental Integration – Indicator analyzes purely technical price action and volume without incorporating economic events, news catalysts, or fundamental shifts that override technical levels
💡What Makes This Unique
Unified SMC Ecosystem – Unlike indicators displaying Order Blocks OR FVGs OR Liquidity separately, SMFI combines all three institutional concepts plus market structure into single cohesive system
Proprietary Confidence Scoring – Rather than manual setup assessment, automated Smart Money Score quantifies probability by weighting five institutional dimensions into actionable 0-100 rating
Volume-Filtered Quality – Eliminates weak Order Blocks forming without institutional volume confirmation, ensuring displayed zones represent genuine accumulation/distribution
Adaptive Lifecycle Management – Automatically updates mitigation status and removes aged zones preventing trades on dead levels through continuous validity and age monitoring
Educational Integration – Built-in tooltips, labeled zones, and reference panel make indicator functional for both learning Smart Money Concepts and executing strategies
🔬How It Works
Order Block Detection – Scans for patterns where strong directional move follows counter-move creating last down-candle before rally (bullish OB) or last up-candle before sell-off (bearish OB), validates formations only when candle exhibits volume exceeding configurable multiple (default 1.5x) of 20-bar average volume
Fair Value Gap Identification – Compares current candle’s high/low against two-candles-prior low/high to detect price imbalances, calculates gap size as percentage of close and filters micro-gaps below minimum threshold (default 0.3%), monitors whether subsequent price fills 50% triggering mitigation status
Liquidity Zone Mapping – Employs pivot detection using configurable lookback (default 50 bars) to identify swing highs/lows where retail stops cluster, extends horizontal reference lines from pivot creation and applies age-based filtering to remove stale zones
Market Structure Analysis – Tracks pivot progression using structure-specific lookback (default 5 bars) to determine trend, confirms uptrend when new pivot high exceeds previous by minimum move percentage, detects Break of Structure when price breaks recent pivot level, flags Change of Character for potential reversals
Multi-Timeframe Confluence – When enabled, requests security data from higher timeframe (current TF × HTF multiplier, default 4x), compares HTF close against HTF 20-period MA to determine bias, contributes ±50 points to score ensuring alignment with institutional positioning on superior timeframe
Smart Money Score Calculation – Evaluates Order Block component via ATR-normalized distance producing max 100-point contribution weighted at 25%, assesses FVG factor through age penalty and distance at 20% weight, calculates Liquidity proximity at 20%, incorporates structure bias (±50-100 points) at 20%, adds MTF component at 15%, applies 3-period smoothing to reduce volatility
Visual Rendering and Lifecycle – Draws Order Block boxes, Fair Value Gap rectangles with color coding (green/red active, gray mitigated), extends liquidity dashed lines with fade-by-age opacity, plots BOS labels, displays Smart Money Score dashboard, continuously updates checking mitigation conditions and removing elements exceeding age/display limits
💡Note:
The Smart Money Flow Index combines multiple Smart Money Concepts into unified institutional order flow analysis. For optimal results, use the Smart Money Score as confluence filter rather than standalone entry signal – scores above 70 indicate high-probability setups but should be combined with risk management, higher timeframe bias, and market regime understanding.

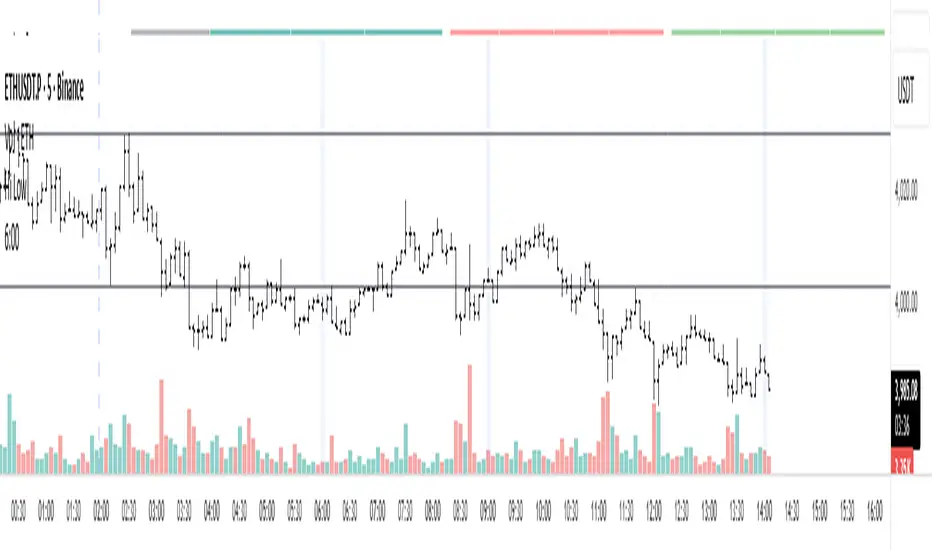
Dynamic Liquidity HeatMap Profile [BigBeluga]🔵 OVERVIEW
The Dynamic Liquidity HeatMap Profile is a smart-flow liquidity tracker that maps where stop-loss clusters and resting limit orders are likely positioned.
Instead of traditional volume profiles based only on executed transactions, this tool projects probable liquidity pools — areas where traders are trapped or positioned and where smart money may hunt stops or fill orders.
It dynamically scans recent price swings, builds liquidity zones above and below price, and visualizes them as a heat map + histogram — highlighting areas with the greatest liquidity attraction.
Orange highlights the highest-concentration liquidity (POC), making potential sweep targets obvious.
🔵 CONCEPTS
Liquidity pools form above swing highs (buy stops) and below swing lows (sell stops).
Market makers & large players often push price into these zones to trigger stops and capture liquidity.
The indicator uses recent volatility + volume expansion to estimate where these pools exist.
Horizontal heat bars show depth and intensity of probable liquidity.
Profile side histogram displays buy-side vs sell-side liquidity distribution.
🔵 FEATURES
Dynamic Liquidity Detection — finds potential stop-loss clusters from recent swing behavior.
Dual-Side Heatmap — split liquidity view above (short stops) and below (long stops) current price.
Volume-Weighted Levels — higher volatility & volume = deeper liquidity expectation.
Real-Time Heat Coloring
• Lime = liquidity below price (potential buy-side fuel)
• Blue = liquidity above price (potential sell-side fuel)
• Orange = peak liquidity (POC)
Liquidity Profile Histogram — plotted at right side, layered by strength.
Auto-Cleaning Engine — removes invalidated liquidity after breaks.
Adjustable lookback window and bin resolution .
🔵 HOW TO USE
Look for price moving toward dense liquidity zones — high probability of wick raids or sweeps.
Orange POC often acts as magnet — strong target zone for smart money.
Combine with SFP / BOS logic to time reversals after liquidity hunts.
In trend, price repeatedly sweeps opposite-side liquidity before continuation.
Use liquidity walls as bias filters — heavy liquidity above often precedes downward move, and vice-versa.
Great for scalping sessions, indices, FX, BTC, ETH.
🔵 CONCLUSION
The Dynamic Liquidity HeatMap Profile gives traders a tactical edge by revealing where the market’s hidden liquidity resides.
It highlights where shorts and longs are positioned, identifies likely sweep zones, and marks the most attractive liquidity magnet (POC).
Use it to anticipate stop hunts, avoid getting trapped, and align with smart-money flow instead of fighting it.

EMA100 Breakout by shubhThis indicator is a clean, price-action-based breakout system designed for disciplined trend trading on any timeframe — especially for Nifty and Bank Nifty spot, futures, and options charts.
It uses a single 100-period EMA to define trend direction and waits for decisive candle closes across the EMA to trigger potential entries.
The logic ensures only one active trade at a time, enforcing patience and clarity in decision-making.
⚙️ Core Logic
Buy Setup
A bullish candle closes above the 100 EMA while its open was below the EMA.
Entry occurs at candle close.
Stop-Loss (SL): Low of the signal candle.
Target (TP): 4 × the SL distance (Risk : Reward = 1 : 4).
Sell Setup
A bearish candle closes below the 100 EMA while its open was above the EMA.
Entry occurs at candle close.
Stop-Loss (SL): High of the signal candle.
Target (TP): 4 × the SL distance.
Trade Management
Only one trade may run at a time (either long or short).
New signals are ignored until the current position hits SL or TP.
Transparent labels show Entry, SL, and TP levels on chart.
Dotted lines visualize active Stop-Loss (red) and Target (green).
Exit markers:
✅ Target Hit
❌ Stop Loss Hit
🧠 Key Advantages
Simple and transparent trend-following logic.
Enforces disciplined “one-trade-at-a-time” behavior.
High risk-to-reward (1 : 4).
Works across timeframes — 5 min to Daily.
Ideal for intraday and positional setups.
📊 Suggested Use
Apply on Nifty / Bank Nifty spot or futures charts.
Works on any instrument with clear momentum swings.
Best confirmation when EMA 100 acts as dynamic support/resistance.
⚠️ Disclaimer
This script is for educational and research purposes only.
It is not financial advice or an invitation to trade.
Always backtest thoroughly and manage risk responsibly before applying in live markets.

Risk Leverage ToolRisk Leverage Tool – Calculate Position Size and Required Leverage
This script automatically calculates the optimal position size and the leverage needed based on the amount of capital you are willing to risk on a trade. It is designed for traders who want precise control over their risk management.
The script determines the distance between the entry and stop-loss price, calculates the maximum position size that fits within the defined risk, and derives the notional value of the trade. Based on the available margin, it then calculates the required leverage. It also displays the percentage of margin at risk if the stop-loss is hit.
All results are displayed in a table in the top-right corner of the chart. Additionally, a label appears at the entry price level showing the same data.
To use the tool, simply input your planned entry price, stop-loss price, the maximum risk amount in dollars, and the available margin in the settings menu. The script will update all values automatically in real time.
This tool works with any market where capital risk is expressed in absolute terms (such as USD), including futures, CFDs, and leveraged spot positions. For inverse contracts or percentage-based stops, manual adjustment is required.

G Position Size Calculator (Crypto)G Position Size Calculator (Crypto)
This tool helps traders quickly visualize and calculate risk, position size, leverage, and R:R ratio directly on the chart for crypto trading.
It works similarly to TradingView’s Long/Short Position tool but automatically computes all metrics based on your clicks.
⚙️ How to Use
Add to Chart
Click Indicators → My Scripts → G Position Size Calculator (Crypto)
Set Entry, Stop-Loss, and Take-Profit
Open the script’s ⚙️ Settings.
Click the crosshair icon next to Entry, then click on the chart.
Do the same for Stop-Loss and Take-Profit.
Adjust Account & Risk Settings
Enter your Account Size (USD).
Set your Risk % per trade (default: 1%).
Visual Feedback
A green box shows your profit zone (Entry → TP).
A red box shows your loss zone (Entry → SL).
The label on the right displays:
Risk (% and $)
R:R ratio
Position size (units)
Leverage required
Fine-Tune Without Re-clicking
Use the nudge inputs (Entry, Stop, TP) to move levels up/down by 1 tick at a time.
Positive = up, negative = down.
Re-pick Levels Anytime
Re-open settings and click the crosshair again to redefine a level.
📈 Features
Automatic calculation of risk, position size, leverage, and R:R ratio.
Visual green/red box representing profit and loss areas.
Adjustable risk %, account balance, and label offset.
“Nudge” controls to emulate quick drag adjustments.
Clean layout designed for crypto price charts (works on any symbol).

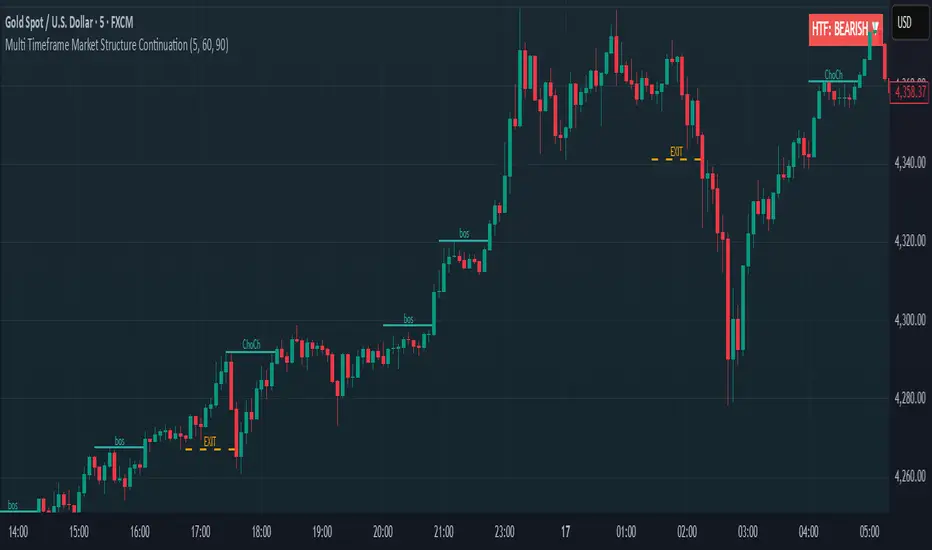
Multi Timeframe Market Structure ContinuationOverview
This indicator identifies Break of Structure (BOS) and Change of Character (ChoCh) patterns using multi-timeframe (MTF) analysis to filter high-probability trade setups. By aligning lower timeframe signals with higher timeframe bias, it helps traders enter positions in the direction of the dominant trend while avoiding counter-trend traps.
Multi-Timeframe Analysis
The indicator analyzes market structure on two timeframes simultaneously:
Current Timeframe (CTF): Detects immediate BOS and ChoCh signals for entry timing
Higher Timeframe (HTF): Establishes the overall trend direction (default: 1H, customizable)
Signals only appear when the current timeframe structure aligns with the higher timeframe bias, ensuring you're trading with the momentum, not against it.
Break of Structure (BOS)
BOS signals indicate trend continuation - when price breaks a previous high in an uptrend or a previous low in a downtrend. These are reliable entries that confirm the trend is still active and strong.
Change of Character (ChoCh)
ChoCh signals mark early trend reversals - when market structure shifts from bearish to bullish (or vice versa). When captured in alignment with the higher timeframe trend, ChoCh entries can achieve exceptional risk-to-reward ratios as they allow entry near the beginning of a new impulse move.
Exit Signals
Exit signals are plotted when a ChoCh occurs in the opposite direction of the HTF trend. For example, if the HTF is bullish and a bearish ChoCh forms on the current timeframe, an orange "EXIT" signal appears - warning long traders that the lower timeframe structure is shifting against them. This provides an early warning system to protect profits or minimize losses before the HTF trend itself reverses.
Trading Strategy Recommendations
Trending Markets (Recommended)
In strong trending conditions, both BOS and ChoCh signals can be taken when aligned with the HTF bias. ChoCh entries are particularly powerful as they catch early reversals within the larger trend, offering entries with tight stop losses and extended profit targets.
Ranging Markets
During consolidation or choppy conditions, it's best to be selective and take only BOS entries. BOS signals confirm that the trend is continuing beyond the range, reducing false breakouts and whipsaw trades that are common with counter-trend ChoCh signals in sideways markets.
Customization
Pivot Length: Adjust the sensitivity of structure detection (default: 5). Lower values detect structure more frequently with earlier but potentially noisier signals. Higher values provide cleaner, more significant structural breaks but with some delay.
Higher Timeframe: Customize the HTF to suit your trading style. Day traders might use 1H HTF on 5m charts, while swing traders could use 4H or Daily HTF.
Alert System
Six alert conditions available:
Long BOS Entry / Long ChoCh Entry
Short BOS Entry / Short ChoCh Entry
Long Exit / Short Exit
All alerts fire only on confirmed candle closes to eliminate repainting and false signals.
Visual Features
Color-coded background showing HTF bias
Clear BOS/ChoCh labels with horizontal lines at structure levels
Orange "EXIT" signals when structure breaks against your position
Gray lines tracking current swing highs/lows
HTF trend indicator in the top-right corner
RPT Position Sizer🎯 Purpose
This indicator is a position sizing and stop-loss calculator designed to help traders instantly determine:
How many shares/contracts to buy,
How much risk (₹) they are taking per trade,
How much capital will be deployed, and
The precise stop-loss price level based on user-defined parameters.
It displays all key values in a compact on-chart table (bottom-left corner) for quick trade planning.
💡 Use Case
Perfect for discretionary swing traders, systematic position traders, and risk managers who want instant visual feedback of trade sizing metrics directly on the chart — eliminating manual calculations and improving discipline.
⚙️ Key Features
Dynamic Inputs
Trading Capital (₹) — total available capital for trading.
RPT % — risk-per-trade as a percentage of total capital.
SL % — stop-loss distance in percent below CMP (Current Market Price).
CMP Source — can be linked to close, hl2, etc.
Rounding Style — round position size to Nearest, Floor, or Ceil.
Decimals Show — control number formatting precision in the table.
Core Calculations
SL Points: CMP × SL%
SL Price: CMP − SL Points
Risk Amount (₹): Capital × RPT%
Position Size: Risk ÷ SL Points
Capital Used: Position Size × CMP
Clean On-Chart Table Display
Displays:
Trading Capital
RPT %
Risk Amount (₹)
Position Size (shares/contracts)
Capital Required (₹)
Stop-Loss % & SL Price
The table uses a minimalistic white-on-black design with clear labeling and rupee formatting for quick reference.
Data Window Integration
Plots hidden values (Position Size, Risk Amount, SL Points, Capital Used) for use in TradingView’s Data Window—ideal for strategy testing and exporting values.

ATR Adaptive (auto timeframe)This indicator automatically adjusts the Average True Range (ATR) period based on the current chart timeframe, helping traders define dynamic Stop Loss (SL) and Take Profit (TP) levels that adapt to market volatility.
The ATR measures the average range of price movement over a defined number of bars. By using adaptive periods, the indicator ensures that volatility is interpreted consistently across different timeframes — from 1-minute charts to daily or weekly charts.
It plots two main levels on the chart:
🔴 Low – ATR × Multiplier → Suggested Stop Loss (below the candle’s low)
🟢 High + ATR × Multiplier → Suggested Take Profit or trailing level (above the candle’s high)
Optional additional lines show ATR-based TP levels calculated from the current close.
💡 How to use
Select your desired ATR multiplier (e.g., 1.3× for SL, 1.0× for TP).
The script automatically detects the chart timeframe and uses an appropriate ATR length (e.g., ATR(30) on M5, ATR(21) on H1, ATR(14) on Daily).
Use the plotted levels to:
Set Stop Loss just below the red ATR band (for long trades).
Set Take Profit near or slightly below the green ATR band (for short trades, reverse logic).
⚙️ Why it helps
Maintains consistent volatility-based risk across multiple timeframes.
Avoids arbitrary fixed SL/TP values.
Makes the trading strategy more responsive in high-volatility markets and more conservative when volatility contracts.
Particularly useful for intraday and swing trading, where volatility varies significantly between sessions.

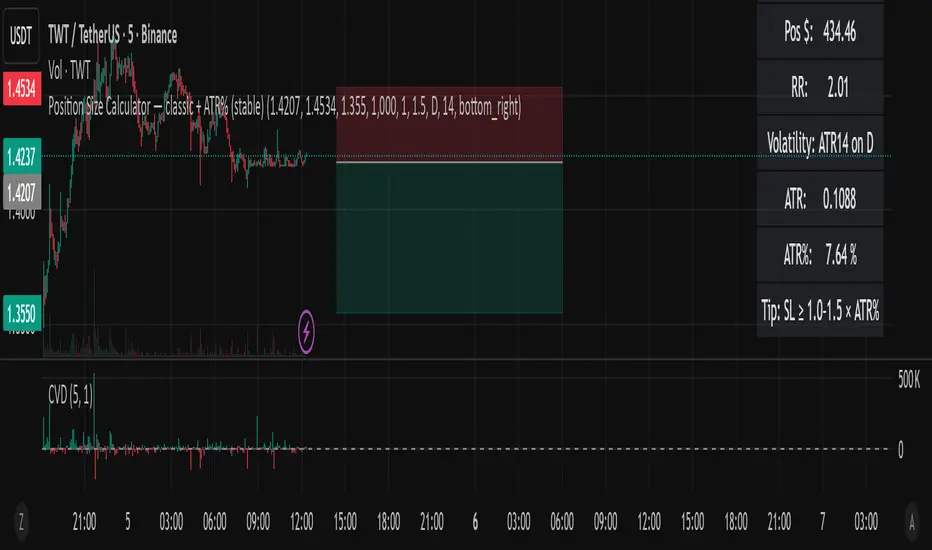
Position Size Calculator — classic + ATR% (Ostin V.)Position Size Calculator — classic + ATR% (stable)
A clean and reliable position size calculator for swing and day traders.
Perfect for crypto markets and volatility-based risk management.
📊 Features:
Calculates position size based on risk ($ or %).
Displays risk/reward ratio (RR), stop distance, and position value.
Measures daily volatility (ATR%) to help adjust stop-loss levels.
Includes a tip for optimal stop width: SL ≥ 1.0–1.5 × ATR%.
Minimal and stable design — no chart clutter, no extra lines.
⚙️ How to use:
Set your account balance and risk per trade (%).
Enter your entry, stop loss, and (optional) target price.
Instantly see your position size, RR, and volatility data.
📈 Use ATR% to align your stops with real market volatility and avoid random stop-outs.
Position Size CalculatorPosition Size CalculatorRisk Management Made Simple – Size Your Trades Like a Pro!Tired of guessing position sizes and blowing up your account on oversized trades? This Pine Script indicator automates position sizing based on your risk tolerance, ensuring every trade risks only what you've predefined. Perfect for stocks, forex, crypto, or futures—works for long or short setups. Overlay it on your candlestick chart and watch the math do the work.Key Features:Smart Risk Control: Input your account size (e.g., $70k) and risk % (e.g., 1%). It caps your max loss per trade automatically.
Dynamic Entry & Stop: Use live chart close as entry, or click to set a manual entry level (green solid line). For stops, toggle manual placement (red broken line) or use a % distance—auto-calculates the effective % for precision.
Visual Markers: Green line for entry price, red dashed line for stop loss—spans your chart for easy spotting.
Customizable Table: Floating info panel shows Account Size, Risk Amount, Stop Distance %, and Position Size (shares/lots). Drag its position via settings (top-right default).
No More Guesswork: Formula: Position Size = (Account × Risk %) ÷ Stop Distance. Handles edge cases like tiny distances to avoid div-by-zero.
How to Use:Add to your chart via Pine Editor.
In settings: Set account size/risk %. Toggle "Use Manual Entry Price" and click chart to place green line. Do the same for stop (red line) or use % input.
Table updates live—grab the position size and execute!
Pro Tip: For shorts/longs, the abs distance keeps risk symmetric. Test on demo first.
Built for v6—clean, lightweight, and 100% customizable. Share your tweaks in comments! Remember, this is a tool, not advice—trade responsibly. (Inspired by classic Kelly Criterion vibes, but simplified for daily grinders.)

Уровни SL/TP и значение ATR первого часаSession Range SL/TP Levels with Advanced ATR
Overview
The Session Range SL/TP Levels indicator is a comprehensive tool designed for session-based trading strategies, particularly for breakouts. It identifies the high and low of a user-defined time range (e.g., the Asian session) and uses a sophisticated, customizable Average True Range (ATR) calculation to project key Stop Loss (SL) and Take Profit (TP) levels.
This indicator helps traders visualize potential entry and exit points based on the volatility of a specific trading session, with all crucial data presented in a clean on-screen table.
Key Features
Customizable Trading Session: Define any time range to establish your core trading zone. The indicator will automatically find the high and low of this period.
Advanced ATR Calculation: The indicator uses an ATR calculated on a 5-minute timeframe for higher precision. You can customize:
The ATR length and smoothing method (RMA, SMA, EMA, WMA).
A unique percentage reduction from the ATR to create a more conservative volatility buffer.
Volatility-Based SL/TP Levels: Automatically calculates and plots multiple SL and TP levels for both long and short scenarios based on user-defined multipliers of the modified ATR.
Comprehensive On-Screen Display: A detailed on-screen table provides all critical data at a glance, including:
The original 5-min ATR value.
The modified ATR after the percentage reduction.
Three custom ATR-multiple values for quick reference.
All calculated SL and TP price levels for both Long and Short setups.
Copy-Friendly Data Logging: With a single click in the settings, you can print all calculated values into the Pine Logs panel, allowing for easy copying and pasting into other applications or trading journals.
How to Use
Define Your Session: In the settings, enter the time for the trading session you want to analyze (e.g., "0200-0300" for a part of the Asian session).
Identify the Range: The indicator will draw the high and low of this session once the time period is complete.
Plan Your Trade: The calculated levels provide potential targets for breakout trades.
For a Long Trade: If the price breaks above the session high, the green Take Profit lines (TP1, TP2, TP3) serve as potential exit points, while the Stop Loss (Long) level serves as a volatility-based stop.
For a Short Trade: If the price breaks below the session low, the red Take Profit lines serve as potential targets, with the Stop Loss (Short) level as the corresponding stop.
Reference the Table: Use the on-screen table to see the exact price levels and ATR values without needing to hover over the lines.
Enhanced Chande Momentum OscillatorEnhanced Chande Momentum Oscillator (Enh CMO)
📊 Description
The Enhanced Chande Momentum Oscillator is an advanced version of the classic Chande Momentum Oscillator with dynamic envelope boundaries that automatically adapt to market volatility. This indicator provides clear visual signals for potential price reversals and momentum shifts.
Key Features:
Original Chande Momentum Oscillator calculation
Dynamic upper and lower boundaries based on statistical analysis
Adaptive envelope that adjusts to market volatility
Visual fill area between boundaries for easy interpretation
Real-time values table with current readings
Built-in alert conditions for boundary touches
Customizable moving average types (SMA, EMA, WMA)
⚙️ Settings
CMO Settings:
CMO Length (9): Period for calculating the base Chande Momentum Oscillator
Source (close): Price source for calculations
Envelope Settings:
Envelope Length (20): Lookback period for calculating the moving average and standard deviation
Envelope Multiplier (1.5): Multiplier for standard deviation to create upper/lower bounds
Moving Average Type (EMA): Type of moving average for envelope calculation
📈 How to Use
Visual Elements
Lines:
White Line: Main Chande Momentum Oscillator
Red Line: Upper boundary (resistance level)
Green Line: Lower boundary (support level)
Yellow Line: Moving average of CMO (trend direction)
Purple Fill: Visual envelope between boundaries
Reference Lines:
Zero Line: Neutral momentum level
+50/-50 Lines: Traditional overbought/oversold levels
Trading Signals
🔴 Sell/Short Signals
CMO touches or crosses above upper boundary → Potential bearish reversal
CMO is above +50 and declining → Weakening bullish momentum
CMO crosses below yellow MA line while above zero → Momentum shift
🟢 Buy/Long Signals
CMO touches or crosses below lower boundary → Potential bullish reversal
CMO is below -50 and rising → Weakening bearish momentum
CMO crosses above yellow MA line while below zero → Momentum shift
⚡ Advanced Signals
Boundary contraction → Decreasing volatility, potential breakout coming
Boundary expansion → High volatility period, use wider stops
CMO hugging upper boundary → Strong uptrend continuation
CMO hugging lower boundary → Strong downtrend continuation
🎯 Trading Strategies
Strategy 1: Reversal Trading
Wait for CMO to touch extreme boundaries (red or green lines)
Look for divergence with price action
Enter counter-trend position when CMO starts moving back toward center
Set stop beyond the boundary breach point
Take profit near zero line or opposite boundary
Strategy 2: Momentum Confirmation
Use CMO direction to confirm trend
Enter positions when CMO crosses above/below yellow MA line
Hold positions while CMO remains on the correct side of MA
Exit when CMO crosses back through MA line
Strategy 3: Volatility Breakout
Monitor boundary width (envelope expansion/contraction)
When boundaries contract significantly, prepare for breakout
Enter in direction of CMO breakout from narrow range
Use boundary expansion as confirmation signal
⚠️ Important Notes
Best Timeframes
Scalping: 1m, 5m charts
Day Trading: 15m, 30m, 1H charts
Swing Trading: 4H, Daily charts
Market Conditions
Trending Markets: Focus on momentum confirmation signals
Ranging Markets: Focus on boundary reversal signals
High Volatility: Increase envelope multiplier (1.8-2.5)
Low Volatility: Decrease envelope multiplier (1.0-1.3)
Risk Management
Always use stop losses beyond boundary levels
Reduce position size during boundary expansion periods
Combine with price action and support/resistance levels
Monitor the real-time table for precise entry/exit levels
🔔 Alerts
The indicator includes built-in alert conditions:
"CMO Above Upper Bound": Potential reversal down signal
"CMO Below Lower Bound": Potential reversal up signal
Set these alerts to catch opportunities without constantly monitoring charts.
💡 Tips for Success
Combine with other indicators: Use with RSI, MACD, or volume indicators for confirmation
Watch for divergences: CMO making new highs/lows while price doesn't follow
Use multiple timeframes: Check higher timeframe CMO for overall trend context
Adjust settings for different assets: Crypto may need different settings than forex
Paper trade first: Test the indicator with your trading style before using real money
🎨 Customization Tips
Change colors in the Pine Script to match your chart theme
Adjust envelope length for faster (shorter) or slower (longer) signals
Modify envelope multiplier based on asset volatility
Hide the table if it obstructs your view by commenting out the table section
Complete trading solution: Pair with the Optimus Indicator (paid indicator) for multi-timeframe trend analysis and trend signals.
Together they create a powerful confluence system for professional trading setups.

Apex Edge – Wolfe Wave HunterApex Edge – Wolfe Wave Hunter
The modern Wolfe Wave, rebuilt for the algo era
This isn’t just another Wolfe Wave indicator. Classic Wolfe detection is rigid, outdated, and rarely tradable. Apex Edge – Wolfe Wave Hunter re-engineers the pattern into a modern, SMC-driven model that adapts to today’s liquidity-dominated markets. It’s not about drawing pretty shapes – it’s about extracting precision entries with asymmetric risk-to-reward potential.
🔎 What it does
Automatic Wolfe Wave Detection
Identifies bullish and bearish Wolfe Wave structures using pivot-based logic, symmetry filters, and slope tolerances.
Channel Glow Zones
Highlights the Wolfe channel and projects it forward into the future (bars are user-defined). This allows you to see the full potential of the trade before price even begins its move.
Stop Loss (SL) & Entry Arrow
At the completion of Wave 5, the algo prints a Stop Loss line and a tiny entry arrow (green for bullish, red for bearish). but the colours can be changed in user settings. This is the “execution point” — where the Wolfe setup becomes tradable.
Target Projection Lines
TP1 (EPA): Derived from the traditional 1–4 line projection.
TP2 (1.272 Fib): Optional secondary profit target.
TP3 (1.618 Fib): Optional extended target for large runners.
All TP lines extend into the future, so you can track them as price evolves.
Volume Confirmation (optional)
A relative volume filter ensures Wave 5 is formed with meaningful market participation before a setup is confirmed.
Alerts (ready out of the box)
Custom alerts can be fired whenever a bullish or bearish Wolfe Wave is confirmed. No need to babysit the charts — let the script notify you.
⚙️ Customisation & User Control
Every trader’s market and style is different. That’s why Wolfe Wave Hunter is fully customisable:
Arrow Colours & Size
Works on both light and dark charts. Choose your own bullish/bearish entry arrow colours for maximum visibility.
Tolerance Levels
Adjust symmetry and slope tolerance to refine how strict the channel rules are.
Tighter settings = fewer but cleaner zones.
Looser settings = more frequent setups, but with slightly lower structural quality.
Channel Glow Projection
Define how many bars forward the channel is drawn. This controls how far into the future your Wolfe zones are extended.
Stop Loss Line Length
Keep the SL visible without it extending infinitely across your chart.
Take Profit Line Colors
Each TP projection can be styled to your preference, allowing you to clearly separate TP1, TP2, and TP3.
This isn’t a one-size-fits-all tool. You can shape Wolfe detection logic to match the pairs, timeframes, and market conditions you trade most.
🚀 Why it’s different
Classic Wolfe waves are rare — this script adapts the model into something practical and tradeable in modern markets.
Liquidity-aligned — many setups align with structural sweeps of Wave 3 liquidity before driving into profit.
Entry built-in — most Wolfe scripts only draw the structure. Wolfe Wave Hunter gives you a precise entry point, SL, and projected TPs.
Backtest-friendly — you’ll quickly discover which assets respect Wolfe waves and which don’t, creating your own high-probability Wolfe watchlist.
⚠️ Limitations & Disclaimer
Not all markets respect Wolfe Waves. Some FX pairs, metals, and indices respect the structure beautifully; others do not. Backtest and create your own shortlist.
No guaranteed sweeps. Many entries occur after a liquidity sweep of Wave 3, but not all. The algo is designed to detect Wolfe completion, not enforce textbook liquidity rules.
Probabilistic, not predictive. Wolfe setups don’t win every time. Always use risk management.
High-RR focus. This is not a high-frequency tool. It’s designed for precision, asymmetric setups where risk is small and reward potential is large.
✅ The Bottom Line
Apex Edge – Wolfe Wave Hunter is a modern reimagination of the Wolfe Wave. It blends structural geometry, liquidity dynamics, and algo-driven execution into a single tool that:
Detects the pattern automatically
Provides SL, entry, and TP levels
Offers alerts for hands-off trading
Allows deep customisation for different markets
When it hits, it delivers outstanding risk-to-reward. Backtest, refine your tolerances, and build your watchlist of assets where Wolfe structures consistently pay.
This isn’t just Wolfe detection — it’s Wolfe trading, rebuilt for the modern trader.
Developer Notes - As always with the Apex Edge Brand, user feedback and recommendations will always be respected. Simply drop us a message with your comments and we will endeavour to address your needs in future version updates.

Omega ATR Indicator📖 Introduction
The Ω ATR Indicator was created to provide a more complete and professional framework for volatility analysis than the classic Average True Range (ATR).
While the traditional ATR is a useful tool, it has limitations: it delivers a simple rolling average of volatility, but it does not adapt to market regimes, it does not highlight extreme events, and it often leaves the trader with incomplete information about risk.
The Ω ATR takes the same foundation and elevates it into a multi-dimensional volatility dashboard, adding statistical layers, adaptive calculations, and clear visual references that allow traders to interpret volatility in a way that is immediately actionable.
🔎 What makes it different from a standard ATR?
This indicator introduces several features beyond the classic formula:
True Range Core – plots the raw True Range (TR) for each bar, providing a direct, bar-by-bar view of volatility impulses.
Standard & Adjusted ATR – includes both the conventional ATR (smoothed average) and an Adjusted ATR that automatically corrects for extreme conditions by incorporating percentile rescaling.
Percentile Volatility Levels – dynamically calculated extreme thresholds (99.8%, 75%, 50%, 25%), plotted as dotted levels across the chart. These act as reference lines for “normal” vs. “abnormal” volatility, useful for spotting unusual price expansions or contractions.
Linear Regression Volatility Trend – overlays a regression line of volatility, showing whether the market is moving toward expansion (rising vol), contraction (falling vol), or stability.
Monetary Value Translation – the indicator converts volatility into points, ticks, and dollar values (based on the instrument’s point value). This allows futures traders and high-value instruments users to immediately see how much volatility is “worth” in cash terms.
Interactive Table Display – a real-time statistics table is displayed directly on the chart, showing:
SMA of ATR in $ and points
Percentile-based volatility range (VAR) in $ and points
Tick equivalences, for quick position sizing
⚡ How traders can use it
The Ω ATR Indicator is designed to be versatile, fitting both discretionary traders and systematic strategy developers.
Risk Management: ATR-based stop losses and position sizing are significantly improved by using the adjusted ATR and percentile thresholds. Traders can size their positions according to volatility regimes, not just raw averages.
Breakout & Exhaustion Detection: When TR or ATR values spike above the 99.8% or 95% percentile levels, this often corresponds to breakout conditions or volatility exhaustion — useful for breakout strategies, mean-reversion setups, and volatility fades.
Market Regime Identification: The regression line helps distinguish if volatility is rising (trending environment, larger swings expected) or compressing (range-bound environment, lower risk opportunities).
Multi-Asset Flexibility: Works equally well on equities, futures, crypto, and FX. Its point/tick/dollar conversion makes it especially powerful for futures traders who need to quantify risk precisely.
Scalping to Swing Trading: On lower timeframes, it acts as a micro-volatility detector; on higher timeframes, it functions as a strategic risk gauge for position management.
⚙️ Settings and Customization
Length: The ATR lookback period (default = 34).
Shorter lengths (14–21) for intraday traders who want fast response.
Longer lengths (34–55) for swing/position traders who want smoother readings.
AVG / ADJ AVG: Toggle to display the standard ATR or the adjusted ATR.
Volatility Levels: Enable/disable up to 4 percentile-based levels (1st = 25%, 2nd = 50%, 3rd = 75%, 4th = 99.8%). Recommended: keep 3 levels active for clarity.
Color Controls: All plots and levels are fully customizable to match your chart style.
Table Display: Positioned on the chart (default: middle-right) with key values updated in real time.
🧭 Best Practices for Use
Combine with Trend Tools: Volatility readings are most powerful when combined with trend filters or volume analysis. For example, a breakout with both high volatility and trend confirmation is stronger than either alone.
ATR Stops: Use the Adjusted ATR rather than the standard one when trailing stops in highly volatile instruments like crypto or Nasdaq futures, as it adapts to outlier spikes.
Dollar Risk Translation: Use the dollar-value outputs to predefine maximum acceptable risk per trade (e.g., “I only risk $250 per position”). This bridges volatility to portfolio risk management.
Event Monitoring: Around economic events or earnings, expect volatility spikes above higher percentile levels. The indicator makes these moves instantly visible.
📌 Summary
The Ω ATR Indicator is not just “another ATR.” It is a comprehensive volatility framework that transforms volatility from a simple statistic into an actionable trading signal.
By combining:
the classic ATR,
an adjusted ATR,
percentile extremes,
regression-based volatility trends,
and real-time dollar conversions,
…this tool allows traders to precisely understand, visualize, and act on volatility in ways that a standard ATR simply cannot provide.
Whether you are scalping intraday moves, swing trading equities, or managing futures positions, the Ω ATR equips you with a professional-grade volatility dashboard that clarifies risk, highlights opportunity, and adapts across all markets and timeframes.
👉 Designed and developed by OmegaTools for traders who demand precision, clarity, and adaptability in their volatility analysis.
