ZS Game Changer Pump & Dump DetectorZS GAME CHANGER PUMP AND DUMP DETECTOR - TOP 2 MOMENTUM TRACKER
Created by Zakaria Safri
An intelligent indicator specifically designed to identify and highlight the two most significant pump and dump candles within your selected lookback period. Perfect for traders who want to focus on the game-changing moves that truly matter in volatile markets like cryptocurrency, stocks, and forex.
CORE FEATURES
AUTOMATIC GAME CHANGER DETECTION
The indicator continuously scans your specified lookback period and automatically identifies the top 2 strongest pump candles and top 2 strongest dump candles. These game-changing candles are highlighted with distinctive gold labels and horizontal reference lines, making them instantly visible on your chart. Unlike other indicators that show every small move, this focuses exclusively on the market-moving moments that define trends and create opportunities.
INTELLIGENT PUMP AND DUMP CLASSIFICATION
Uses advanced percentage-based calculations to classify candles as pumps when price surges significantly upward and dumps when price plunges sharply downward. The detection system accounts for candle body size, wick proportions, and volume confirmation to ensure only legitimate momentum moves trigger signals. Customizable thresholds allow adaptation to any market volatility profile from calm stocks to wild altcoins.
ADVANCED WICK EXCLUSION FILTER
Eliminates false signals caused by candles with large wicks and small bodies. This filter focuses analysis exclusively on candles with substantial body sizes that indicate genuine directional conviction rather than temporary spikes followed by rejection. The body to candle ratio is fully adjustable to match your preferred signal quality standards.
VOLUME CONFIRMATION SYSTEM
Optional volume filter ensures detected pumps and dumps are backed by real market participation. The indicator compares current volume against a moving average and only triggers signals when volume exceeds your specified multiplier threshold. This eliminates low-volume noise and focuses on moves supported by institutional or crowd participation.
RALLY SEQUENCE DETECTION
Identifies and highlights consecutive sequences of pump or dump candles with colored background overlays. Green background indicates sustained buying pressure across multiple candles while red background shows sustained selling pressure. The rally detection system includes an optional one-miss allowance that prevents the sequence from breaking due to a single neutral candle.
HORIZONTAL REFERENCE LINES
Draws dashed lines from each game changer candle extending to the current bar, providing constant visual reference to the most significant support and resistance levels created by extreme momentum. The top game changer gets a thick dashed line while the second gets a dotted line for easy differentiation. Labels on the right side display the exact percentage move.
COMPREHENSIVE STATISTICS DASHBOARD
Real-time information panel showing current market status as pumping, dumping, or neutral along with the current candle percentage change. Displays the exact percentage values for top pump number 1, top pump number 2, top dump number 1, and top dump number 2. Shows running totals of all pumps and dumps detected since chart load. Tracks consecutive candle counts during active rally sequences.
TESTING AND VERIFICATION MODE
Built-in debug mode displays percentage change directly on each qualifying pump and dump candle, allowing instant verification that calculations are accurate. Shows which filters are currently active with a simple code in the dashboard. Helps traders understand exactly why certain candles qualified as game changers.
HOW THE GAME CHANGER DETECTION WORKS
SCANNING ALGORITHM
Every bar close, the indicator scans backward through your specified lookback period examining every candle's percentage change from its previous close. For bullish moves, it identifies the two candles with the largest positive percentage change that meet your threshold requirements. For bearish moves, it identifies the two candles with the largest negative percentage change meeting threshold requirements.
RANKING SYSTEM
Candles are ranked purely by their percentage move magnitude. The number 1 game changer is always the single strongest move in the lookback period. The number 2 game changer is the second strongest move. Rankings update dynamically as new candles form and old candles exit the lookback window.
VISUAL IDENTIFICATION
Game changer number 1 for both pumps and dumps receives a large gold label reading GAME CHANGER NUMBER 1 with zero transparency for maximum visibility. Game changer number 2 receives a slightly smaller gold label with partial transparency. The candle bars themselves are colored in gold instead of the standard green or red. Horizontal lines extend from the game changer price level to current bar.
FILTER APPLICATION
Only candles that pass your configured filters qualify for game changer consideration. If wick exclusion is enabled, candles with large wicks and small bodies are ignored. If volume confirmation is enabled, only candles with above-average volume qualify. This ensures game changers represent legitimate market moves rather than aberrations.
PRACTICAL APPLICATIONS
FOR CRYPTOCURRENCY TRADERS
Crypto markets experience extreme volatility with occasional massive pump and dump candles that define entire trends. This indicator instantly identifies which candles represent true market structure shifts versus normal noise. Use the game changer levels as key support and resistance for entries, exits, and stop placement. The top pump often marks the local high to watch for breakouts while the top dump marks the local low for reversal trades.
FOR DAY TRADERS
Intraday charts contain hundreds of candles but only a few truly matter for the session outcome. Game changer detection filters out 98 percent of candles to show you the 2 percent that drove the actual price movement. Enter trades on the side of the strongest recent game changer. Use game changer levels as magnet prices where algorithmic trading often returns.
FOR SWING TRADERS
On daily and four-hour timeframes, game changers represent major institutional activity or news-driven moves. The top dump often marks capitulation selling that creates reversal opportunities. The top pump often marks FOMO buying that creates resistance levels. Swing traders can build positions knowing these levels will be defended or tested multiple times.
FOR VOLATILITY ANALYSIS
Understanding which candles created the most volatility helps assess market risk. Multiple game changers clustered together indicate unstable choppy conditions. Game changers separated by many neutral candles indicate trending stable conditions. Use this context to adjust position sizing and stop distances appropriately.
FOR SUPPORT AND RESISTANCE TRADING
Game changer candles create the strongest support and resistance levels because they represent prices where massive volume transacted in short time periods. These levels have higher probability of holding on retest compared to arbitrary moving averages or pivot points. Trade bounces off game changer levels or breakouts through them.
RECOMMENDED SETTINGS BY MARKET
CRYPTOCURRENCY 15-MINUTE TO 1-HOUR CHARTS
Candle Size Threshold: 2.0 percent
Body to Candle Ratio: 0.5
Volume Multiplier: 1.5 times average
Game Changer Lookback: 100 bars
Extreme Threshold: 3.5 percent
Enable Wick Filter: Yes
Enable Volume Confirmation: Yes
Minimum Rally Candles: 3
STOCKS DAILY CHARTS
Candle Size Threshold: 1.0 percent
Body to Candle Ratio: 0.6
Volume Multiplier: 2.0 times average
Game Changer Lookback: 50 bars
Extreme Threshold: 2.5 percent
Enable Wick Filter: Yes
Enable Volume Confirmation: Yes
Minimum Rally Candles: 2
FOREX 1-HOUR TO 4-HOUR CHARTS
Candle Size Threshold: 0.5 percent
Body to Candle Ratio: 0.5
Volume Multiplier: Not applicable
Game Changer Lookback: 80 bars
Extreme Threshold: 1.0 percent
Enable Wick Filter: Yes
Enable Volume Confirmation: No
Minimum Rally Candles: 3
SCALPING 1-MINUTE TO 5-MINUTE CHARTS
Candle Size Threshold: 0.8 percent
Body to Candle Ratio: 0.4
Volume Multiplier: 1.2 times average
Game Changer Lookback: 50 bars
Extreme Threshold: 1.5 percent
Enable Wick Filter: No
Enable Volume Confirmation: Yes
Minimum Rally Candles: 2
WHAT IS INCLUDED
Automatic identification of top 2 pump candles
Automatic identification of top 2 dump candles
Gold colored game changer labels with size differentiation
Gold colored candle bars for game changers
Horizontal reference lines from game changers to current price
Regular pump and dump detection with green and red candles
Rally sequence detection with background highlighting
Extreme move detection and labeling system
Real-time statistics dashboard with all key metrics
Percentage change debug mode for verification
Volume confirmation filter with adjustable multiplier
Wick exclusion filter with adjustable body ratio
Customizable lookback period from 20 to 500 bars
Consecutive candle counter for rally tracking
Alert system for game changers, pumps, dumps, and rallies
Works on all timeframes from 1 minute to monthly
Compatible with stocks, forex, cryptocurrency, and futures
UNDERSTANDING GAME CHANGERS
WHAT MAKES A CANDLE A GAME CHANGER
A game changer is not just a large move but the largest move within context. In a volatile crypto market, a 5 percent pump might not rank in the top 2. In a stable stock, a 2 percent pump could be the number 1 game changer. The indicator adapts to your specific instrument and timeframe to find what truly matters in that context.
WHY FOCUS ON TOP 2 ONLY
Markets are driven by a small number of significant moves rather than the average of all moves. By focusing exclusively on the top 2 in each direction, traders can ignore noise and concentrate on the price levels that actually matter for support, resistance, and momentum. This creates clarity in decision making.
GAME CHANGERS AS MARKET STRUCTURE
The top pump often marks the recent high that bulls must break to continue uptrend. The top dump often marks the recent low that bears must break to continue downtrend. These become the key levels around which all other price action rotates. Understanding this structure is essential for profitable trading.
GAME CHANGERS AS SENTIMENT INDICATORS
Consecutive pump game changers signal strong bullish sentiment and FOMO conditions. Consecutive dump game changers signal fear and capitulation. Alternating pump and dump game changers signal indecision and range conditions. Read the pattern of game changers to gauge market psychology.
VERIFICATION AND TESTING
HOW TO VERIFY ACCURACY
Enable Show Debug Info on Chart in the Testing and Debug settings group. This displays the percentage change calculation directly on every qualifying pump and dump candle. Manually verify by calculating open minus close divided by close multiplied by 100. The debug percentage should match your manual calculation exactly.
HOW TO TEST FILTERS
Toggle wick exclusion filter on and off while watching how many candles qualify. With filter on, candles with long wicks and small bodies should disappear. Toggle volume confirmation on and off to see how low-volume candles get excluded. Adjust the thresholds and watch the real-time impact on signal count.
HOW TO VERIFY GAME CHANGERS
Look at your chart and visually identify which candle had the biggest green body in the lookback period. The game changer number 1 pump label should be on that exact candle. Repeat for the biggest red candle to verify game changer number 1 dump. The rankings should match your visual assessment.
LOOKBACK PERIOD EFFECTS
Decrease the lookback period to 20 bars and watch game changers update to only recent moves. Increase to 500 bars and watch game changers potentially change to older historic moves. The optimal lookback balances recency with significance. Too short misses important levels, too long includes irrelevant history.
DASHBOARD INFORMATION GUIDE
STATUS ROW
Shows PUMPING when current candle qualifies as a pump, DUMPING when current candle qualifies as a dump, or NEUTRAL when current candle does not meet threshold requirements. This updates in real-time on every bar close.
CURRENT CHANGE ROW
Displays the percentage change of the current candle from its previous close. Positive percentages indicate bullish candle, negative indicate bearish candle. This number may or may not meet your threshold to qualify as pump or dump.
TOP PUMP NUMBER 1
The highest positive percentage change found in your lookback period. This candle is marked with the large gold GAME CHANGER NUMBER 1 label below it. Shows N/A if no pumps exist in the lookback period.
TOP PUMP NUMBER 2
The second highest positive percentage change found in your lookback period. Marked with smaller gold GAME CHANGER NUMBER 2 label. Shows N/A if only one or zero pumps exist.
TOP DUMP NUMBER 1
The highest negative percentage change magnitude found in your lookback period. This candle is marked with the large gold GAME CHANGER NUMBER 1 label above it. Shows N/A if no dumps exist.
TOP DUMP NUMBER 2
The second highest negative percentage change magnitude found in your lookback period. Marked with smaller gold GAME CHANGER NUMBER 2 label. Shows N/A if only one or zero dumps exist.
TOTAL PUMPS
Running count of all pump candles detected since you loaded the indicator on this chart. This number continuously increases as new qualifying pumps form. Resets when you reload the chart.
TOTAL DUMPS
Running count of all dump candles detected since chart load. Increases as new qualifying dumps form and resets on chart reload.
CONSECUTIVE
Shows the current count of consecutive pump or dump candles during an active rally. Displays 3 UP during a 3-candle pump rally or 5 DN during a 5-candle dump rally. Shows 0 when no rally is active.
ALERT SYSTEM
GAME CHANGER DETECTED ALERT
Triggers whenever the current candle becomes one of the top 2 pumps or top 2 dumps. This is the highest priority alert indicating a market-moving event just occurred. Use this alert for immediate notification of significant opportunities.
PUMP DETECTED ALERT
Triggers on every candle that qualifies as a pump according to your threshold and filter settings. This includes regular pumps and extreme pumps but excludes game changers which have their separate alert. Use for general upward momentum monitoring.
DUMP DETECTED ALERT
Triggers on every candle that qualifies as a dump according to your settings. Includes regular and extreme dumps but excludes game changers. Use for general downward momentum monitoring.
PUMP RALLY STARTED ALERT
Triggers when consecutive pump candles reach your minimum rally threshold. Indicates the beginning of a sustained upward movement sequence. Use to catch trends early.
DUMP RALLY STARTED ALERT
Triggers when consecutive dump candles reach your minimum rally threshold. Indicates the beginning of a sustained downward movement sequence. Use for trend following or reversal timing.
ALERT MESSAGE FORMAT
All alerts include the ticker symbol and current price using TradingView placeholders. Messages are descriptive and specify which type of signal triggered. Alerts work with TradingView notification system including email, SMS, webhook, and app notifications.
TECHNICAL SPECIFICATIONS
CALCULATION METHODOLOGY
Percentage change calculated as current close minus previous close divided by previous close multiplied by 100. Body ratio calculated as absolute value of close minus open divided by high minus low. Volume elevation calculated as current volume divided by 20-period simple moving average of volume. Game changer ranking uses absolute value comparison across entire lookback array.
PERFORMANCE CHARACTERISTICS
Lightweight calculations optimized for speed on all timeframes. No repainting of signals ensuring all triggers are final on bar close. Variables properly scoped with var keyword for memory efficiency. Maximum bars back set to 500 to prevent excessive historical loading. Updates in real-time on every bar close without lag.
COMPATIBILITY
Works on all TradingView plans including free, pro, and premium. Compatible with stocks, forex, cryptocurrency, futures, indices, and commodities. Functions correctly on all timeframes from 1 second to monthly. No external data requests ensuring fast loading. Overlay true setting places directly on price chart.
RISK DISCLAIMER
This indicator is a technical analysis tool for identifying momentum and should not be used as the sole basis for trading decisions. Game changer levels can be broken during strong trends and are not guaranteed support or resistance. Pump and dump detection does not predict future price direction. Always use proper risk management with stop losses on every trade. Combine this indicator with other forms of analysis including fundamentals, market context, and risk assessment. Practice on demo accounts before live trading. Past performance of game changer signals does not guarantee future results. Trading carries substantial risk of loss and is not suitable for all investors. The creator is not responsible for trading losses incurred while using this tool.
SUPPORT AND UPDATES
Regular updates based on user feedback and market evolution. Built following PineCoders industry standards and best practices for code quality. Clean well-documented code structure for transparency and auditability. Optimized performance across all timeframes and instruments. Active development with continuous improvements and feature additions.
WHY CHOOSE ZS GAME CHANGER PUMP AND DUMP DETECTOR
Focuses on what matters by highlighting only the top 2 moves in each direction instead of cluttering your chart with every small fluctuation. Saves time by automatically identifying the most significant candles rather than requiring manual scanning. Provides clarity through visual gold labels and reference lines that make game changers unmistakable. Adapts to any market with customizable thresholds for volatility and volume. Eliminates noise with advanced wick and volume filters ensuring signal quality. Offers verification through debug mode proving calculations are accurate and trustworthy. Includes comprehensive statistics showing exact percentages and counts. Works everywhere across all markets, timeframes, and instruments without modification.
Transform your chart analysis by focusing exclusively on the game-changing moments that define trends and create opportunities.
Version 1.1 | Created by Zakaria Safri | Pine Script Version 5 | PineCoders Compliant
Buscar en scripts para "stop loss"

Total Info Indicator by MikePenzin
Install & Add to Chart
• Copy the script into Pine Editor → click Add to Chart .
• Open the ⚙️ Settings → Inputs to customize.
What It Does
• Displays key info in a floating table — trend, volume, ATR, RSI, stop loss, and more.
• Detects breakouts , smart SELL signals , and opening strength .
• Uses emojis and colours to make trends easy to read: 🟢 good, 🟡 neutral, 🔴 risky.
For Swing Traders
• Works best on Daily or 4H charts.
• Watch for 🟢 Uptrend + ⚡BUY / 🔥BUY breakout signals.
• Use ATR-based Stop Loss (shown in table).
• Avoid new entries a few days before earnings.
Suggested Setup
• 20/50/150 MA Lines: ON
• 200 MA Line: optional
• ATR Multiplier: 1.3
• Breakout Detection: ON (Volume + RSI + Trend filters)
• Smart SELLs: ON (RSI 70, EMA 20)
• Pivots: ON for quick swing levels
How to Read
• MA Row: 🟢 = price above MA (bullish).
• ATR/Stop Loss: Suggests where to place protective stop.
• Volume Info: Today’s vs 20-day average, plus pace.
• RSI & CCI: Shows momentum and overbought/oversold levels.
• Breakouts: ⚡BUY (early), 🔥BUY (confirmed).
• Smart SELLs: RSI🔴 / DIV🟣 / EMA🔵 mean potential exit zones.
Example Use
1️⃣ Find stocks with Uptrend 🟢 , rising volume, and ⚡BUY signal.
2️⃣ Enter near breakout; set Stop = shown level.
3️⃣ Take profits or trail when Smart SELLs appear or RSI peaks.
Tips
• Choose table corner under “Table Visualization.”
• Reduce clutter on small timeframes (turn off Pivots/200 MA).
• Use “Volume speed” to spot surging interest before breakouts.
• Compatible with most equities and ETFs.
Disclaimer
This script is for education & analysis only .
Not financial advice — always manage your own risk.

1m Scalping ATR (with SL & Zones)A universal ATR indicator that anchors volatility to your stop-loss.
Read any market (FX, JPY pairs, Gold/Silver, indices, crypto) consistently—regardless of pip/point conventions and timeframe.
Why this indicator?
Classic ATR is absolute (pips/points) and feels different across markets/TFs. ATR Takeoff normalizes ATR to your stop-loss in pips and highlights clear zones for “quiet / ideal / too volatile,” so you instantly know if a 10-pip SL fits current conditions.
Key features
Auto pip detection (FX, JPY, XAU/XAG, indices, BTC/ETH).
Selectable ATR source: chart timeframe or fixed ATR TF (e.g., “15”, “30”, “60”).
Display modes:
Percent of SL – ATR relative to SL in %, great for M1 (typical 10–30%).
Multiple of SL – ATR as a multiple of SL (e.g., 0.6× / 1.0× / 1.2×).
Panel zones:
Green = “Ready for takeoff” (≤ Low), Yellow = reference (Mid), Red = too volatile (≥ High).
Status badge (top-right): Quiet / ATR ok / Wild, current ATR/SL value, ATR TF used.
Direction-agnostic: Works the same for longs and shorts.
Inputs (at a glance)
Length / Smoothing (RMA/SMA/EMA/WMA): ATR base settings.
Your Stop-Loss (Pips): Reference SL (e.g., 10).
ATR Timeframe (empty = chart): Use chart TF or a fixed TF.
Display Mode: “Percent of SL” or “Multiple of SL.”
Low/Mid/High (Percent Mode): Zone thresholds in % of SL.
Low/Mid/High (Multiple Mode): Zone thresholds in ×SL.
Recommended defaults
Length 14, Smoothing RMA, SL 10 pips
Display Mode: Percent of SL
Low/Mid/High (%): 15 / 20 / 25
ATR Timeframe: empty (= chart) for reactive, or “30” for smoother M30 context with M1 entries.
How to use
Set SL (pips). 2) Choose display mode. 3) Optionally pick ATR TF.
Interpretation:
≤ Low (green): setups allowed.
≈ Mid (yellow): neutral reference.
≥ High (red): too volatile → adjust SL/size or wait.
Note: Auto-pip relies on common ticker naming; verify on exotic symbols.
Disclaimer: For research/education. Not financial advice.

RSI DCA StrategyThis strategy combines RSI oversold signals with a Dollar-Cost Averaging (DCA) buying approach.
Trigger:
When the RSI (Relative Strength Index) crosses below 30, the strategy marks an oversold condition.
DCA Entry:
Once triggered, the strategy executes up to three consecutive daily entries (1 per day), splitting the predefined capital equally (configurable by user).
Position Management:
Take Profit at a configurable % above the average entry price.
Stop Loss at a configurable % below the average entry price.
Exit Conditions:
The strategy automatically exits either on reaching Take Profit or Stop Loss.
Visualization:
RSI plotted with oversold line (30).
Take Profit and Stop Loss lines displayed after entry.
Performance Reporting:
Includes an optional monthly performance table for evaluating results by month.
Note:
This strategy is for testing RSI-based mean reversion with staggered entries. It is not financial advice and should be optimized and validated for each market or timeframe before practical use.

2ATR / Current Price %### **Real-Time 2ATR Volatility Ratio Indicator**
---
### **Overview**
This indicator provides a quick and visual way to understand market volatility by calculating the ratio between the **2ATR (Average True Range)** and the **current price**.
* **ATR (Average True Range)** is a widely-used measure of market volatility, showing the average price movement over a specific period.
* **2ATR** represents a price move that is twice the average volatility. Traders often use this value as a benchmark for potential support/resistance levels or for setting a dynamic stop-loss.
### **Key Features**
* **Real-Time Calculation**: Unlike many indicators that rely on the previous candle's close, this script calculates the 2ATR ratio using the **real-time current price**, providing you with up-to-the-second data.
* **Intuitive Display**: The final percentage value is shown in a clear **yellow label** at the **bottom-right** of your chart, making it easy to monitor without cluttering your view.
* **Customizable Input**: You can adjust the `ATR Period` setting to change the sensitivity of the volatility calculation, allowing you to adapt the indicator to different trading styles and timeframes.
### **How to Use It**
This tool is especially useful for **risk management and setting stop-loss orders**. The percentage displayed on the label tells you how much the price would need to move from its current level to equal a 2ATR change.
**Example**: If the indicator shows **3.5%**, it means a price drop of 3.5% from the current level would be equal to a 2ATR move. This gives you a clear and quantifiable number to help you set a **logical stop-loss** or to quickly assess the potential downside risk before entering a trade.

Turtle Trading with LayeringCrafted professional write-up for TradingView indicator publication.
Turtle Trading with Layering System
A complete implementation of the famous turtle trading strategy with proper position layering/pyramiding for manual trading.
Features
Core Turtle System:
20-day breakout entries (primary signals)
55-day breakout entries (backup after losses)
10-day reverse breakout exits
ATR-based stop losses and position sizing
Position Layering:
Build positions gradually as trends develop
Add up to 4 units per position
Each unit added every 0.5 ATR in your favor
Single stop loss protects entire position

Composite Time ProfileComposite Time Profile Overlay (CTPO) - Market Profile Compositing Tool
Automatically composite multiple time periods to identify key areas of balance and market structure
What is the Composite Time Profile Overlay?
The Composite Time Profile Overlay (CTPO) is a Pine Script indicator that automatically composites multiple time periods to identify key areas of balance and market structure. It's designed for traders who use market profile concepts and need to quickly identify where price is likely to find support or resistance.
The indicator analyzes TPO (Time Price Opportunity) data across different timeframes and merges overlapping profiles to create composite levels that represent the most significant areas of balance. This helps you spot where institutional traders are likely to make decisions based on accumulated price action.
Why Use CTPO for Market Profile Trading?
Eliminate Manual Compositing Work
Instead of manually drawing and compositing profiles across different timeframes, CTPO does this automatically. You get instant access to composite levels without spending time analyzing each individual period.
Spot Areas of Balance Quickly
The indicator highlights the most significant areas of balance by compositing overlapping profiles. These areas often act as support and resistance levels because they represent where the most trading activity occurred across multiple time periods.
Focus on What Matters
Rather than getting lost in individual session profiles, CTPO shows you the composite levels that have been validated across multiple timeframes. This helps you focus on the levels that are most likely to hold.
How CTPO Works for Market Profile Traders
Automatic Profile Compositing
CTPO uses a proprietary algorithm that:
- Identifies period boundaries based on your selected timeframe (sessions, daily, weekly, monthly, or auto-detection)
- Calculates TPO profiles for each period using the C2M (Composite 2 Method) row sizing calculation
- Merges overlapping profiles using configurable overlap thresholds (default 50% overlap required)
- Updates composite levels as new price action develops in real-time
Key Levels for Market Profile Analysis
The indicator displays:
- Value Area High (VAH) and Value Area Low (VAL) levels calculated from composite TPO data
- Point of Control (POC) levels where most trading occurred across all composited periods
- Composite zones representing areas of balance with configurable transparency
- 1.618 Fibonacci extensions for breakout targets based on composite range
Multiple Timeframe Support
- Sessions: For intraday market profile analysis
- Daily: For swing trading with daily profiles
- Weekly: For position trading with weekly structure
- Monthly: For long-term market profile analysis
- Auto: Automatically selects timeframe based on your chart
Trading Applications for Market Profile Users
Support and Resistance Trading
Use composite levels as dynamic support and resistance zones. These levels often hold because they represent areas where significant trading decisions were made across multiple timeframes.
Breakout Trading
When composite levels break, they often lead to significant moves. The indicator calculates 1.618 Fibonacci extensions to give you clear targets for breakout trades.
Mean Reversion Strategies
Value Area levels represent the price range where most trading activity occurred. These levels often act as magnets, drawing price back when it moves too far from the mean.
Institutional Level Analysis
Composite levels represent areas where institutional traders have made significant decisions. These levels often hold more weight than traditional technical analysis levels because they're based on actual trading activity.
Key Features for Market Profile Traders
Smart Compositing Logic
- Automatic overlap detection using price range intersection algorithms
- Configurable overlap thresholds (minimum 50% overlap required for merging)
- Dead composite identification (profiles that become engulfed by newer composites)
- Real-time updates as new price action develops using barstate.islast optimization
Visual Customization
- Customizable colors for active, broken, and dead composites
- Adjustable transparency levels for each composite state
- Premium/Discount zone highlighting based on current price vs composite range
- TPO aggression coloring using TPO distribution analysis to identify buying/selling pressure
- Fibonacci level extensions with 1.618 target calculations based on composite range
Clean Chart Presentation
- Only shows the most relevant composite levels (maximum 10 active composites)
- Eliminates clutter from individual session profiles
- Focuses on areas of balance that matter most to current price action
Real-World Trading Examples
Day Trading with Session Composites
Use session-based composites to identify intraday areas of balance. The VAH and VAL levels often act as natural profit targets and stop-loss levels for scalping strategies.
Swing Trading with Daily Composites
Daily composites provide excellent swing trading levels. Look for price reactions at composite zones and use the 1.618 extensions for profit targets.
Position Trading with Weekly Composites
Weekly composites help identify major trend changes and long-term areas of balance. These levels often hold for months or even years.
Risk Management
Composite levels provide natural stop-loss levels. If a composite level breaks, it often signals a significant shift in market sentiment, making it an ideal place to exit losing positions.
Why Composite Levels Work
Composite levels work because they represent areas where significant trading decisions were made across multiple timeframes. When price returns to these levels, traders often remember the previous price action and make similar decisions, creating self-fulfilling prophecies.
The compositing process uses a proprietary algorithm that ensures only levels validated across multiple time periods are displayed. This means you're looking at levels that have proven their significance through actual market behavior, not just random technical levels.
Technical Foundation
The indicator uses TPO (Time Price Opportunity) data combined with price action analysis to identify areas of balance. The C2M row sizing method ensures accurate profile calculations, while the overlap detection algorithm (minimum 50% price range intersection) ensures only truly significant composites are displayed. The algorithm calculates row size based on ATR (Average True Range) divided by 10, then converts to tick size for precise level calculations.
How the Code Actually Works
1. Period Detection and ATR Calculation
The code first determines the appropriate timeframe based on your chart:
- 1m-5m charts: Session-based profiles
- 15m-2h charts: Daily profiles
- 4h charts: Weekly profiles
- 1D charts: Monthly profiles
For each period type, it calculates the number of bars needed for ATR calculation:
- Sessions: 540 minutes divided by chart timeframe
- Daily: 1440 minutes divided by chart timeframe
- Weekly: 7 days worth of minutes divided by chart timeframe
- Monthly: 30 days worth of minutes divided by chart timeframe
2. C2M Row Size Calculation
The code calculates True Range for each bar in the determined period:
- True Range = max(high-low, |high-prevClose|, |low-prevClose|)
- Averages all True Range values to get ATR
- Row Size = (ATR / 10) converted to tick size
- This ensures each TPO row represents a meaningful price movement
3. TPO Profile Generation
For each period, the code:
- Creates price levels from lowest to highest price in the range
- Each level is separated by the calculated row size
- Counts how many bars touch each price level (TPO count)
- Finds the level with highest count = Point of Control (POC)
- Calculates Value Area by expanding from POC until 68.27% of total TPO blocks are included
4. Overlap Detection Algorithm
When a new profile is created, the code checks if it overlaps with existing composites:
- Calculates overlap range = min(currentVAH, prevVAH) - max(currentVAL, prevVAL)
- Calculates current profile range = currentVAH - currentVAL
- Overlap percentage = (overlap range / current profile range) * 100
- If overlap >= 50%, profiles are merged into a composite
5. Composite Merging Logic
When profiles overlap, the code creates a new composite by:
- Taking the earliest start bar and latest end bar
- Using the wider VAH/VAL range (max of both profiles)
- Keeping the POC from the profile with more TPO blocks
- Marking the composite as "active" until price breaks through
6. Real-Time Updates
The code uses barstate.islast to optimize performance:
- Only recalculates on the last bar of each period
- Updates active composite with live price action if enabled
- Cleans up old composites to prevent memory issues
- Redraws all visual elements from scratch each bar
7. Visual Rendering System
The code uses arrays to manage drawing objects:
- Clears all lines/boxes arrays on every bar
- Iterates through composites array to redraw everything
- Uses different colors for active, broken, and dead composites
- Calculates 1.618 Fibonacci extensions for broken composites
Getting Started with CTPO
Step 1: Choose Your Timeframe
Select the period type that matches your trading style:
- Use "Sessions" for day trading
- Use "Daily" for swing trading
- Use "Weekly" for position trading
- Use "Auto" to let the indicator choose based on your chart timeframe
Step 2: Customize the Display
Adjust colors, transparency, and display options to match your charting preferences. The indicator offers extensive customization options to ensure it fits seamlessly into your existing analysis.
Step 3: Identify Key Levels
Look for:
- Composite zones (blue boxes) - major areas of balance
- VAH/VAL lines - value area boundaries
- POC lines - areas of highest trading activity
- 1.618 extension lines - breakout targets
Step 4: Develop Your Strategy
Use these levels to:
- Set entry points near composite zones
- Place stop losses beyond composite levels
- Take profits at 1.618 extension levels
- Identify trend changes when major composites break
Perfect for Market Profile Traders
If you're already using market profile concepts in your trading, CTPO eliminates the manual work of compositing profiles across different timeframes. Instead of spending time analyzing each individual period, you get instant access to the composite levels that matter most.
The indicator's automated compositing process ensures you're always looking at the most relevant areas of balance, while its real-time updates keep you informed of changes as they happen. Whether you're a day trader looking for intraday levels or a position trader analyzing long-term structure, CTPO provides the market profile intelligence you need to succeed.
Streamline Your Market Profile Analysis
Stop wasting time on manual compositing. Let CTPO do the heavy lifting while you focus on executing profitable trades based on areas of balance that actually matter.
Ready to Streamline Your Market Profile Trading?
Add the Composite Time Profile Overlay to your charts today and experience the difference that automated profile compositing can make in your trading performance.

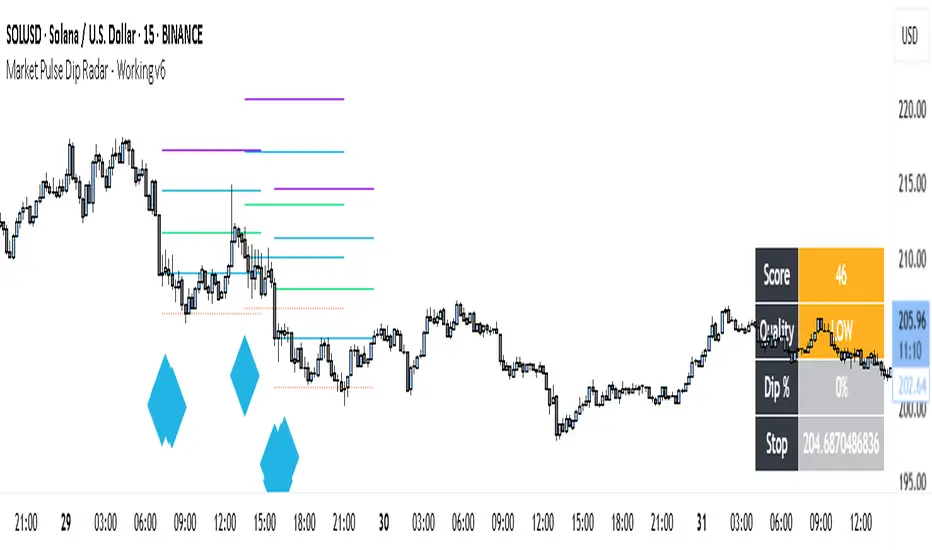
Market Pulse Dip RadarThis indicator is designed to help traders spot meaningful dips in price and then evaluate whether those dips are worth trading or not. It doesn’t just mark a dip; it also helps with risk management, trade planning, and filtering out weak signals.
Here’s how it works:
First, it looks at the recent high price and checks how much the market has dropped from that high. If the drop is larger than the minimum percentage you set, it marks it as a potential dip.
Next, it checks the trend structure by using two moving averages (a fast one and a slow one). If the fast average is below the slow average, it means the market is in a weaker structure, and that dip is considered more valid.
On top of that, you can enable a multi-timeframe filter. For example, if you are trading on the 15-minute chart, you can ask the indicator to confirm that the 1-hour trend is also supportive before showing you a dip. This helps avoid trading against the bigger trend.
Risk management is built in. The indicator automatically suggests a stop-loss by combining volatility (ATR) and recent swing lows. It then draws three profit target levels (1x risk, 2x risk, and 3x risk). This makes it easier to plan where to exit if the trade works.
A key part of this tool is the confidence score. Each dip signal is rated from 0 to 100. The score depends on how deep the dip is, how far apart the moving averages are, how healthy volatility is, and whether the higher timeframe supports the trade. The score is then labeled as High, Medium, Low, or Wait. This helps traders focus only on the stronger setups.
On the chart, dip signals are marked with a diamond shape under the bars. The color of the diamond tells you if it’s high, medium, or low quality. When a signal appears, the indicator also plots horizontal lines for the entry, stop, and targets.
To make it easier to read, there is also a dashboard box that shows the current score, quality, dip percentage, and suggested stop-loss. This means you don’t have to calculate or check different things yourself – everything is visible in one place.
Finally, it comes with alerts. You can set alerts for when a dip signal happens, or when it’s medium or high confidence. This way, you don’t need to stare at charts all day; TradingView can notify you.
So in short, this tool:
• Finds dips based on your rules.
• Filters them using structure, volatility, and higher timeframe trend.
• Suggests stop-loss and profit targets.
• Rates each dip with a confidence score.
• Shows all this info in a clean dashboard and alerts you when it happens.
👉 Do you want me to now explain how a trader would actually use it in practice (step by step, from signal to trade)?
Session Based Liquidity# Session Based Liquidity Indicator - Educational Open Source
## 📊 Overview
The Session Based Liquidity indicator is a comprehensive educational tool designed to help traders understand and visualize liquidity concepts across major trading sessions. This indicator identifies Buy-Side Liquidity (BSL) and Sell-Side Liquidity (SSL) levels created during Asia, London, and New York trading sessions, providing insights into institutional order flow and potential market reversal zones.
## 🎯 Key Features
### 📈 Multi-Session Tracking
- **Asia Session**: Tokyo/Sydney overlap (20:00-02:00 EST)
- **London Session**: European markets (03:00-07:30 EST)
- **New York Session**: US markets (09:30-16:00 EST)
- Individual session toggle controls for focused analysis
### 💧 Liquidity Level Detection
- **Buy-Side Liquidity (BSL)**: Identifies stop losses above swing highs where short positions get stopped out
- **Sell-Side Liquidity (SSL)**: Identifies stop losses below swing lows where long positions get stopped out
- Advanced filtering algorithm to identify only significant liquidity zones
- Configurable pivot strength for sensitivity adjustment
### 🎨 Visual Management System
- **Unclaimed Levels**: Active liquidity zones that haven't been hit (default: black lines)
- **Claimed Levels**: Swept liquidity zones showing historical interaction (default: red lines)
- Customizable line styles, colors, and widths for both states
- Dynamic label system showing session origin and level significance
- Real-time line extension and label positioning
### ⚙️ Advanced Configuration
- **Pivot Strength**: Adjust sensitivity (1-20) for liquidity detection
- **Max Levels Per Side**: Control number of tracked levels (1-10) per session
- **Label Offset**: Customize label positioning
- **Style Customization**: Full control over visual appearance
## 📚 Educational Value
### Core Concepts Explained
- **Liquidity Pools**: Areas where stop losses and pending orders cluster
- **Liquidity Sweeps**: When price moves through levels to trigger stops, then reverses
- **Session-Based Analysis**: How different market sessions create distinct liquidity characteristics
- **Institutional Order Flow**: Understanding how large players interact with retail liquidity
### Trading Applications
- Identify high-probability reversal zones after liquidity sweeps
- Understand where stop losses are likely clustered
- Avoid trading into obvious liquidity traps
- Use session context for timing entries and exits
- Recognize institutional accumulation and distribution patterns
### Code Learning Opportunities
- **Pine Script v6 Best Practices**: Modern syntax and efficient coding patterns
- **Object-Oriented Design**: Custom types and methods for clean code organization
- **Array Management**: Dynamic data structure handling for performance
- **Visual Programming**: Line, label, and styling management
- **Session Detection**: Time-based filtering and timezone handling
## 🔧 Technical Implementation
### Performance Optimized
- Efficient memory management with automatic cleanup
- Limited historical level tracking to maintain responsiveness
- Optimized array operations for smooth real-time updates
- Smart filtering to reduce noise and focus on significant levels
### Code Architecture
- **Modular Design**: Clean separation of concerns with dedicated methods
- **Type Safety**: Custom SessionLiquidity type for organized data management
- **Extensible Structure**: Easy to modify and enhance for specific needs
- **Educational Comments**: Comprehensive documentation throughout
## 💡 Usage Guide
### Basic Setup
1. Add indicator to chart
2. Configure session times for your timezone
3. Adjust pivot strength based on timeframe (higher for lower timeframes)
4. Enable/disable sessions based on your trading focus
### Interpretation
- **Unclaimed levels**: Watch for price interaction and potential reversals
- **Claimed levels**: Use as potential support/resistance after sweep
- **External levels**: Beyond session range, higher significance
- **Internal levels**: Within session range, may indicate ranging conditions
### Best Practices
- Use higher timeframes (15m+) for cleaner signals
- Combine with price action analysis for confirmation
- Consider session overlap periods for increased significance
- Monitor multiple sessions for comprehensive market view
## 🎓 Educational Goals
This open-source project aims to:
- Demystify liquidity concepts for retail traders
- Provide practical coding examples in Pine Script v6
- Encourage understanding of institutional trading behavior
- Foster community learning and collaboration
- Bridge the gap between theory and practical application
## 📄 License & Usage
Released under Mozilla Public License 2.0 - free for educational and commercial use with proper attribution.
## 🤝 Contributing
As an open-source educational tool, contributions are welcome! Whether it's bug fixes, feature enhancements, or educational improvements, your input helps the trading community learn and grow.
## ⚠️ Disclaimer
This indicator is for educational purposes only. All trading involves risk, and past performance does not guarantee future results. Always practice proper risk management and never risk more than you can afford to lose.
---
*By studying and using this indicator, traders can develop a deeper understanding of market microstructure and improve their ability to read institutional order flow patterns.*

Imbalance No SL📊 Strategy Name: Imbalance No SL
This strategy specially trades on price jumps (true imbalances) in the market, takes advantage of momentum only, and as soon as the opposite signal and profit is received, the trade is closed immediately.
Imbalance No SL strategy specially generates buy and sell signals based on "Imbalance" logic, without any fixed Stop Loss.
🔍 Core Logic
Imbalance Detection
Bullish Imbalance : When the low of the current candle is above the high of the previous candle.
(i.e. a jump type gap occurred in the market – demand is high, price went straight up)
Bearish Imbalance : When the high of the current candle is below the low of the previous candle.
(i.e. the market suddenly fell down)
Creating Visual Box and Label on Signal:
As soon as bullish imbalance is found, green box & IMB BULL label is displayed on the chart.
Bearish has red box & IMB BEAR label.
Trade Entry Logic
BUY on Bullish Imbalance: If there is already a buy or neutral position, then a new “BUY” signal will fire.
SELL on Bearish Imbalance: If already in sell or neutral position, then new “SELL” signal will fire.
You can set quantity/lot size from ‘qty’ input field.
Trade Average Calculation
Buy/Sell maintains average price and their count (so that if averaging is done then correct P&L is calculated).
Trade Exit Logic (Profit Booking/Signal Reverse)
If your buy is going on and bearish imbalance is formed + price is above your average, then buy will be closed (profit condition).
If sell is going on and bullish imbalance is formed + price is below average, then sell will be closed.
Chart Cleaning/Management
Only keep the label and box of the latest signal on the chart, old boxes/labels are automatically deleted.
Alert
You can get alert on bullish or bearish signal (by using alert feature of TradingView).
✅ Simple Explanation for User
This strategy buys or sells directly at the gap (imbalance).
Whenever there is a clear signal of momentum in the market (breakout of the gap), then the trade entry takes place.
When there is an imbalance in the opposite direction and profit is made, the system closes the trade (closes).
There is no fixed stop-loss, risk management is handled by trade averaging/close.
You will know at every point on the visually chart that at which bar the buy, sell and exit took place.
⚠️ What to remember?
If the market is in trend then this script gives very good signals.
In choppy/sideways market, some loss trades can also come because there is no SL.
Big profit or big loss – both depend on the imbalance signal and market speed.

Calculateur Position Size Multi-ActifsThe Multi-Asset Position Size Calculator v6 is a fully customizable Pine Script indicator designed to help you determine the optimal position size based on your risk tolerance across any market: Forex, stocks, crypto, futures indices, or commodities. Features include:
Asset Type Selector: Choose between Forex, Stocks, Crypto, Futures Indices, or Commodities
Account Capital & Risk: Set your total account size and risk percentage per trade
Entry Price & Stop-Loss: Configure your entry and stop-loss levels directly
Automatic or Custom Pip/Point Value: Automatically calculates pip/point value by asset class or enter your own
Contract Size Adjustment: Define contract sizes (e.g., 100,000 units for Forex, 1 for stocks/crypto)
Margin & Leverage Display: View your used leverage and position value in real time
Risk Alerts: Warnings for invalid inputs, high leverage (>10×), and asset-specific risk settings (e.g., crypto leverage)
Integrated Table Interface: On-chart table with adjustable position and text size
Optional Price Level Drawing: Display entry and stop-loss lines on the chart
Trade any market confidently with precise, asset-tailored position sizing and risk management.
EMA 6/21/50 PROIndicator Description: EMAs 6/21/50 + MACD + AO + Panel + Alerts
This technical indicator combines several analysis tools to help identify opportunities to enter consolidated trends. It integrates Exponential Moving Averages (EMAs), the MACD, the Amazing Oscillator (AO), and an interactive information panel that allows you to visualize entry signals, trend direction, and potential exit levels (Take Profit and Stop Loss). It is designed for day or swing traders who want a quick and structured reading of the market.
What does the script do? The indicator does the following: It draws 6, 21, and 50-period EMAs on the chart to detect the direction of the trend. It generates LONG/SHORT entry signals based on EMA crossover, alignment with the overall trend (EMA50), and confirmation by indicators: MACD:
Momentum filter. AO: Impulse depletion filter. It visually displays the TP (Take Profit) and SL (Stop Loss) levels when there is a signal. It includes an informative graphical panel with icons and text summarizing the market status and entry conditions.
It issues customizable alerts for entry signals, allowing it to be used in automated strategies or as a manual guide. Allows you to enable/disable visual elements with buttons to customize the experience.
How does it do it?
EMAs and crossover signals: It uses three EMAs: 6 (fast), 21 (medium), and 50 (slow).
A LONG signal occurs when the 6-EMA crosses above the 21-EMA, the price is above the 50-EMA, the MACD confirms bullish momentum, and the AO shows no exhaustion.
A SHORT signal is given in reverse conditions, with the option to limit the system to long signals only (Long signals only).
Additional filters:
MACD: Entry is avoided if there is no favorable crossover between the MACD line and its signal.
AO: Entry is avoided if the OA shows signs of weakness or exhaustion. TP/SL Visual:
TP and SL levels are calculated based on user-defined pips, and are automatically drawn on the chart when there is a valid signal.
Information panel: Each bar is automatically updated. Samples: general trend, EMA crossover, MACD/AO filters, and presence of LONG/SHORT signal. It is possible to hide it with a button from the settings panel.
Alerts: Alerts are generated when the full LONG or SHORT entry conditions are met. They are useful for receiving automatic notifications or integrating them into automated systems.
How to use it?
Add to chart and configure options: Year of start of the analysis.
Activate only long signals if you wish.
Show/hide panel, EMAs, or TP/SL levels. Interpreting signals:
Green triangle under a candle = Possible LONG entry.
Red triangle above a candle = Possible SHORT entry.
Green Line = Suggested Take Profit. Red Line = Suggested Stop Loss. Trigger alerts from TradingView's alert settings to be notified in real-time.
Important Note
This script does not execute orders or represent an automated trading strategy.
It is a visual analysis tool that can support decision-making, but it is recommended to use it in conjunction with other elements of analysis and proper risk management.

Volume Pressure Analysis - Live DataVolume Pressure Gauge and Volume Percentage Indicator – Pine Script Guide
This indicator provides a simplified, real-time visualization of both volume pressure (buy vs. sell activity) and today’s trading volume in comparison to historical averages. It is designed to help traders assess whether buyers or sellers dominate the current session and whether today’s volume is significant relative to recent behaviour.
________________________________________
Key Functional Segments
1. Inputs and Configuration
Users can configure the length of the Simple Moving Average (SMA) used to calculate average volume, set the position of the gauge table on the chart, and toggle the visibility of the volume pressure display. This allows flexibility in integrating the tool with various trading styles and chart layouts.
2. Volume Data Calculations
The indicator calculates three key volume metrics:
• volToday: The current day’s volume.
• volAvg: The average volume over the user-defined SMA period (default is 20 bars).
• volPct: The current volume as a percentage of the average.
This enables traders to quickly recognize whether current trading activity is above or below normal, which can be a precursor to potential trend strength or weakness.
3. Volume Pressure Calculation
The script estimates buying and selling pressure based on price movement and volume. It distributes volume into upward (buy) and downward (sell) segments and expresses them as percentages of the total volume. This gives an immediate sense of whether bulls or bears are more active in the current session.
4. Visual Representation (Progress Bars)
The indicator renders a simplified visual gauge using horizontal bar segments (pseudo-bars) to reflect the proportion of buy and sell pressure. The length of each bar correlates with the strength of pressure from buyers or sellers, helping users assess dominance without analyzing candlestick behavior in depth.
5. Table Display
A compact table is drawn on the chart showing:
• Buy pressure percentage and corresponding bar.
• Sell pressure percentage and corresponding bar.
• Volume percentage compared to the recent average.
This format makes it easy to evaluate volume dynamics at a glance, without cluttering the price chart or relying on separate overlays.
________________________________________
How Traders Benefit from This Indicator
• Momentum Shift Detection: Early signs of trend reversal can be observed when volume pressure flips direction.
• Breakout Validation: High volume combined with dominant pressure supports the credibility of breakout moves.
• False Move Avoidance: If price moves on low volume or mixed pressure, traders can avoid low-probability entries.
• Market Context Awareness: Users can assess whether a day is behaving normally in terms of participation or is unusually quiet or aggressive.
________________________________________
Basic Usage Guide
1. Add the script to your TradingView chart and set your preferred SMA length for volume comparison.
2. Customize the table’s position using the X and Y settings for clarity and alignment.
3. Interpret the outputs:
o A higher red bar indicates dominant sell pressure.
o A higher green bar indicates dominant buy pressure.
o Volume % above 100% suggests above-average activity, while values below 100% may imply low conviction.
4. Apply to trading decisions:
o High buy pressure and high volume may indicate a strong long opportunity.
o High sell pressure and high volume may support short setups.
o Low volume or conflicting signals may call for caution.
5. Combine with other tools such as trend indicators, support/resistance zones, or price action patterns for more reliable trade setups.
________________________________________
Practical Example
• Sell Pressure: 70% → Suggests strong seller control; potential for short setups.
• Buy Pressure: 30% → Weak buying interest; long trades may carry risk.
• Volume Percentage: 120% → Indicates a surge in participation; movement may have greater validity.
________________________________________
Tips for New Traders
• Use this indicator as a confirmation tool rather than a standalone strategy.
• Begin on higher timeframes (4-hour or daily) to develop familiarity.
• Compare multiple examples to identify reliable patterns over time.
• Always incorporate proper risk management, including stop losses.
________________________________________
Disclaimer from aiTrendview
This indicator is intended solely for educational and informational use. It does not constitute investment advice, trade signals, or financial recommendations. aiTrendview and its affiliates are not liable for any trading losses incurred through use of this tool. All trading involves risk. Past performance of any indicator does not guarantee future results. Users should conduct independent research and consult with a certified financial advisor before making any trading decisions.

Volume Pressure Gauge + Volume %Volume Pressure Gauge and Volume Percentage Indicator – Pine Script Guide
This indicator provides a simplified, real-time visualization of both volume pressure (buy vs. sell activity) and today’s trading volume in comparison to historical averages. It is designed to help traders assess whether buyers or sellers dominate the current session and whether today’s volume is significant relative to recent behaviour.
________________________________________
Key Functional Segments
1. Inputs and Configuration
Users can configure the length of the Simple Moving Average (SMA) used to calculate average volume, set the position of the gauge table on the chart, and toggle the visibility of the volume pressure display. This allows flexibility in integrating the tool with various trading styles and chart layouts.
2. Volume Data Calculations
The indicator calculates three key volume metrics:
• volToday: The current day’s volume.
• volAvg: The average volume over the user-defined SMA period (default is 20 bars).
• volPct: The current volume as a percentage of the average.
This enables traders to quickly recognize whether current trading activity is above or below normal, which can be a precursor to potential trend strength or weakness.
3. Volume Pressure Calculation
The script estimates buying and selling pressure based on price movement and volume. It distributes volume into upward (buy) and downward (sell) segments and expresses them as percentages of the total volume. This gives an immediate sense of whether bulls or bears are more active in the current session.
4. Visual Representation (Progress Bars)
The indicator renders a simplified visual gauge using horizontal bar segments (pseudo-bars) to reflect the proportion of buy and sell pressure. The length of each bar correlates with the strength of pressure from buyers or sellers, helping users assess dominance without analyzing candlestick behavior in depth.
5. Table Display
A compact table is drawn on the chart showing:
• Buy pressure percentage and corresponding bar.
• Sell pressure percentage and corresponding bar.
• Volume percentage compared to the recent average.
This format makes it easy to evaluate volume dynamics at a glance, without cluttering the price chart or relying on separate overlays.
________________________________________
How Traders Benefit from This Indicator
• Momentum Shift Detection: Early signs of trend reversal can be observed when volume pressure flips direction.
• Breakout Validation: High volume combined with dominant pressure supports the credibility of breakout moves.
• False Move Avoidance: If price moves on low volume or mixed pressure, traders can avoid low-probability entries.
• Market Context Awareness: Users can assess whether a day is behaving normally in terms of participation or is unusually quiet or aggressive.
________________________________________
Basic Usage Guide
1. Add the script to your TradingView chart and set your preferred SMA length for volume comparison.
2. Customize the table’s position using the X and Y settings for clarity and alignment.
3. Interpret the outputs:
o A higher red bar indicates dominant sell pressure.
o A higher green bar indicates dominant buy pressure.
o Volume % above 100% suggests above-average activity, while values below 100% may imply low conviction.
4. Apply to trading decisions:
o High buy pressure and high volume may indicate a strong long opportunity.
o High sell pressure and high volume may support short setups.
o Low volume or conflicting signals may call for caution.
5. Combine with other tools such as trend indicators, support/resistance zones, or price action patterns for more reliable trade setups.
________________________________________
Practical Example
• Sell Pressure: 70% → Suggests strong seller control; potential for short setups.
• Buy Pressure: 30% → Weak buying interest; long trades may carry risk.
• Volume Percentage: 120% → Indicates a surge in participation; movement may have greater validity.
________________________________________
Tips for New Traders
• Use this indicator as a confirmation tool rather than a standalone strategy.
• Begin on higher timeframes (4-hour or daily) to develop familiarity.
• Compare multiple examples to identify reliable patterns over time.
• Always incorporate proper risk management, including stop losses.
________________________________________
Disclaimer from aiTrendview
This indicator is intended solely for educational and informational use. It does not constitute investment advice, trade signals, or financial recommendations. aiTrendview and its affiliates are not liable for any trading losses incurred through use of this tool. All trading involves risk. Past performance of any indicator does not guarantee future results. Users should conduct independent research and consult with a certified financial advisor before making any trading decisions.

NQ Phantom Scalper Pro# 👻 NQ Phantom Scalper Pro
**Advanced VWAP Mean Reversion Strategy with Volume Confirmation**
## 🎯 Strategy Overview
The NQ Phantom Scalper Pro is a sophisticated mean reversion strategy designed specifically for Nasdaq 100 (NQ) futures scalping. This strategy combines Volume Weighted Average Price (VWAP) bands with intelligent volume spike detection to identify high-probability reversal opportunities during optimal market hours.
## 🔧 Key Features
### VWAP Band System
- **Dynamic VWAP Bands**: Automatically adjusting standard deviation bands based on intraday volatility
- **Multiple Band Levels**: Configurable Band #1 (entry trigger) and Band #2 (profit target reference)
- **Flexible Anchoring**: Choose from Session, Week, Month, Quarter, or Year-based VWAP calculations
### Volume Intelligence
- **Volume Spike Detection**: Only triggers entries when volume exceeds SMA by configurable multiplier
- **Relative Volume Display**: Real-time volume strength indicator in info panel
- **Optional Volume Filter**: Can be disabled for testing alternative setups
### Advanced Time Management
- **12-Hour Format**: User-friendly time inputs (9 AM - 4 PM default)
- **Lunch Filter**: Automatically avoids low-liquidity lunch period (12-2 PM)
- **Visual Time Zones**: Color-coded background for active/inactive periods
- **Market Hours Focus**: Optimized for peak NQ trading sessions
### Smart Risk Management
- **ATR-Based Stops**: Volatility-adjusted stop losses using Average True Range
- **Dual Exit Strategy**: VWAP mean reversion + fixed profit targets
- **Adjustable Risk-Reward**: Configurable target ratio to opposite VWAP band
- **Position Sizing**: Percentage-based equity allocation
### Optional Trend Filter
- **EMA Trend Alignment**: Optional trend filter to avoid counter-trend trades
- **Configurable Period**: Adjustable EMA length for trend determination
- **Toggle Functionality**: Enable/disable based on market conditions
## 📊 How It Works
### Entry Logic
**Long Entries**: Triggered when price touches lower VWAP band + volume spike during active hours
**Short Entries**: Triggered when price touches upper VWAP band + volume spike during active hours
### Exit Strategy
1. **VWAP Mean Reversion**: Early exit when price returns to VWAP center line
2. **Profit Target**: Fixed target based on percentage to opposite VWAP band
3. **Stop Loss**: ATR-based protective stop
### Visual Elements
- **VWAP Center Line**: Blue line showing volume-weighted fair value
- **Green Bands**: Entry trigger levels (Band #1)
- **Red Bands**: Extended levels for target reference (Band #2)
- **Orange EMA**: Trend filter line (when enabled)
- **Background Colors**: Yellow (lunch), Gray (after hours), Clear (active trading)
- **Info Panel**: Real-time metrics display
## ⚙️ Recommended Settings
### Timeframes
- **Primary**: 1-5 minute charts for scalping
- **Validation**: Test on 15-minute for swing applications
### Market Conditions
- **Best Performance**: Ranging/choppy markets with good volume
- **Trend Markets**: Enable trend filter to avoid counter-trend trades
- **High Volatility**: Increase ATR multiplier for stops
### Session Optimization
- **Pre-Market**: Generally avoided (low volume)
- **Morning Session**: 9:30 AM - 12:00 PM (high activity)
- **Lunch Period**: 12:00 PM - 2:00 PM (filtered by default)
- **Afternoon Session**: 2:00 PM - 4:00 PM (good volume)
- **After Hours**: Generally avoided (wide spreads)
## ⚠️ Risk Disclaimer
This strategy is for educational purposes only and does not constitute financial advice. Past performance does not guarantee future results. Trading futures involves substantial risk of loss and is not suitable for all investors. Users should:
- Thoroughly backtest on historical data
- Start with small position sizes
- Understand the risks of leveraged trading
- Consider transaction costs and slippage
- Never risk more than you can afford to lose
## 📈 Performance Tips
1. **Volume Threshold**: Adjust volume multiplier based on average NQ volume patterns
2. **Band Sensitivity**: Modify band multipliers for different volatility regimes
3. **Time Filters**: Customize trading hours based on your timezone and preferences
4. **Trend Alignment**: Use trend filter during strong directional markets
5. **Risk Management**: Always maintain consistent position sizing and risk parameters
**Version**: 6.0 Compatible
**Asset**: Optimized for NASDAQ 100 Futures (NQ)
**Style**: Mean Reversion Scalping
**Frequency**: High-Frequency Trading Ready

Opening Range v3 (Dynamic)Opening Range Signals v3 (Dynamic) - Indicator Guide
Created by: MecarderoAurum
Why This Indicator Exists: An Overview
The "Opening Range Signals" indicator is a sophisticated tool designed for day traders who focus their strategy on the price action that unfolds during the Regular Trading Hours (RTH) of the New York session (09:30 - 16:00 ET). The opening period of the market, often called the "initial balance," is a critical time where institutions and traders establish the early high and low for the day. Trading the breakout of this range is a classic and effective strategy, but it's often plagued by false moves and "head fakes."
This indicator was built to solve that problem. It not only identifies the initial range but also incorporates a powerful dynamic expansion feature. This allows the indicator to intelligently adapt to early session volatility, filter out false breakouts, and establish more reliable support and resistance levels for the rest of the trading day. It provides a clear, visual framework for executing opening range strategies with more confidence.
Key Features & How to Use Them
1. Customizable Opening Range
This is the foundation of the indicator. It draws the high and low of the initial trading period on your chart.
What it does: Establishes the initial support and resistance levels for the day.
How to use it: In the settings under "Time Settings," you can set the "Opening Range Duration" from 1 to 30 minutes. A shorter duration (e.g., 5 minutes) will be more sensitive and give earlier signals, while a longer duration (e.g., 30 minutes) will establish a wider, more robust range.
2. Dynamic Range Expansion
This is the indicator's most powerful and unique feature. It helps you avoid getting trapped in false breakouts.
What it does: If the price breaks out of the initial range but then quickly closes back inside, the indicator will automatically expand the range to include the full wick of the failed breakout. This tells you the market is still establishing its true range.
How to use it: In the settings under "Dynamic Range," you can:
"Enable Dynamic Range Expansion": This is on by default.
"Expansion Time Limit (Min)": Set how long the indicator should look for these failed breakouts. After this time, the range will be locked for the day.
3. Clear Visual Trading Signals
The indicator provides three distinct signals to help you interpret the price action around the opening range.
Breakout Body (Yellow plotshape):
What it means: The first confirmation that the price has decisively moved outside the established range. It appears when a candle's body closes entirely above the high or below the low.
How to use it: This is your alert that a potential breakout is underway. Do not enter yet; wait for confirmation.
Continuation (Green plotshape):
What it means: This signal appears on the candle immediately following a breakout if it shows momentum in the same direction. It confirms that the breakout has strength.
How to use it: This is a potential entry trigger. A continuation signal suggests the breakout is valid and may continue.
Failure (Red plotshape):
What it means: This signal appears if, after a breakout and continuation, the price quickly reverses and closes back inside the range. It's a strong indication of a false breakout.
How to use it: If you are in a breakout trade, a failure signal is a clear sign to exit. It can also be used as a setup for a reversal trade in the opposite direction.
Sample Strategy: The Breakout-Continuation Trade
This strategy uses the indicator's signals to trade a classic opening range breakout with added confirmation.
Setup:
Set the "Opening Range Duration" to your preferred time (e.g., 5 or 15 minutes).
Ensure the "Dynamic Range Expansion" is enabled to filter out early noise.
Entry Trigger:
Wait for a Breakout signal (yellow) to appear. This puts you on high alert.
Wait for a Continuation signal (green) on the very next candle. This is your entry trigger. Enter a long trade on a bullish continuation or a short trade on a bearish continuation.
Stop-Loss:
For a bullish (long) trade, a common stop-loss placement is just below the low of the continuation candle or, for a more conservative stop, just inside the opening range high.
For a bearish (short) trade, place your stop-loss just above the high of the continuation candle or just inside the opening range low.
Trade Management:
If a Failure signal (red) appears after you've entered, it indicates the breakout has failed. This is a strong signal to exit your trade immediately to protect your capital.
If the trade moves in your favor, you can manage it by taking profits at key levels or using a trailing stop.

Gold 3min Trading Pro [XAU/USD]# Gold 3min Trading Pro - User Guide
## Overview
This is a professional scalping indicator specifically designed for Gold (XAU/USD) trading on 3-minute timeframes. It combines multiple technical analysis methods to provide high-probability entry signals for short-term trading.
## Key Features
### 1. Multi-Timeframe Trend Analysis
- **Major Trend**: Analyzes 15min, 1H, and 4H timeframes using moving averages
- **Short-term Trend**: Focuses on 3-minute price action and moving average alignment
- **Trend Strength**: Rated from 1-3 based on timeframe agreement
### 2. Core Indicators
- **RSI (9-period)**: Momentum oscillator for overbought/oversold conditions
- **Stochastic (9-period)**: %K and %D lines for entry timing
- **MACD**: Additional trend confirmation
- **Volume Analysis**: Detects volume spikes for signal validation
- **ATR-based Volatility Filter**: Ensures adequate market movement
### 3. Signal Types
- **Primary Signals**: Green triangles (LONG) and Red triangles (SHORT)
- **Enhanced Signals**: Stronger signals with multiple confirmations
- **Confirmation Signals**: Small circles for stochastic crossovers
## How to Use
### 1. Setup
- **Timeframe**: Use on 3-minute charts for Gold (XAU/USD)
- **Settings**: Default settings are optimized for Gold scalping
- **Session Filter**: Enable for London/New York sessions (recommended)
### 2. Entry Conditions
#### LONG Entry:
- Major trend is bullish (green background)
- Short-term trend is up or neutral
- RSI shows bullish momentum
- Stochastic indicates oversold recovery
- Volume spike confirmation
- Strong price action (bullish candle)
#### SHORT Entry:
- Major trend is bearish (red background)
- Short-term trend is down or neutral
- RSI shows bearish momentum
- Stochastic indicates overbought reversal
- Volume spike confirmation
- Strong price action (bearish candle)
### 3. Trade Management
- **Quick Target**: 50% of ATR-based calculation
- **Main Target**: Full ATR-based target
- **Stop Loss**: 60% of ATR below/above entry
- **Time Limit**: Exit if no progress within 20 bars (60 minutes)
### 4. Risk Management
- **Position Size**: Risk 1-2% of account per trade
- **Maximum Trades**: 3-5 trades per session
- **Avoid**: Low volatility periods and major news events
## Visual Elements
### Background Colors
- **Light Green**: Bullish major trend
- **Light Red**: Bearish major trend
- **Yellow**: Volume spike detected
- **Intense Colors**: Very strong trend alignment
### Chart Indicators
- **RSI Line (Blue)**: Main momentum indicator
- **Stochastic %K (Orange)**: Fast stochastic line
- **Stochastic %D (Yellow)**: Slow stochastic line
- **Horizontal Lines**: 70 (overbought), 30 (oversold), 50 (midline)
### Information Table (Top Right)
- Total signal count and performance statistics
- Current market conditions and trend strength
- RSI levels and volatility status
- Trading session information
- Last signal timing
## Alert System
### Standard Alerts
- **Scalp Long Signal**: Basic long entry signal
- **Scalp Short Signal**: Basic short entry signal
- **Premium Signals**: High-quality signals with strong confirmation
- **Trend Reversal**: Major trend change notifications
### Alert Setup
1. Right-click on chart → "Add Alert"
2. Select desired alert condition
3. Configure notification method (popup, email, webhook)
4. Set alert frequency to "Once Per Bar Close"
## Best Practices
### 1. Trading Sessions
- **Optimal**: London-NY overlap (3:00-5:00 PM EST)
- **Good**: London session (2:00-11:00 AM EST)
- **Avoid**: Asian session and major news releases
### 2. Market Conditions
- **Best**: Trending markets with normal to high volatility
- **Moderate**: Ranging markets during active sessions
- **Avoid**: Extremely low volatility or choppy conditions
### 3. Confirmation Rules
- Wait for signal triangle to appear
- Check that major trend aligns with signal direction
- Verify volume spike (yellow background)
- Ensure volatility is adequate (check info table)
### 4. Entry Timing
- Enter immediately after signal confirmation
- Use market orders for scalping speed
- Set stop loss and take profit levels immediately
## Settings Customization
### Essential Settings
- **MA Type**: EMA (recommended) or SMA
- **RSI Length**: 9 (default, can adjust 5-14)
- **Volume Threshold**: 1.8 (higher = fewer but stronger signals)
- **Volatility Filter**: Keep enabled for better signal quality
### Display Options
- **Show Scalping Signals**: Main entry signals
- **Show Performance Stats**: Information table
- **Show Trend Filter**: Background trend colors
- **Use Time Filter**: Session-based filtering
## Performance Optimization
### 1. Backtesting Tips
- Test on different market conditions
- Analyze win rate and average profit/loss
- Adjust settings based on historical performance
### 2. Signal Quality
- Higher trend strength (2-3) = better signals
- Volume confirmation improves success rate
- Enhanced signals have higher probability
### 3. Risk Control
- Never risk more than 2% per trade
- Use proper position sizing
- Stop trading after 3 consecutive losses
## Troubleshooting
### Common Issues
1. **No Signals**: Check volatility filter and session timing
2. **Too Many Signals**: Increase volume threshold or enable filters
3. **Poor Performance**: Verify timeframe (must be 3-minute) and symbol (XAU/USD)
### Support
- Ensure TradingView Pro+ subscription for multi-timeframe data
- Verify Gold symbol matches your broker's format
- Update to latest TradingView version
This indicator is designed for experienced traders familiar with scalping techniques and risk management. Always practice on demo accounts before live trading.

DP_ORB Entry & Exit IndicatorDisclaimer:
This indicator is for educational purposes only. It does not constitute financial advice. Always do your own research and manage your risk. Also, I cannot take full credit for 'ORB' as its a well known strategy amongst many traders, but I do need to give a special shout out to @TheBigDaddyMax for putting me on to this.
DP_ORB Entry & Exit Indicator
Description:
The DP_ORB Entry & Exit Indicator is a powerful tool designed for traders who utilize the Opening Range Breakout (ORB) strategy on the NYSE session. This indicator visually identifies the initial volatility window of the trading day, by marking the 15m High, and 15m Low into a ORB Box, & then tracks breakout opportunities, and provides clear, dynamic trade management levels—all directly on your chart.
Key Features:
Automatic Opening Range (ORB) Box:
Identifies and plots the high and low of the user-defined opening range (default 9:30–9:45 NYSE) for visual reference and strategy foundation.
Breakout Entry Signals:
Automatically detects and marks long or short breakout entries when price closes above or below the ORB range, with additional momentum confirmation.
Dynamic Stop Loss:
Stop loss is intelligently set to the previous bar’s low for long trades (or high for shorts), adapting to market structure at entry.
Take Profit Targets:
Up to three fully adjustable take-profit levels are plotted, calculated as percentages from entry, supporting progressive trade management.
Visual Trade Management:
Entry, stop loss, and take profit levels are displayed as extending dashed lines from entry point to the current bar, with labels always shown just to the right of price for clarity on all timeframes.
Automatic Reset and Cleanup:
Visuals and logic reset daily and upon exit, ensuring a clean, uncluttered chart experience.
How to Use:
Set your preferred opening range time and take profit levels in the settings.
Wait for a breakout and confirmation during the NYSE session.
Use the on-chart lines and labels to manage your trade according to your risk and strategy plan.
Best For:
Day traders and scalpers seeking a disciplined, visual, and fully-automated approach to opening range breakout trading.

HMA Crossover + ATR + Curvature (Long & Short)📏 Hull Moving Averages (Trend Filters)
- fastHMA = ta.hma(close, fastLength)
- slowHMA = ta.hma(close, slowLength)
These two HMAs act as dynamic trend indicators:
- A bullish crossover of fast over slow HMA signals a potential long setup.
- A bearish crossunder triggers short interest.
⚡️ Curvature (Acceleration Filter)
- curv = ta.change(ta.change(fastHMA))
This calculates the second-order change (akin to the second derivative) of the fast HMA — effectively the acceleration of the trend. It serves as a filter:
- For long entries: curv > curvThresh (positive acceleration)
- For short entries: curv < -curvThresh (negative acceleration)
It helps eliminate weak or stagnating moves by requiring momentum behind the crossover.
📈 Volatility-Based Risk Management (ATR)
- atr = ta.atr(atrLength)
- stopLoss = atr * atrMult
- trailStop = atr * trailMult
These define your:
- Initial stop loss: scaled to recent volatility using ATR and atrMult.
- Trailing stop: also ATR-scaled, to lock in gains dynamically as price moves favorably.
💰 Position Sizing via Risk Percent
- capital = strategy.equity
- riskCapital = capital * (riskPercent / 100)
- qty = riskCapital / stopLoss
This dynamically calculates the position size (qty) such that if the stop loss is hit, the loss does not exceed the predefined percentage of account equity. It’s a volatility-adjusted position sizing method, keeping your risk consistent regardless of market conditions.
📌 Execution Logic
- Long Entry: on bullish HMA crossover with rising curvature.
- Short Entry: on bearish crossover with falling curvature.
- Exits: use ATR-based trailing stops.
- Position is closed when trend conditions reverse (e.g., bearish crossover exits the long).
This framework gives you:
- Trend-following logic (via HMAs)
- Momentum confirmation (via curvature)
- Volatility-aware execution and exits (via ATR)
- Risk-controlled dynamic sizing
Want to get surgical and test what happens if we use curvature on the difference between HMAs instead? That might give some cool insights into trend strength transitions.

VWAP Deviation Channels with Probability (Lite)VWAP Deviation Channels with Probability (Lite)
Version 1.2
Overview
This indicator is a powerful tool for intraday traders, designed to identify high-probability areas of support and resistance. It plots the Volume-Weighted Average Price (VWAP) as a central "value" line and then draws statistically-based deviation channels around it.
Its unique feature is a dynamic probability engine that analyzes thousands of historical price bars to calculate and display the real-time likelihood of the price touching each of these deviation levels. This provides a quantifiable edge for making trading decisions.
Core Concepts Explained
This indicator is built on three key concepts:
The VWAP (Volume-Weighted Average Price): The dotted midline of the channels is the session VWAP. Unlike a Simple Moving Average (SMA) which only considers price, the VWAP incorporates volume into its calculation. This makes it a much more significant benchmark, as it represents the true average price where the most business has been transacted during the day. It's heavily used by institutional traders, which is why price often reacts strongly to it.
Standard Deviation Channels: The channels above and below the VWAP are based on standard deviations. Standard deviation is a statistical measure of volatility.
- Wide Bands: When the channels are wide, it signifies high volatility.
- Narrow Bands: When the channels are tight and narrow, it signifies low volatility and
consolidation (a "squeeze").
The Conditional Probability Engine: This is the heart of the indicator. For every deviation level, the script displays a percentage. This percentage answers a very specific question:
"Based on thousands of previous bars, when the last candle had a certain momentum (bullish or bearish), what was the historical probability that the price would touch this specific level?"
The probabilities are calculated separately depending on whether the previous candle was green (bullish) or red (bearish). This provides a nuanced, momentum-based edge. The level with the highest probability is highlighted, acting as a "price magnet."
How to Use This Indicator
Recommended Timeframes:
This indicator is designed specifically for intraday trading. It works best on timeframes like the 1-minute, 5-minute, and 15-minute charts. It will not display correctly on daily or higher timeframes.
Recommended Trading Strategy: Mean Reversion
The primary strategy for this indicator is "Mean Reversion." The core idea is that as the price stretches to extreme levels far away from the VWAP (the "mean"), it is statistically more likely to "snap back" toward it.
Here is a step-by-step guide to trading this setup:
1. Identify the Extreme: Wait for the price to push into one of the outer deviation bands (e.g., the -2, -3, or -4 bands for a buy setup, or the +2, +3, or +4 bands for a sell setup).
2. Look for the High-Probability Zone: Pay close attention to the highlighted probability label. This is the level that has historically acted as the strongest magnet for price. A touch of this level represents a high-probability area for a potential reversal.
3. Wait for Confirmation: Do not enter a trade just because the price has touched a band. Wait for a confirmation candle that shows momentum is shifting.
- For a Buy: Look for a strong bullish candle (e.g., a green engulfing candle or a hammer/pin
bar) to form at the lower bands.
- For a Sell: Look for a strong bearish candle (e.g., a red engulfing candle or a shooting star)
to form at the upper bands.
Define Your Exit:
- Take Profit: A logical primary target for a mean reversion trade is the VWAP (midLine).
- Stop Loss: A logical place for a stop-loss is just outside the next deviation band. For
example, if you enter a long trade at the -3 band, your stop loss could be placed just
below the -4 band.
Disclaimer: This indicator is a tool for analysis and should not be considered a standalone trading system. Trading involves significant risk, and past performance is not indicative of future results. Always use this indicator in conjunction with other forms of analysis and sound risk management practices.

CoffeeShopCrypto Supertrend Liquidity EngineMost SuperTrend indicators use fixed ATR multipliers that ignore context—forcing traders to constantly tweak settings that rarely adapt well across timeframes or assets.
This Supertrend is a nodd to and a more completion of the work
done by Olivier Seban ( @olivierseban )
This version replaces guesswork with an adaptive factor based on prior session volatility, dynamically adjusting stops to match current conditions. It also introduces liquidity-aware zones, real-time strength histograms, and a visual control panel—making your stoploss smarter, more responsive, and aligned with how the market actually moves.
📏 The Multiplier Problem & Adaptive Factor Solution
Traditional SuperTrend indicators rely on fixed ATR multipliers—often arbitrary numbers like 1.5, 2, or 3. The issue? No logical basis ties these values to actual market conditions. What works on a 5-minute Nasdaq chart fails on a daily EUR/USD chart. Traders spend hours tweaking multipliers per asset, timeframe, or volatility phase—and still end up with stoplosses that are either too tight or too loose. Worse, the market doesn’t care about your setting—it behaves according to underlying volatility, not your parameter.
This version fixes that by automating the multiplier selection entirely. It uses a 4-zone model based on the current ATR relative to the previous session’s ATR, dynamically adjusting the SuperTrend factor to match current volatility. It eliminates guesswork, adapts to the asset and timeframe, and ensures you’re always using a context-aware stoploss—one that evolves with the market instead of fighting it.
ATR EXAMPLE
Let’s say prior session ATR = 2.00
Now suppose current ATR = 0.32
This places us in Zone 1 (Very Low Volatility)
It doesn’t imply "overbought" or "oversold" — it tells you the market is moving very little, which often means:
Lower risk | Smaller stops | Smaller opportunities (and losses)
🔁 Liquidity Zones vs. Arbitrary Pullbacks
The standard SuperTrend stop loss line often looks like price “barely misses it” before continuing its trend. Traders call this "stop hunting," but what’s really happening is liquidity collection—price pulls back into a zone rich in orders before continuing. The problem? The old SuperTrend doesn’t show this zone. It only draws the outer limit, leaving no visual cue for where entries or continuation moves might realistically originate.
This script introduces 2 levels in the Liquidity Zone. One for Support and one for Stophunts, which draw dynamically between the current price and the SuperTrend line. These levels reflect where the market is most likely to revisit before resuming the trend. By visualizing the area just above the Supertrend stop loss, you can anticipate pullbacks, spot ideal re-entries, and avoid premature exits. This bridges the gap between mechanical stoploss logic and real-world liquidity behavior.
⏳ Prior Session ATR vs. Live ATR
Using real-time ATR to determine movement potential is like driving by looking in your rearview mirror. It’s reactive, not predictive. Traders often base decisions on live ATR, unaware that today’s range is still unfolding —creating volatility mismatches between what’s calculated and what actually matters. Since ATR reflects range, calculating it mid-session gives an incomplete and misleading picture of true volatility.
Instead, this system uses the ATR from the previous session , anchoring your volatility assumptions in a fully-formed price structure . It tells you how far price moved in the last full market phase—be it London, New York, or Tokyo—giving you a more reliable gauge of expected range today. This is a smarter way to estimate how far price could move rather than how far it has moved.
The Smoothing function will take the ATR, Support, Resistance, Stophunt Levels, and the Moving Avearage and smooth them by the calculation you choose.
It will also plot a moving average on your chart against closing prices by the smoothing function you choose.
🧭 Scalping vs. Trending Modes
The market moves in at least 4 phases. Trending, Ranging, Consolidation, Distribution.
Every trader has a different style —some scalp low-volatility moves during off-hours, while others ride macro trends across days. The problem with classic SuperTrend? It treats every market condition the same. A fixed system can’t possibly provide proper stoploss spacing for both a fast scalp and a long-term swing. Traders are forced to rebuild their system every time the market changes character or the session shifts.
This version solves that with a simple toggle:
Scalping or Trend Mode . With one switch, it inverts the logic of the adaptive factor to either tighten or loosen your trailing stops. During low-liquidity hours or consolidation phases, Scalping Mode offers snug stoplosses. During expansion or clear directional bias.
Trend Mode lets the trade breathe. This is flexibility built directly into the logic—not something you have to recalibrate manually.
📉 Histogram Oscillator for Move Strength
In legacy indicators, there’s no built-in way to gauge when the move is losing power . Traders rely on price action or momentum indicators to guess if a trend is fading. But this adds clutter, lag, and often contradiction. The classic SuperTrend doesn’t offer insight into how strong or weak the current trend leg is—only whether price has crossed a line.
This version includes a Trending Liquidity Histogram —a histogram that shows whether the liquidity in the SuperTrend zone is expanding or compressing. When the bars weaken or cross toward zero, it signals liquidity exhaustion . This early warning gives you time to prep for reversals or anticipate pullbacks. It even adapts visually depending on your trading mode, showing color-coded signals for scalping vs. trending behavior. It's both a strength gauge and a trade timing tool—built into your stoploss logic.
Histogram in Scalping Mode
Histogram in Trending Mode
📊 Visual Table for Real-Time Clarity
A major issue with custom indicators is opacity —you don’t always know what settings or values are currently being used. Even worse, if your dynamic logic changes mid-trade, you may not notice unless you go digging into the code or logs. This can create confusion, especially for discretionary traders.
This SuperTrend solves it with a clean visual summary table right on your chart. It shows your current ATR value, adaptive multiplier, trailing stop level, and whether a new zone size is active. That means no surprises and no second-guessing—everything important is visible and updated in real-time.

Zero Lag MACD + Kijun-sen + EOM StrategyThis strategy offers a robust approach to identifying high-probability trading opportunities in the fast-paced cryptocurrency markets, particularly on lower timeframes (e.g., 5-minute). It leverages the synergistic power of three distinct indicators to confirm entries, ensuring a disciplined approach to risk management.
Key Components:
Zero Lag MACD Enhanced Version 1.2: This core momentum indicator is used to identify precise shifts in trend and momentum, offering reduced lag compared to traditional MACD. Entry signals are filtered based on the histogram's position (below for buys, above for sells) to enhance signal reliability.
Kijun-sen (Ichimoku Cloud): Acting as a dynamic support/resistance and trend filter, the Kijun-sen line confirms the prevailing market direction. Long entries are confirmed when price is above Kijun-sen, and short entries when price is below.
Ease of Movement (EoM): This volume-based oscillator provides crucial confirmation of price movements by measuring the ease with which price changes. Positive EoM confirms buying pressure, while negative confirms selling pressure, adding an essential layer of validation to trade setups.
How it Works:
The strategy generates entry signals only when all three indicators align simultaneously:
For Long Entries: A Zero Lag MACD buy signal (crossover below histogram) must coincide with price trading above the Kijun-sen, and the Ease of Movement indicator being above its zero line.
For Short Entries: A Zero Lag MACD sell signal (crossover above histogram) must coincide with price trading below the Kijun-sen, and the Ease of Movement indicator being below its zero line.
Entries are executed at the open of the candle immediately following the signal confirmation.
Risk Management:
Disciplined risk management is paramount to this strategy:
Dynamic Stop-Loss: An Average True Range (ATR) based stop-loss is implemented, set at 2.5 times the current ATR. This adapts the stop-loss distance to market volatility, ensuring sensible risk sizing.
Fixed Take-Profit: A consistent Risk-to-Reward (R:R) ratio of 1:1.2 is applied for all trades, promoting stable profit realization.
Customization & Optimization:
The strategy is built with fully customizable input parameters for each indicator (MACD lengths, Kijun-sen period, ATR period, ATR multiplier, and Risk-to-Reward ratio). This allows users to fine-tune the strategy for different assets, timeframes, and market conditions, facilitating robust backtesting and optimization.
Disclaimer: Trading involves substantial risk and is not suitable for all investors. Past performance is not indicative of future results. This strategy is provided for educational and informational purposes only. Always use proper risk management and conduct your own due diligence.

Money Risk Management with Trade Tracking
Overview
The Money Risk Management with Trade Tracking indicator is a powerful tool designed for traders on TradingView to simplify trade simulation and risk management. Unlike the TradingView Strategy Tester, which can be complex for beginners, this indicator provides an intuitive, beginner-friendly interface to evaluate trading strategies in a realistic manner, mirroring real-world trading conditions.
Built on the foundation of open-source contributions from LuxAlgo and TCP, this indicator integrates external indicator signals, overlays take-profit (TP) and stop-loss (SL) levels, and provides detailed money management analytics. It empowers traders to visualize potential profits, losses, and risk-reward ratios, making it easier to understand the financial outcomes of their strategies.
Key Features
Signal Integration: Seamlessly integrates with external long and short signals from other indicators, allowing traders to overlay TP/SL levels based on their preferred strategies.
Realistic Trade Simulation: Simulates trades as they would occur in real-world scenarios, accounting for initial capital, risk percentage, leverage, and compounding effects.
Money Management Dashboard: Displays critical metrics such as current capital, unrealized P&L, risk amount, potential profit, risk-reward ratio, and trade status in a customizable, beginner-friendly table.
TP/SL Visualization: Plots TP and SL levels on the chart with customizable styles (solid, dashed, dotted) and colors, along with optional labels for clarity.
Performance Tracking: Tracks total trades, win/loss counts, win rate, and profit factor, providing a clear overview of strategy performance.
Liquidation Risk Alerts: Warns traders if stop-loss levels risk liquidation based on leverage settings, enhancing risk awareness.
Benefits for Traders
Beginner-Friendly: Simplifies the complexities of the TradingView Strategy Tester, offering an intuitive interface for new traders to simulate and evaluate trades without confusion.
Real-World Insights: Helps traders understand the actual profit or loss potential of their strategies by factoring in capital, risk, and leverage, bridging the gap between theoretical backtesting and real-world execution.
Enhanced Decision-Making: Provides clear, real-time analytics on risk-reward ratios, unrealized P&L, and trade performance, enabling informed trading decisions.
Customizable and Flexible: Allows customization of TP/SL settings, table positions, colors, and sizes, catering to individual trader preferences.
Risk Management Focus: Encourages disciplined trading by highlighting risk amounts, potential profits, and liquidation risks, fostering better financial planning.
Why This Indicator Stands Out
Many traders struggle to translate backtested strategy results into real-world outcomes due to the abstract nature of percentage-based profitability metrics. This indicator addresses that challenge by providing a practical, user-friendly tool that simulates trades with real-world parameters like capital, leverage, and compounding. Its open-source nature ensures accessibility, while its integration with other indicators makes it versatile for various trading styles.
How to Use
Add to TradingView: Copy the Pine Script code into TradingView’s Pine Editor and add it to your chart.
Configure Inputs: Set your initial capital, risk percentage, leverage, and TP/SL values in the indicator settings. Select external long/short signal sources if integrating with other indicators.
Monitor Dashboards: Use the Money Management and Target Dashboard tables to track trade performance and risk metrics in real time.
Analyze Results: Review win rates, profit factors, and P&L to refine your trading strategy.
Credits
This indicator builds upon the open-source contributions of LuxAlgo and TCP , whose efforts in sharing their code have made this tool possible. Their dedication to the trading community is deeply appreciated.
