Candlesticks ANN for Stock Markets TF : 1WHello, this script consists of training candlesticks with Artificial Neural Networks (ANN).
In addition to the first series, candlesticks' bodies and wicks were also introduced as training inputs.
The inputs are individually trained to find the relationship between the subsequent historical value of all candlestick values 1.(High,Low,Close,Open)
The outputs are adapted to the current values with a simple forecast code.
Once the OHLC value is found, the exponential moving averages of 5 and 20 periods are used.
Reminder : OHLC = (Open + High + Close + Low ) / 4
First version :
Script is designed for S&P 500 Indices,Funds,ETFs, especially S&P 500 Stocks,and for all liquid Stocks all around the World.
NOTE: This script is only suitable for 1W time-frame for Stocks.
The average training error rates are less than 5 per thousand for each candlestick variable. (Average Error < 0.005 )
I've just finished it and haven't tested it in detail.
So let's use it carefully as a supporter.
Best regards !
Buscar en scripts para "spx"

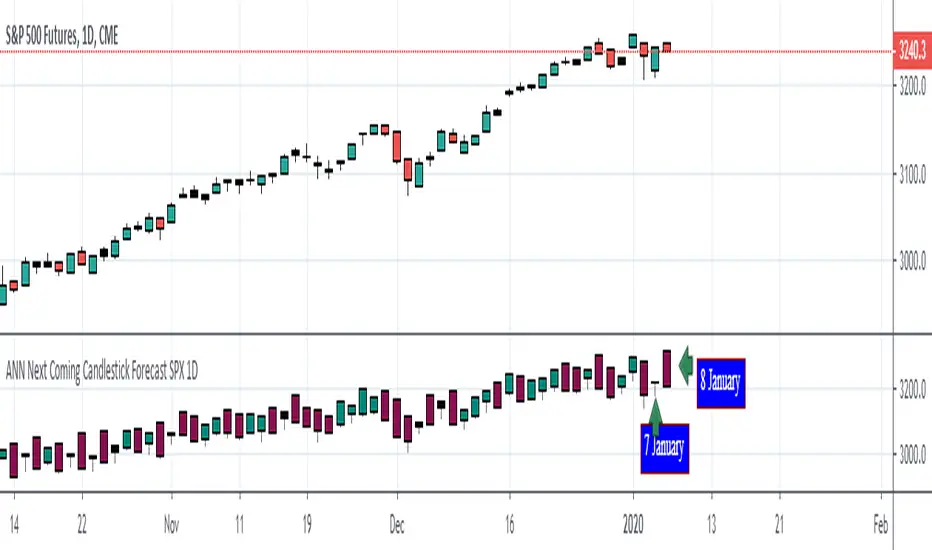
ANN Next Coming Candlestick Forecast SPX 1D v1.0WARNING:
Experimental and incomplete.
Script is open to development and will be developed.
This is just version 1.0
STRUCTURE
This script is trained according to the open, close, high and low values of the bars.
It is tried to predict the future values of opening, closing, high and low values.
A few simple codes were used to correlate expectation with current values. (You can see between line 129 - 159 )
Therefore, they are all individually trained.
You can see in functions.
The average training error of each variable is less than 0.011.
NOTE :
This script is designed for experimental use on S & P 500 and connected instruments only on 1-day bars.
The Plotcandle function is inspired by the following script of alexgrover :
Since we estimate the next values, our error rates should be much lower for all candlestick values. This is just first version to show logic.
I will continue to look for other variables to reach average error = 0.001 - 0.005 for each candlestick status.
Feel free to use and improve , this is open-source.
Best regards.
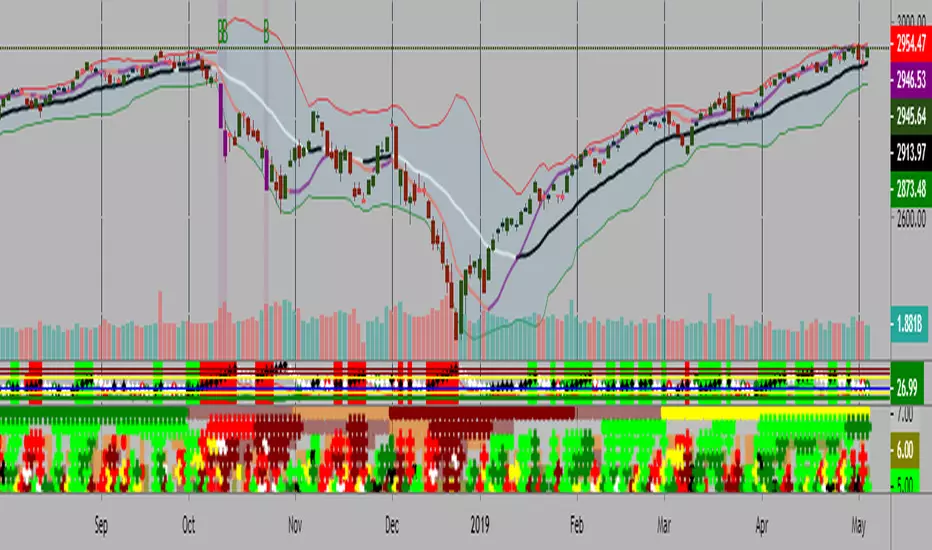
Macroeconomic Artificial Neural Networks
This script was created by training 20 selected macroeconomic data to construct artificial neural networks on the S&P 500 index.
No technical analysis data were used.
The average error rate is 0.01.
In this respect, there is a strong relationship between the index and macroeconomic data.
Although it affects the whole world,I personally recommend using it under the following conditions: S&P 500 and related ETFs in 1W time-frame (TF = 1W SPX500USD, SP1!, SPY, SPX etc. )
Macroeconomic Parameters
Effective Federal Funds Rate (FEDFUNDS)
Initial Claims (ICSA)
Civilian Unemployment Rate (UNRATE)
10 Year Treasury Constant Maturity Rate (DGS10)
Gross Domestic Product , 1 Decimal (GDP)
Trade Weighted US Dollar Index : Major Currencies (DTWEXM)
Consumer Price Index For All Urban Consumers (CPIAUCSL)
M1 Money Stock (M1)
M2 Money Stock (M2)
2 - Year Treasury Constant Maturity Rate (DGS2)
30 Year Treasury Constant Maturity Rate (DGS30)
Industrial Production Index (INDPRO)
5-Year Treasury Constant Maturity Rate (FRED : DGS5)
Light Weight Vehicle Sales: Autos and Light Trucks (ALTSALES)
Civilian Employment Population Ratio (EMRATIO)
Capacity Utilization (TOTAL INDUSTRY) (TCU)
Average (Mean) Duration Of Unemployment (UEMPMEAN)
Manufacturing Employment Index (MAN_EMPL)
Manufacturers' New Orders (NEWORDER)
ISM Manufacturing Index (MAN : PMI)
Artificial Neural Network (ANN) Training Details :
Learning cycles: 16231
AutoSave cycles: 100
Grid
Input columns: 19
Output columns: 1
Excluded columns: 0
Training example rows: 998
Validating example rows: 0
Querying example rows: 0
Excluded example rows: 0
Duplicated example rows: 0
Network
Input nodes connected: 19
Hidden layer 1 nodes: 2
Hidden layer 2 nodes: 0
Hidden layer 3 nodes: 0
Output nodes: 1
Controls
Learning rate: 0.1000
Momentum: 0.8000 (Optimized)
Target error: 0.0100
Training error: 0.010000
NOTE : Alerts added . The red histogram represents the bear market and the green histogram represents the bull market.
Bars subject to region changes are shown as background colors. (Teal = Bull , Maroon = Bear Market )
I hope it will be useful in your studies and analysis, regards.

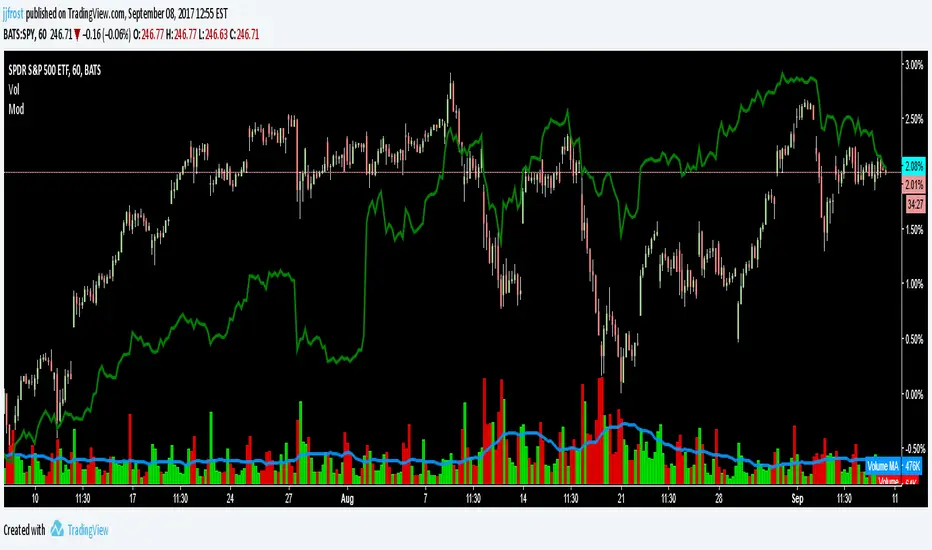
Volume Price ROC Tracker and Shadow CandlesWhen price goes up on negative volume, then market is telling there is doubts in investors mind.
The SPX upside recent month was a on. Lower volume so, the rally in my view will not last. Read my articles on current market.
This very simple scripts shows if price drop or gain was on a upside volume or down side. It is a visual track on the candle reflecting the volume ROC overlapped as a price movement on the actual candle. So don't mistake it with a moving average. Red means volume was down even if price has gone up. Basically if a price goes up on a increase ROC volume then you can trust it. Otherwise it is likely that it won't last.
If you can improve on this idea, it would be great. I think there is not enough volume related scripts that diggs a bit deeper to describe the market behaviour in the future. After all all technical analysis are supposed to tell us about future price not just how it was in the past.

TradersAI_UTBotCREDITS to @HPotter for the orginal code.
CREDITS to @Yo_adriiiiaan for recently publishing the UT Bot study based on the original code -
I just added some simple code to turn it into a strategy. Now, anyone can simply add the strategy to their chart to see the backtesting results!
While @Yo_adriiiiaan mentions it works best on a 4-hour timeframe or above, I am happy to share that this seems to be working on a 15-minute chart on e-mini S&P 500 Index (using the KeyValue setting at 10)! You can play around with the different settings, and may be you might discover even better settings.
Hope this helps. Btw, if any of you play with different settings and discover great settings for a specific instrument, please share them with the community here - it will be rewarded back multiple times!

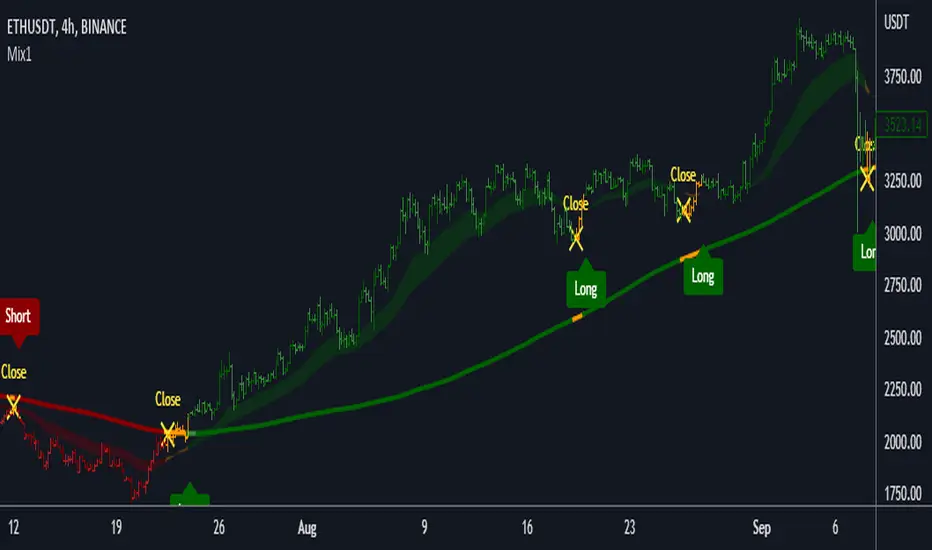
Mix1 : Ema Cross + Trend Channel [Gu5]Based on Trend Channel
Ema-crossover is added
Crossing alerts, only on trend
Basado en mi anterior indicador, Trend Channel
Se agrega Cruce de Medias Moviles (Ema-crossover)
Las alertas solo son en favor a la tendencia
El valor de SMA Range es arbitrario (No Backtesting). Cambia la amplitud de canal que determina cuando es rango (barras amarillas por estar muy cerca del SMA200, sin tendencia definida)
Range Multiplier adapta el indicador a distintos mercados
//Setting recommended for SMA Range
//BTCUSD = 100
//EURUSD = 1000
//SPX = 100
//ETHUSD = 10
Si te fue útil este indicador, puedes comprarme una cerveza ;)
ADL-SPX Rank Difference-Buschi
English:
An expansion of the Advance Decline Line of the NYSE. It can be interesting to compare the Advance Decline Line with the corresponding benchmark index. I therefore made a ranking (0 to 100) based on the performance over the last days (default: 21 days). The difference is the target figure and ranges between -100 (bearish divergence) to +100 (bullish divergence).
Deutsch:
Eine Erweiterung der Advance Decline Line der NYSE. Oft möchte man den Verlauf der Advance Decline Line mit dem zugehörigen Leitindex vergleichen. Daher habe ich für beide ein Ranking (0 bis 100) erstellt auf Basis des Verlaufs über die letzten Tage (Standardwert: 21 Tage). Die Differenz stellt dabei die Zielgröße dar und schwankt zwischen -100 (bärische Divergenz) und +100 (bullische Divergenz).

Trend Channel [Gu5]SMA 200 determines the trend
Bullish trend, green candles. Down trend, red candles.
If the market value is narrow to the SMA200 channel, yellow candles.
Setting recommended for SMA Range
BTCUSD = 100
EURUSD = 1000
SPX = 100
ETHUSD = 10

ck - Crypto Correlation IndicatorA simple Correlation Indicator initially configured for Crypto Trader use (but other markets can use this too).
It plots the correlation between the current chart (say BTCUSD ) versus 4 user-definable indices, currency pairs, stocks etc.
By default, the indicator is preconfigured for:
GOLD (Oz/$),
Dow Jones Index (DJI),
Standard & Poor 500 Index (SPX) ,
Dollar Index ( DXY )
You can set the period (currently 1D resolution) in the "Period" box in the settings, valid inputs are:
minutes (number), days (1D, 2D, 3D etc), weeks (1W, 2W etc), months (1M, 2M etc)
Length is the lagging period/smoothing applied - default is 14
When changing comparison instruments/tickers, you may find it useful to prefix the exchange with the instrument's ticker, for example:
Binance:BTCUSDT, NYSE:GOOG etc
*** Idea originally from the brilliant Backtest Rookies - backtest-rookies.com ***
A.I.Driven TradersAI Model Trades for 20190612The entry and exit levels here are NOT derived from any specific indicator but are coming from our A.I. driven proprietary models.
This is an attempt at exploring the trading community here at TradingView and sharing our daily trading plans published at our site with the community here in the form a Pine Script - just starting and learning this platform. Please help point out any obvious errors or gotchas committed in the scripts. Thanks and have a great trading day!
**** The Trading Plan Published for today ****
>>>> Medium-Frequency Models: <<<<< For today, Wednesday 06/12, our medium-frequency models indicate using the 2895 as a pivot point - opening a long on a break above 2895, and opening a short on a break below 2895 (wait for a close on at least a five minute chart to determine the break), both sides with a 9-point trailing stop.
Note: For the trades to trigger, the breaks should occur during the regular session hours starting at 9:30am ET. By design, these models do NOT open any new positions after 3:45pm. Only one open position at any given time.
>>>>> Aggressive Intraday Models: <<<<< For today, Wednesday 06/12, our aggressive intraday models indicate going long on a break above 2892 or 2875 with an 6-point trailing stop, and going short on a break below 2887 or 2878 with an 8-point trailing stop.
Note: For the trades to trigger, the breaks should occur during regular session hours starting at 9:30am ET. Due to the intraday nature of these aggressive models, they indicate closing any open trades at 3:55pm and remaining flat into the session close. No opening of new positions after 3:45pm. Only one open position at any given time.

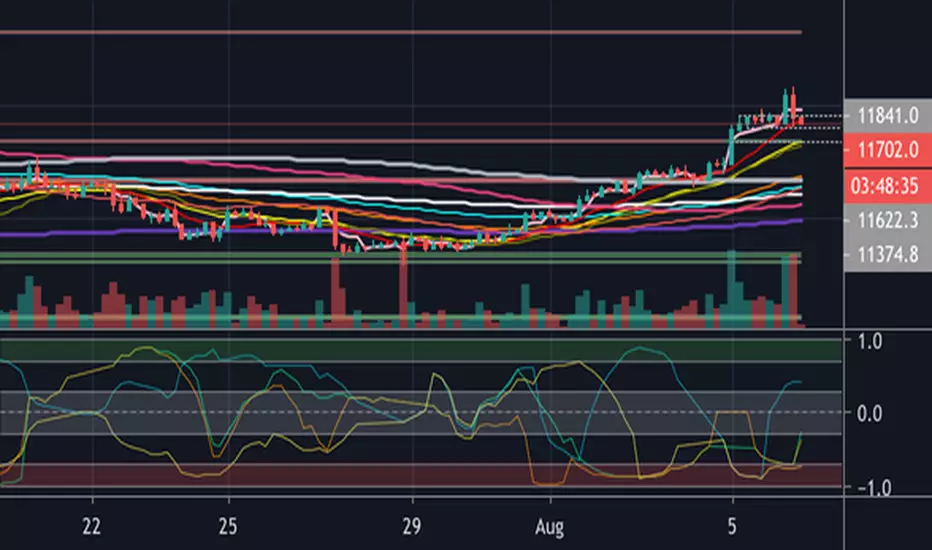
Kal’s MTF ADX Rangoli RollerKaly MTF ADX Rangoli Roller is a method/study for finding trending stocks, indexes and cryptocurrencies using two different data periods (10, 5) of ADX Overlap over different time-frames (10m, 1H, 4H, 1D, 1W, 1M). In the study, I used 5-Period ADX for all mentioned time-frames. You may use 10-Period ADX for lower time-frames especially 10m and 1H.
Sample Image of the pinescript code(at the end of this post) in Tradingview looks as follows:
Note: Kal's MTF ADX Rangoli Roller is the lower Plot. The upper plot is KAL’s ADX Overlap Technical Study with MACD Filter( )
Description:
----------------
In the study plot, the lowest row is 10m, row above is 1H, row above is 4H, then 1D, then 1W and highest row is 1M
Lime(Bright Green) dot implies Trending Uptrend for that time-frame (first phase)
Green dot implies Trending Uptrend for that time-frame (second phase near exhaustion)
Red dot implies Trending Downward for that time-frame (first phase)
Maroon dot implies Trending Downward for that time-frame (second phase near exhaustion)
Lime cross implies Strong Trending Uptrend for that time-frame (first phase)
Green cross implies Strong Trending Uptrend for that time-frame (second phase near exhaustion)
Red cross implies Trending Strong Downward for that time-frame (first phase)
Maroon cross implies Trending Strong Downward for that time-frame (second phase near exhaustion)
Yellow is ‘Squeeze On’ setting. During the squeeze period, the ADX signals are almost always ineffective. One may wait and watch over during this time. Once the Squeeze is released (i.e. no longer yellow), the trend corresponds to the color of the dots and crosses.
Black is CRSI Overbought condition for that time-frame. It’s best to wait and research for possibility of trend reversal because
1. Profit-booking/trimming happens after CRSI Overbought condition.
2. Large Short-sellers may take huge positions during this time pushing the stock prices up.
White is CRSI Oversold condition for that time-frame. It’s best to wait and research for possibility of trend reversal because
1. Profit-booking/trimming happens after CRSI Oversold conditions.
2. Large buyers may take huge positions during this time pushing the stock prices down.
I am a disabled man. Therefore, I am not able to write in detail here today. More Details will follow as time permits. Please let me know if I am missing anything…
Legal Disclaimer: I published here so I get replies from fellow viewers to educate myself and for my daily expenses. Hence, if anyone uses this script for making their decisions, I am not responsible for any failures incurred.
Safe Trading!
Kal Gandikota
PS: If you found this script interesting and edifying please follow and upvote.
PS2: Please kindly donate for my daily expenses (atleast as you would on streets) at the following addresses:
BTC Wallet: 1NeDC1GvpFa49DFLuT1v28ohFjqtoWXNQ5
ETH Wallet: 0x35e557F39A998e7d35dD27c6720C3553e1c65053
NEO Wallet: AUdiNJDW7boeUyYYNhX86p2T8eWwuELSGr
PS3: For more information on ADX and CRSI, please 'Google' or search here yourself.
PS4: This study is intended for research in creating automated Python Trading Systems using Pandas( steemit.com ).
Screenshots of the pinescript code looks as follows:
10minute Screenshot of Kal's MTF ADX Rangoli Roller (Above)
1 Hour Screenshot of Kal's MTF ADX Rangoli Roller (Above)
4 Hour Screenshot of Kal's MTF ADX Rangoli Roller (Above)
1 Day Screenshot of Kal's MTF ADX Rangoli Roller (Above)
1 Week Screenshot of Kal's MTF ADX Rangoli Roller (Above)
1 Month Screenshot of Kal's MTF ADX Rangoli Roller (Above)
Logarithmic Fibonacci RetraceThis script will allow you to use Logarithmic (instead of linear) Fibonacci retrace.
Please see excellent write up here: www.elliottwavetrader.net
explaining why logarithmic is preferred, especially over large price movement and long timeframes.
All TradingView fib tools use linear math, and will show incorrect long-term levels because of this.
HOW TO USE:
* Enter your points for Wave 0 and 1. Example: 1810.10 and 2872.87 in the SPX chart shown.
* Turn on "show lines" and "show labels". These are OFF by default because the chart will usually get warped
if you display the lines before entering the actual values you want.
* Change the "label offset" if the fib labels are too close or too far from the chart.
Please be aware that this is considered an "INDICATOR" script and so will not save the values separately
for each chart. You will need to enter new values each time you change to a different symbol.

Logarithmic Fibonacci ExtensionThis script will allow you to use Logarithmic (instead of linear) Fibonacci extensions.
Please see excellent write up here: www.elliottwavetrader.net
explaining why logarithmic is preferred, especially over large price movement and long timeframes.
All TradingView fib tools use linear math, and will show incorrect long-term levels because of this.
HOW TO USE:
* Enter your points for Wave 0, 1, and 2. Example: 666.79, 1219.80, 1010.91 in the SPX chart shown.
* Turn on "show lines" and "show labels". These are OFF by default because the chart will usually get warped
if you display the lines before entering the actual values you want.
* Change the "label offset" if the fib labels are too close or too far from the chart.
* Select up to 2.000, 3.000, and 4.000 to display higher-power fibs.
Please be aware that this is considered an "INDICATOR" script and so will not save the values separately
for each chart. You will need to enter new values each time you change to a different symbol.

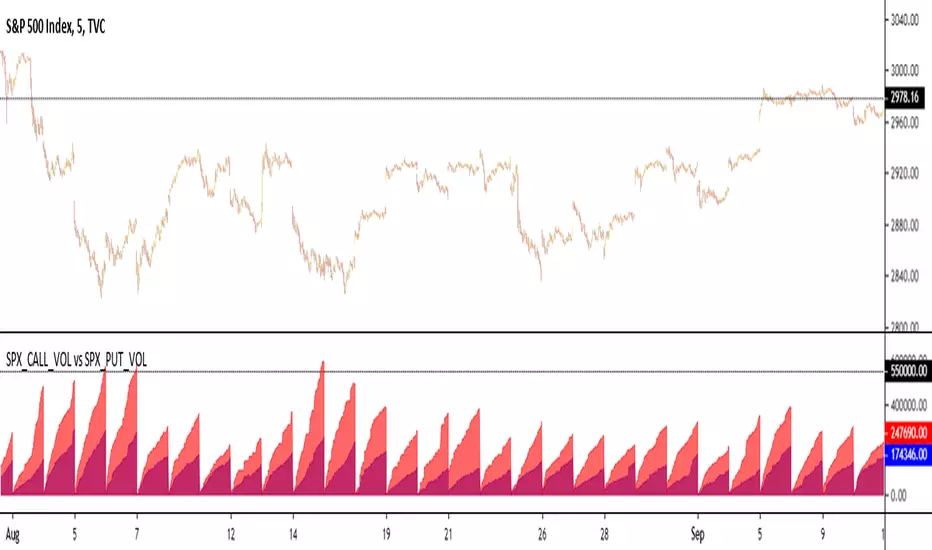
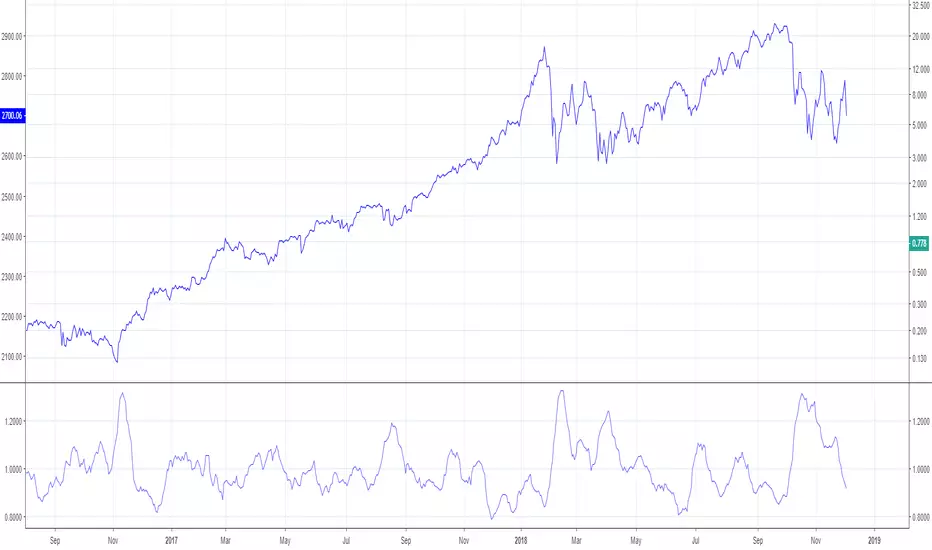
Put/Call Ratio De-TrendedExperimenting with de-trending the various Put/Call Ratios.
Use with tickers PCCE, PCC, PCE, PCOEX, etc. Type "PUT" in the ticker field to see the many options. Use daily charts. Then you can hide the put call ratio and overlay SPX to see the signals. The default MAs are a common way to detrend. Basically takes the 10 day moving average and 127 day moving average(half year in trading days), to "de-trend" the ratio to weed out the noise that is seen in the ratio.
If you can find anything useful or interesting with this, let me know. I think it is useful as is, but if you find an interesting way to use it let me know.
Advance Decline Line NYSE-BuschiThis script shows the Advance Decline Line of the NYSE (dark blue)in comparison to the SPX (light blue). There is also a difference line of the two series (red).
Both are indexed to current values to allow a better overview. Series can be smoothed via the length of the Moving Average.
I consider it more of a work in progress. I work on a more inuitive kind of presentation.


Dollar / Stocks Correlation OscillatorMakes visual the theory that "a strong dollar is bullish for equities/stocks"
...but oh man, these two are definitely not that strongly correlated.
What's the deal with that? Still learning. Glad for any comments.

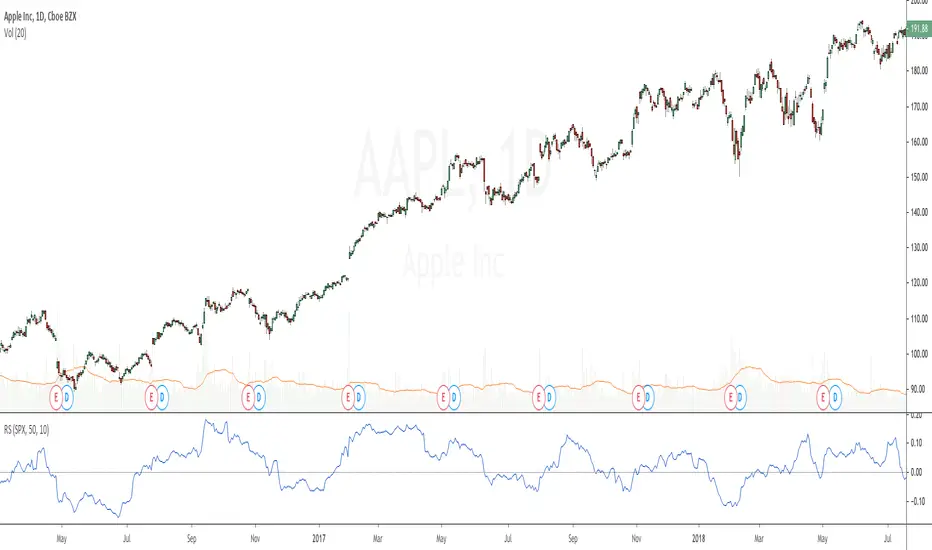
Relative StrengthRelative strength is a ratio between two assets, most often a stock and a market average (index). This implementation uses the method described here and the second method described here to calculate its value: "To calculate the relative strength of a particular stock, divide the percentage change over some time period by the percentage change of a particular index over the same time period". This indicator oscillates around zero. If the value is greater than zero, the investment has been relatively strong during the selected period; if the value is less than zero, the investment has been relatively weak. The period and the comparative symbol can be set in the settings for the indicator (the defaults are 50 and SPX), there you can also find an option to turn on a moving average.
Bollinger + RSI, Double Strategy Long-Only (by ChartArt) v1.2This strategy uses the RSI indicator together with the Bollinger Bands to go long when the price is below the lower Bollinger Band (and to close the long trade when this value is above the upper Bollinger band).
This simple strategy only places a long, when both the RSI and the Bollinger Bands indicators are at the same time in a oversold condition.
In this new version 1.2 the strategy was simplified even more than before by going long-only, which made the strategy more successful in backtesting than the previous version (that older version also opened short trades).
This strategy does not repaint and was updated to PineScript version 3.
All trading involves high risk; past performance is not necessarily indicative of future results. Hypothetical or simulated performance results have certain inherent limitations. Unlike an actual performance record, simulated results do not represent actual trading. Also, since the trades have not actually been executed, the results may have under- or over-compensated for the impact, if any, of certain market factors, such as lack of liquidity. Simulated trading programs in general are also subject to the fact that they are designed with the benefit of hindsight. No representation is being made that any account will or is likely to achieve profits or losses similar to those shown.
P.S. For advanced users: If you want also be able to short with the same strategy approach, then please use my older version 1.1:

Modulate 40 SymbolsModulates (multiplies) 40 securities
Useful for assessing breadth
Defaults with the Top 40 holdings in SPX
Change symbols to measure breadth in an ETF
Bars Since VIX MedianBARS SINCE VIX17 Median by dime (v1.0 release) 04/02/2017
(Inspired by "Bars Since the last RSI Extreme" from DRodriguezFX)
This indicator is useful in tracking how many daily bars since the VIX was last at a historically 'normal' range.
Currently the VIX has been in a period of low volatility for a period of 98 daily bars since the VIX was last at the 17 historical median.
