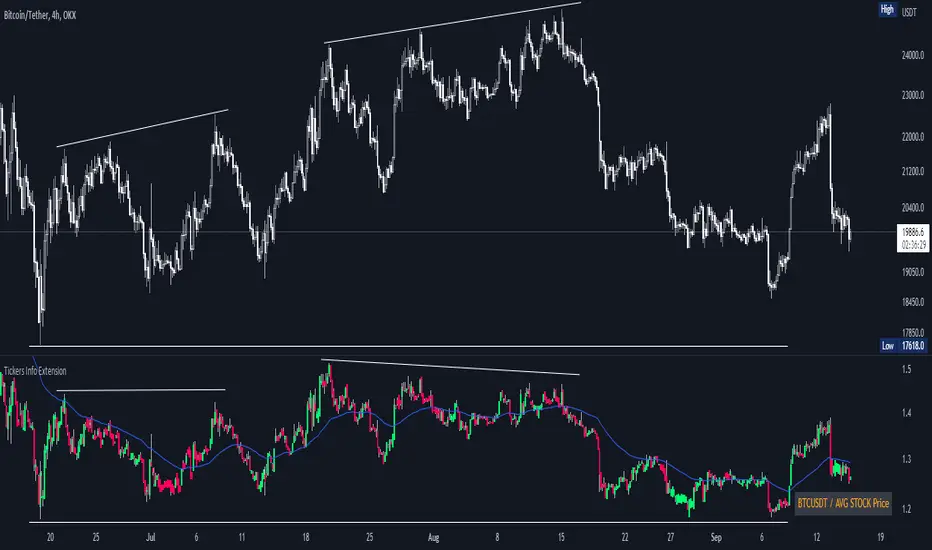
Tickers Info ExtensionWith the indicator you can easily evaluate or compare any ticker with the one you choose in the options.
You can choose any of the tickers I provide in the mod options to your liking :
XAU
DXY
BTC
ETH
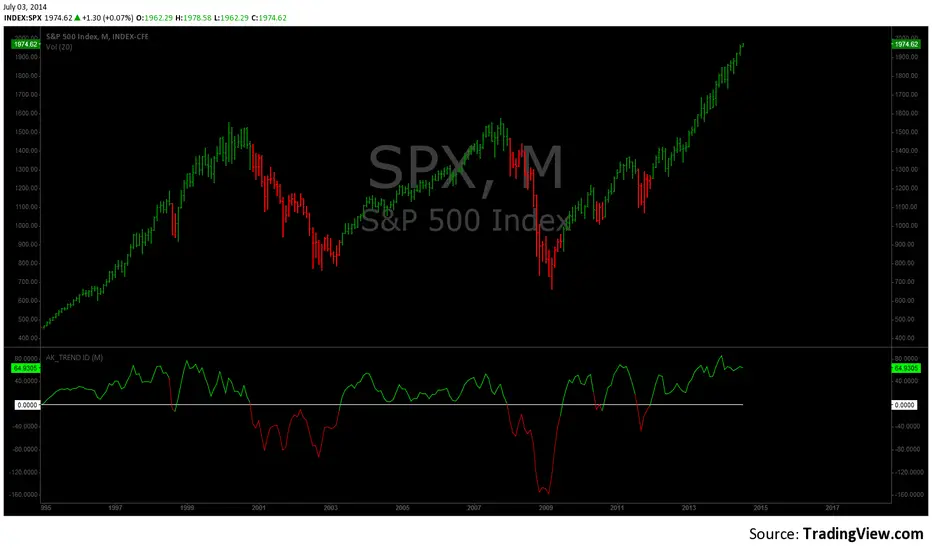
SPX
NASDAQ
AVG Stable Dominance
AVG Stock Price
Custom
You can also select or create your own ticker if you select the Custom in Mode option.
If the Compare mode is enabled, then the current ticker you are viewing is divided by the ticker selected in the indicator (in the Mode option).
Thus, you create a new pair and can evaluate the strength of this or that asset.
For example, if you have the ticker BTCUSDT open. And the ticker XAU is selected in the Mode option in the indicator. And the Compare mode is also enabled. Then you will get a new BTCUSDT/XAU pair. That means that now you can see the bitcoin/gold ratio. (Same as EUR/USD etc.)
If the Compare option is switched off then you will see the usual ticker you choose in the Mode option. You can also see if there is a correlation between the selected pairs.
Option ' AVG STABLE.D ' = Calculated as: USDT.D + USDC.D + DAI.D
- This is the average domination of the most important Stable Coins
Option ' AVG STOCK Price ' = Calculated as: (DJI + SPX + NDQ) / 3
- This is the average price of the most important Indexes.
Indicador Pine Script®