Candle Breakout StrategyShort description (one-liner)
Candle Breakout Strategy — identifies a user-specified candle (UTC time), draws its high/low range, then enters on breakouts with configurable stop-loss, take-profit (via Risk:Reward) and optional alerts.
Full description (ready-to-paste)
Candle Breakout Strategy
Version 1.0 — Strategy script (Pine v5)
Overview
The Candle Breakout Strategy automatically captures a single "range candle" at a user-specified UTC time, draws its high/low as a visible box and dashed level lines, and waits for a breakout. When price closes above the range high it enters a Long; when price closes below the range low it enters a Short. Stop-loss is placed at the opposite range boundary and take-profit is calculated with a user-configurable Risk:Reward multiplier. Alerts for entries can be enabled.
This strategy is intended for breakout style trading where a clearly defined intraday range is established at a fixed time. It is simple, transparent and easy to adapt to multiple symbols and timeframes.
How it works (step-by-step)
On every bar the script checks the current UTC time.
When the first bar that matches the configured Target Hour:Target Minute (UTC) appears, the script records that candle’s high and low. This defines the breakout range.
A box and dashed lines are drawn on the chart to display the range and extended to the right while the range is active.
The script then waits for price to close outside the box:
Close > Range High → Long entry
Close < Range Low → Short entry
When an entry triggers:
Stop-loss = opposite range boundary (range low for longs, range high for shorts).
Take-profit = entry ± (risk × Risk:Reward). Risk is computed as the distance between entry price and stop-loss.
After entry the range becomes inactive (waitingForBreakout = false) until the next configured target time.
Inputs / Parameters
Target Hour (UTC) — the hour (0–23) in UTC when the range candle is detected.
Target Minute — minute (0–59) of the target candle.
Risk:Reward Ratio — multiplier for computing take profit from risk (0.5–10). Example: 2 means TP = entry + 2×risk.
Enable Alerts — turn on/off entry alerts (string message sent once per bar when an entry occurs).
Show Last Box Only (internal behavior) — when enabled the previous box is deleted at the next range creation so only the most recent range is visible (default behavior in the script).
Visuals & On-chart Info
A semi-transparent blue box shows the recorded range and extends to the right while active.
Dashed horizontal lines mark the range high and low.
On-chart shapes: green triangle below bar for Long signals, red triangle above bar for Short signals.
An information table (top-right) displays:
Target Time (UTC)
Active Range (Yes / No)
Range High
Range Low
Risk:Reward
Alerts
If Enable Alerts is on, the script sends an alert with the following formats when an entry occurs:
Long alert:
🟢 LONG SIGNAL
Entry Price:
Stop Loss:
Take Profit:
Short alert:
🔴 SHORT SIGNAL
Entry Price:
Stop Loss:
Take Profit:
Use TradingView's alert dialog to create alerts based on the script — select the script’s alert condition or use the alert() messages.
Recommended usage & tips
Timeframe: This strategy works on any timeframe but the definition of "candle at target time" depends on the chart timeframe. For intraday breakout styles, use 1m — 60m charts depending on the session you want to capture.
Target Time: Choose a time that is meaningful for the instrument (e.g., market open, economic release, session overlap). All times are handled in UTC.
Position Sizing: The script’s example uses strategy.percent_of_equity with 100% default — change default_qty_value or strategy settings to suit your risk management.
Filtering: Consider combining this breakout with trend filters (EMA, ADX, etc.) to reduce false breakouts.
Backtesting: Always backtest over a sufficiently large and recent sample. Pay attention to slippage and commission settings in TradingView’s strategy tester.
Known behavior & limitations
The script registers the breakout on close outside the recorded range. If you prefer intrabar breakout rules (e.g., high/low breach without close), you must adjust the condition accordingly.
The recorded range is taken from a single candle at the exact configured UTC time. If there are missing bars or the chart timeframe doesn't align, the intended candle may differ — choose the target time and chart timeframe consistently.
Only a single active position is allowed at a time (the script checks strategy.position_size == 0 before entries).
Example setups
EURUSD (Forex): Target Time 07:00 UTC — captures London open range.
Nifty / Index: Target Time 09:15 UTC — captures local session open range.
Crypto: Target Time 00:00 UTC — captures daily reset candle for breakout.
Risk disclaimer
This script is educational and provided as-is. Past performance is not indicative of future results. Use proper risk management, test on historical data, and consider slippage and commissions. Do not trade real capital without sufficient testing.
Change log
v1.0 — Initial release: range capture, box and level drawing, long/short entry by close breakout, SL at opposite boundary, TP via Risk:Reward, alerts, info table.
If you want, I can also:
Provide a short README version (2–3 lines) for the TradingView “Short description” field.
Add a couple of suggested alert templates for the TradingView alert dialog (if you want alerts that include variable placeholders).
Convert the disclaimer into multiple language versions.
Buscar en scripts para "session"

ORBSMMAATRVOLREENTRY2Contracts📈 Opening Range Fibonacci Breakout (TradingView Strategy)
Overview:
The Opening Range Fibonacci Breakout strategy is designed to capture high-probability intraday moves by combining the power of the 15-minute opening range, trend confirmation via SMMA, and volume-based momentum filtering.
At the start of each trading session, the script automatically plots the Opening Range Box based on the first 15 minutes of price action — highlighting key intraday support and resistance levels.
How It Works:
Opening Range Setup
The first 15 minutes of the session define the range high and low.
A visual box marks this zone on the chart for easy reference.
Signal Generation
A Smoothed Moving Average (SMMA) with a user-defined period determines overall trend bias.
Candle volume is analyzed to confirm momentum strength.
Long Signal: Price breaks above the opening range high, SMMA trending up, and volume supports the move.
Short Signal: Price breaks below the opening range low, SMMA trending down, and volume supports the move.
Take Profit & Targets
Fibonacci extension levels are automatically plotted from the opening range.
These dynamic levels serve as structured Take Profit (TP) zones for partial or full exits.
Features:
✅ 15-Minute Opening Range Box
✅ Adjustable SMMA period
✅ Volume-based confirmation filter
✅ Automatic Fibonacci profit targets
✅ Visual Long/Short alerts & signals
Ideal For:
Scalpers and intraday traders who rely on early-session momentum, breakout confirmation, and precision exit targets.
Backtested for MNQ/NQ futures trading

BankNifty Etharia Aggresive Buyer / SellerOverview
Professional intraday trading strategy for BankNifty Futures that identifies high-probability setups by combining multiple technical indicators. Works in BOTH directions - LONG and SHORT.
Best Timeframe: 5-Minute Chart
Key Features:
✅ Multi-Confluence Entry System - All indicators must align for signal
✅ Bidirectional Trading - Captures both uptrends and downtrends
✅ Advanced Risk Management - Daily loss limits, consecutive loss protection
✅ Smart Exit System - Partial profit taking + trailing stops
✅ Session-Based Trading - Avoids opening and closing volatility
Entry Logic:
LONG Signals:
Price above Kernel Regression (trend confirmation)
Price above VWAP with positive slope (momentum)
Cumulative Volume Delta bullish (buying pressure)
Volume spike or increasing volume (strength confirmation)
Strong bullish candle with 60%+ body ratio
RSI filter to avoid overbought entries
SHORT Signals:
Price below Kernel Regression (downtrend confirmation)
Price below VWAP with negative slope (bearish momentum)
CVD bearish (selling pressure dominates)
High volume confirmation
Strong bearish candle pattern
RSI filter to avoid oversold entries
Exit Management:
🎯 Target 1: 1.5 R:R (50% position exit)
🎯 Target 2: 2.5 R:R (full exit)
🛡️ Stop Loss Options: ATR-based, Swing-based, or Fixed
🟡 Trailing Stop: Activates after 1.2 R:R, trails at 0.8 R:R
⏰ Time-Based Exit: Closes all positions 5 mins before session end
Risk Controls:
Maximum trades per day (default: 5)
Consecutive loss limit (default: 2)
Daily loss limit: 2.5% of capital
Daily profit target: 5% (stops trading when reached)
Position sizing based on account risk percentage
Recommended Settings:
Asset: BankNifty Futures (NSE:BANKNIFTY1!)
Timeframe: 5-minute
Initial Capital: ₹1,00,000
Risk per trade: 1%
Commission: 0.05%
Slippage: 5 points
Performance Expectations:
Win Rate: 55-65%
Profit Factor: 1.5-2.0
Average Trades/Day: 3-8
Risk:Reward: 1:1.8 average
Customizable Parameters:
Trading direction (Long Only / Short Only / Both)
Indicator lengths and thresholds
Stop loss type and targets
Risk management limits
Trading session hours
Best For:
Intraday traders seeking systematic, rule-based entries with strong confluence, proper risk management, and the ability to profit from both bullish and bearish market conditions.

Pivot SuperTrend Auto-Opt + WFO + MultiObj + Filter/Diag# Pivot SuperTrend (NetProfit Auto-Optimization) — Summary & Quick Start
## What this strategy is
A self-optimizing **SuperTrend-style** strategy for TradingView Pine v6 that:
- builds a **walk-forward, net-profit optimizer** directly on the chart,
- adapts its trailing stop/entry logic to **market regime** and **volatility**, and
- exposes a **filter/gate suite** so you can dial aggressiveness vs. noise without breaking auto-optimization.
Default tuning: **Bybit ETHUSDT Perpetual, 30m** (works elsewhere once tuned).
---
## Core logic (high level)
### 1) SuperTrend backbone (with Center/Pivots)
- **Center line**: smoothed running pivot from `ta.pivothigh/low`.
- **SuperTrend bands**: `Center ± Factor × ATR(length)` with a carry rule to reduce whipsaws.
- **Trend state**: `+1` above band, `-1` below band.
- **Flip**: trend change; can require **1-bar confirmation**.
### 2) Adaptive smoothing (AMA of ST)
- Performance-weighted **alpha** smooths the trailing stop.
- Alpha clamped to `alpha_min…alpha_max` using optimizer’s fitness.
### 3) On-chart net-profit optimizer (walk-forward)
- Grid of parameters:
- ATR Length `len` (min…max…step)
- ATR Factor `F` (min…max…step)
- Performance memory `A` (min…max…step)
- Each grid point is paper-traded **each bar** including fees/slippage → **fitness = net profit EMA**.
- Every `opt_interval` bars the **best** candidate is activated (with hysteresis).
- Optional: apply only **ATR margin** gate inside the optimizer for speed/stability.
### 4) Regime detection & anti-chop
- Custom **ADX** + **Center slope** to classify **trend** vs **range**.
- Adaptive thresholds in range regime (distance-to-center, ST-near-center block, etc.).
- Optional **ATR fast/slow ratio** gate.
- Other tools: **min bars since flip**, **hold bars after flip**, **distance to center**, **ST near center** block.
### 5) Entry logic
- **Immediate on flip** or **1-bar confirm**.
- Must pass the **Filter Suite** (toggleable gates):
- ATR-margin cross (hard cross or wick reject)
- Trend Regime (require trend)
- Hold-after-flip
- Distance-to-center
- ST-near-center block
- Volatility ratio (ATR fast/slow)
- Min bars since flip (flip cooldown)
- Daily trade cap & post-loss cooldown
- Trading session window
### 6) Starter preset (failsafe)
- Lenient defaults so trades start quickly to build warm-up data; then you can tighten gates.
### 7) Position management
- Strategy entries for “LONG” / “SHORT”.
- Optional **50% take-profit on Center** (“usecenter”).
- **Only-Long** mode supported with separate exit logic if regime turns bearish.
### 8) Risk controls
- **Max trades per day**, **cooldown bars after loss**, **session window**.
- Optional **bar coloring**, **trend shading**, **signal markers**.
- **Diagnostics** labels show which gate blocked an entry (letters `M T H D N V F C CD S`).
### 9) Alerts & Bybit webhook
- Use alert condition: **Any alert() function call**.
- Fires `"LONG_CONFIRMED"` / `"SHORT_CONFIRMED"`.
---
## Inputs overview
- **Pivot / Center**: pivot length; show pivots & center.
- **Visual**: line widths, bar colors, shading; warm-up bars.
- **Execution / Costs**: fee (bps), slippage (bps), “Only long”, 50% center-close.
- **Auto-Optimize**: grids for `len`, `F`, `A`, interval, memory, acceptance floor.
- **Signal Controls**: 1-bar confirm, ATR margin, min bars since flip.
- **Anti-Chop**: distance to center, hold bars, slope len, ST-near-center ATR, ATR slow len & ratio.
- **Trend Regime**: ADX len/threshold, center slope threshold, “require trend”.
- **Risk Gates**: max trades/day, loss cooldown bars.
- **Session**: optional 07:00–22:00 UTC filter.
- **Diagnostics**: show gate diagnostics labels.
- **Filter Suite**: toggle each gate; optional “apply margin to optimizer”.
- **Starter preset** selector.
---
## Plots & UI
- **Adaptive SuperTrend** (active candidate),
- **PP Center** (optional),
- **Trend shading** (price vs ST zone),
- **Entry/Exit markers** (triangles),
- **Diagnostics** text labels (optional).
---
## Webhook notes (Bybit v5)
If you use a direct Bybit webhook:
- **Symbol**: TradingView may emit `ETHUSDT.P`. Bybit wants `ETHUSDT`. Your relay should **strip `.P`**.
- **Side**: TV provides `buy/sell`. Bybit expects `Buy/Sell` → normalize casing in the relay.
- **Reduce-only**: mark exits and partial closes reduce-only to avoid reversals in Hedge mode.
- **Market orders**: pass `"orderType":"Market"`; ignore price or set to `"marketPrice"` if your relay requires it.
**Entry (Market)**
```json
{
"exchange": "BYBIT",
"category": "linear",
"symbol": "{{ticker}}",
"side": "{{strategy.order.action}}",
"orderType": "Market",
"qty": "{{strategy.order.contracts}}",
"reduceOnly": false,
"timestamp": "{{timenow}}",
"clientOrderId": "pst_{{strategy.order.id}}_{{timenow}}"
}

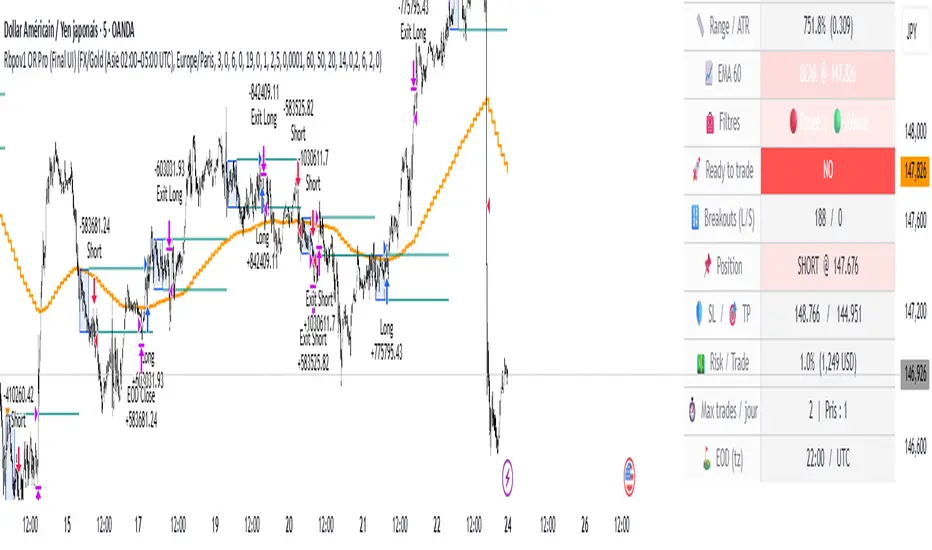
Rbpov1 – Opening Range Multi-Actifs Final📌 Strategy Bio – Rbpov1 Opening Range Pro
🎯 Core Concept
The Rbpov1 Opening Range Pro is an advanced algorithmic trading system built around the opening range breakout concept.
It is based on the observation that, after a period of consolidation (the opening range), markets often generate strong directional moves once the range is broken.
This strategy is designed to be multi-asset (Forex, indices, commodities, crypto) and multi-timeframe, with the following key principles:
A reference range (default: 03:00 → 06:00 UTC+2, customizable).
Trade entries are taken only after the range closes.
Smart filtering (trend, volatility, volume) to reduce false signals.
Strict risk management in USD, with Stop Loss and Take Profit defined in multiples of R.
Automatic end-of-day flat rule: all positions are closed by session end.
⚙️ Filters & Conditions
🔹 1. Trend Filter (EMA HTF)
A 21-period EMA is applied to a higher timeframe (default: H4).
If price is above EMA, only longs are allowed.
If price is below EMA, only shorts are allowed.
👉 This aligns intraday trades with the dominant trend.
🔹 2. Volatility Filter (ATR)
Uses a 14-period ATR to validate range conditions.
Opening range is valid only if:
Range > minATR × ATR
Range < maxATR × ATR
Default: minATR = 0.2, maxATR = 6.0.
👉 Filters out noise (tiny ranges) or overextended volatility.
🔹 3. Volume Filter (Optional)
Breakout candle must show higher volume than the average (default SMA 20).
Prevents low-liquidity breakouts.
🔹 4. Session & Trading Rules
No trades during weekends (Forex).
Maximum X trades per day (default: 2).
Positions are force-closed at EOD (default: 19:00 UTC+2).
💰 Risk Management
Dynamic position sizing in USD (capital × risk%).
Stop Loss automatically set at the opposite side of the range (with optional buffer).
Take Profit in multiples of R (default: 1.5R).
Equity-based recalculation ensures consistency as account grows.
📊 Key Benefits
✅ Professional and modular architecture.
✅ Works across Forex, indices, gold, and crypto.
✅ Smart filtering for cleaner signals.
✅ Robust and consistent risk management.
✅ Automatic end-of-day flattening (no overnight risk).
✅ Modern and visual dashboard interface for readability.
🏆 Use Cases
Forex (USD/JPY, EUR/USD, GBP/USD) → Asian session ranges.
Indices (NAS100, US30, DAX) → NYSE opening ranges.
Gold (XAU/USD) → Tokyo or pre-London ranges.
Crypto (BTC, ETH) → Tailored to volatility peaks.
Options Strategy V2.0📈 Options Strategy V2.0 – Intraday Reversal-Resilient Momentum System
Overview:
This strategy is designed specifically for intraday SPY, TSLA, MSFT, etc. options trading (0DTE or 1DTE), using high-probability signals derived from a confluence of technical indicators: EMA crossovers, RSI thresholds, ATR-based risk control, and volume spikes. The strategy aims to capture strong directional moves while avoiding overtrading, thanks to a built-in cooldown logic and optional time/session filters.
⚙️ Core Concept
The strategy executes trades only in the direction of the prevailing trend, determined by short- and long-term Exponential Moving Averages (EMA). Entry signals are generated when the Relative Strength Index (RSI) confirms momentum in the direction of the trend, and volume spikes suggest institutional activity.
To increase adaptability and user control, it includes a highly customizable parameter set for both long and short entries independently.
📌 Key Features
✅ Trend-Following Logic
Long entries are only allowed when EMA(short) > EMA(long)
Short entries are only allowed when EMA(short) < EMA(long)
✅ RSI Confirmation
Long: Requires RSI crossover above a configurable threshold
Short: Requires RSI crossunder below a configurable threshold
Optional rejection filters: Entry blocked above/below specific RSI extremes
✅ Volume Spike Filter
Confirms institutional participation by comparing current volume to an average multiplied by a user-defined factor.
✅ ATR-Based Risk Management
Both Stop Loss (SL) and Take Profit (TP) are dynamically calculated using ATR × a multiplier.
TP/SL ratio is fully configurable.
✅ Cooldown Control
After every trade, the system waits for a set number of bars before allowing new entries.
This prevents overtrading and increases signal quality.
Optionally, cooldown is ignored for reversal trades, ensuring the system can react immediately to a confirmed trend change.
✅ Candle Body Filter (Noise Control)
Avoids trades on candles with too small bodies relative to wicks (often noise or indecision candles).
✅ VWAP Confirmation (Optional)
Ensures price is trading above VWAP for long entries, or below for short entries.
✅ Time & Session Filters
Trades only during regular market hours (09:30–16:00 EST).
No-trade zone (e.g., 14:15–15:45 EST) to avoid low-liquidity traps or late-day whipsaws.
✅ End-of-Day Auto Close
All open positions are force-closed at 15:55 EST, protecting against overnight risk (especially relevant for 0DTE options).
📊 Visual Aids
EMA plots show trend direction
VWAP line provides real-time mean-reversion context
Stop Loss and Take Profit lines appear dynamically with each trade
Alerts notify of entry signals and exit triggers
🔧 Customization Panel
Nearly every element of the strategy can be tailored:
EMA lengths (short and long, for both sides)
RSI thresholds and length
ATR length, SL multiplier, and TP/SL ratio
Volume spike sensitivity
Minimum EMA distance filter
Candle body ratio filter
Session restrictions
Cooldown logic (duration + reversal exception)
This makes the strategy extremely versatile, allowing both conservative and aggressive configurations depending on the trader’s profile and the market context.
📌 Example Use Case: SPY Options (0DTE or 1DTE)
This system was designed and tested specifically for SPY and other intraday options trading, where:
Delta is around 0.50 or higher
Trades are short-lived (often 1–5 candles)
You aim to trade 1–3 signals per day, filtering out weak entries
🚫 Important Notes
It is not a scalping strategy; it relies on confirmed breakouts with trend support
No pyramiding or re-entries without cooldown to preserve risk integrity
Should be used with real-time alerts and manual broker execution
📈 Alerts Included
📈 Long Entry Signal
📉 Short Entry Signal
⚠️ Auto-closed all positions at 15:55 EST
✅ Proven Settings – Real Trades + Backtest Results
The current version of the strategy includes the optimal settings I’ve arrived at through extensive backtesting, as well as 3 months of real trading with consistent profitability. These results reflect real-world execution under live market conditions using 0DTE SPY options, with disciplined trade management and risk control.
🧠 Final Thoughts
Options Strategy V2.0 is a robust, highly tunable intraday strategy that blends momentum, trend-following, and volume confirmation. It is ideal for disciplined traders focused on SPY or other 0DTE/1DTE options, and it includes guardrails to reduce false signals and improve execution timing.
Perfect for those who seek precision, flexibility, and risk-defined setups—not blind automation.

Intraday Momentum StrategyExplanation of the StrategyIndicators:Fast and Slow EMA: A crossover of the 9-period EMA over the 21-period EMA signals a bullish trend (long entry), while a crossunder signals a bearish trend (short entry).
RSI: Ensures entries are not in overbought (RSI > 70) or oversold (RSI < 30) conditions to avoid reversals.
VWAP: Acts as a dynamic support/resistance. Long entries require the price to be above VWAP, and short entries require it to be below.
Trading Session:The strategy only trades during a user-defined session (e.g., 9:30 AM to 3:45 PM, typical for US markets).
All positions are closed at the session end to avoid overnight risk.
Risk Management:Stop Loss: 1% below/above the entry price for long/short positions.
Take Profit: 2% above/below the entry price for long/short positions.
These can be adjusted via inputs for optimization.
Position Sizing:Fixed lot size of 1 for simplicity. Adjust based on your account size during backtesting.

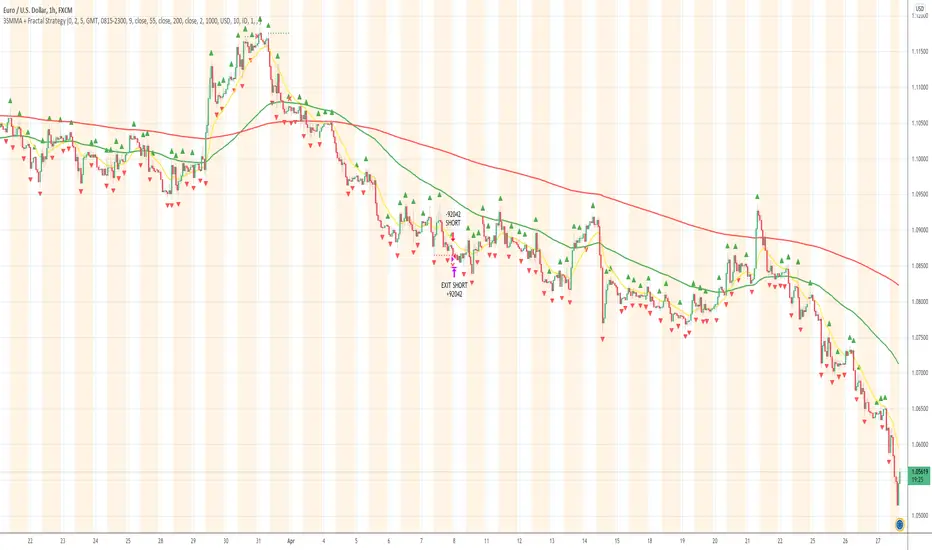
3SMMA + Fractal Strategy [Kintsugi Trading]What is the 3SMMA + Fractal Strategy?
This premium indicator was inspired by my desire to find and place high probability forex trades in any market, direction, or time of day.
Why Forex?
The Forex markets operate 24 hours, 5.5 days a week
Access to meaningful leverage
Ability to easily trade long or short
High liquidity
How to use it!
----- First, start by choosing Breakout Additional PIP Size, Stop Additional PIP Size, and Target Profit (TP) PIP Size. -----
- Breakout Additional PIP Size = Additional PIPs beyond the default strategy entry point.
- Stop Additional PIP Size = The default stop is above/below the signal candle, depending on trade direction. This input allows the user to target more or less PIPs as a stopping-out point.
- Target Profit (TP) PIP Size = Number of PIPs set at a target profit.
----- Next, we set the Session Filter. -----
Set the Timezone and Trade Session you desire. If no specific session is desired, simply leave the box unchecked.
----- Next, we set the Length of the 3 Smoothed Moving Averages. -----
Enter the Desired Moving Average Length:
Length 1 - Source
Length 2 - Source
Length 3 - Source
These inputs will determine whether the strategy looks for Long or Short positions.
----- Next, we set the Fractal Periods. -----
This user input re-programs the strategy to only allow for 'n' number of lower or higher candles on either side of a fractal signal.
For example: If the user inputs "5" for the number of Periods, Fractal indicator signals will only appear on candles with "5" candles higher or lower on both sides of the signal candle.
In combination with the 3 Smoothed Moving Averages, the Fractal signals help us determine when to take a trade and in what direction.
The strategy is essentially looking for trades going with the overall trend and placing potential trades after a low has been reached and is re-tested in the overall trend direction.
----- Finally, we backtest our ideas. -----
After using the 'Strategy Tester' tab on TradingView to thoroughly backtest your predictions you are ready to take it to the next level - Automated Trading!
This was my whole reason for creating the script. If you work a full-time job, live in a time zone that is hard to trade, or just don't have the patience, this will be a game-changer for you as it was for me.
Auto-Trading
When it comes to auto-trading this strategy I have included two options in the script that utilize the alert messages generated by TradingView.
*Note: Please trade on a demo account until you feel comfortable enough to use real money, and then please stick to 1%-2% of your total account value in risk per trade.*
AutoView
PineConnector
Good luck with your trading!
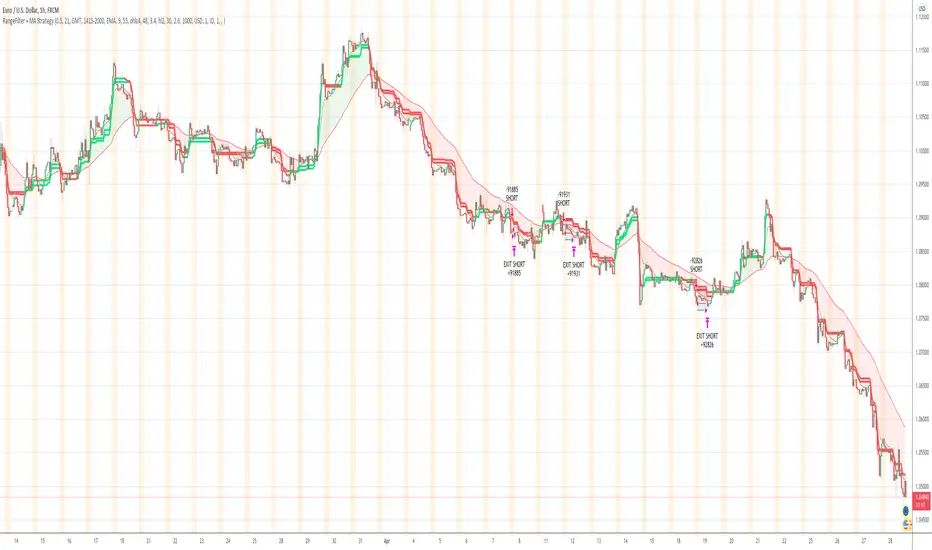
Range Filter + MA Strategy [Kintsugi Trading]What is the Range Filter + MA Strategy?
This premium indicator was inspired by my desire to find and place high probability forex trades in any market, direction, or time of day.
Why Forex?
The Forex markets operate 24 hours, 5.5 days a week
Access to meaningful leverage
Ability to easily trade long or short
High liquidity
How to use it!
----- First, start by choosing a Risk/Reward Ratio and Stop PIP Size. -----
- Risk/Reward Ratio = If you have a .5 risk/reward, it means you are risking $100 to make $50.
- Stop PIP Size = How many PIPs will be representative of the max risk. i.e. - if you are risking $100 and you set the PIP stop to 10, that means 10 PIPs = $100.
----- Next, we set the Session Filter. -----
Set the Timezone and Trade Session you desire. If no specific session is desired, simply leave the box unchecked.
----- Next, we set the Moving Average Cloud. -----
Enter the Moving Average Type:
Simple Moving Average
Exponential Moving Average
Hull Moving Average
Weighted Moving Average
Smoothed Moving Average
Enter the fast and slow Moving Average Period.
These inputs will determine whether the strategy looks for Long or Short positions.
----- Next, we set the Range Filters. -----
In combination with the Moving Average Cloud, the Range Filter will help us determine when to take a trade and in what direction.
The strategy is essentially looking for small reversals going against the overall trend and placing a trade once that reversal ends and the price moves back in the direction of the overall trend.
The Range filter utilizes confirmation between two entirely separate Range Filter calculations (or set them both equal to use one).
Each Range Filter is completely customizable by:
Source Calculation (open, high, low, close, hl2, hlc3, ohlc4, hlcc4)
Sampling Period
Range Multiplier
----- Finally, we backtest our ideas. -----
After using the 'Strategy Tester' tab on TradingView to thoroughly backtest your predictions you are ready to take it to the next level - Automated Trading!
This was my whole reason for creating the script. If you work a full-time job, live in a time zone that is hard to trade, or just don't have the patience, this will be a game-changer for you as it was for me.
Auto-Trading
When it comes to auto-trading this strategy I have included two options in the script that utilize the alert messages generated by TradingView.
*Note: Please trade on a demo account until you feel comfortable enough to use real money, and then please stick to 1%-2% of your total account value in risk per trade.*
AutoView
PineConnector
Good luck with your trading!
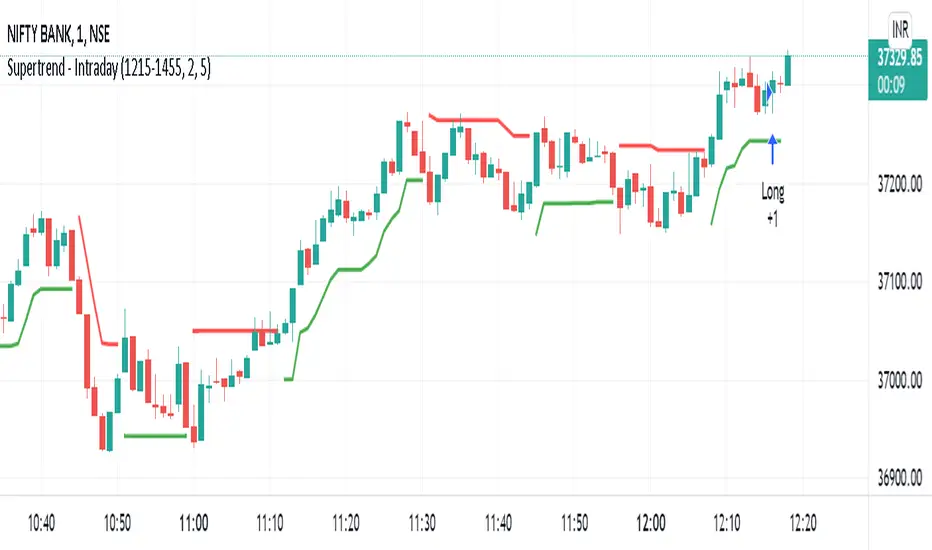
Supertrend - IntradaySupertrend Intraday Strategy
Basic supertrend strategy purpose built for intraday trading. Users can define intraday session during which the strategy will run.
Position is reversed when signal changes by using double quantity. Once the intraday session is over & if the position is open; it is squared off.
Parameters:
Intraday Session - Defines the duration for which the strategy should execute.
Multiplier
ATR Period
Moving Average - IntradayMoving Average Intraday Strategy
Basic moving average strategy purpose built for intraday trading. It uses two simple moving averages & takes a positions on crossover.
Position is reversed when signal changes by using double quantity. Once the intraday session is over & if the position is open; it is squared off.
Users can define intraday session during which the strategy will run.
Parameters:
Intraday Session - Defines the duration for which the strategy should execute.
Short Term Moving Average Period
Long Term Moving Average Period

NYCOB Kill Zone StrategyI have now turned the NYCOB Kill zone into a stand alone strategy!
Fully customizable in regards to time of entry and levels of entry but the standard settings are the best all around.
Original NYCOB Kill Zone text below
This script plots the H and L of the first 2 hours of the NYC session and shades the space between in which i deem the NYC Order Block
It also maps out the First two hours on the chart as well so you can understand when the OB has formed
Over the past 3 years of trading cryptocurrency i have noticed a phenomena that has occurred nearly every day
The H or L will 90% of the time will be posted in the first two hours of this session
knowing this means you understand if you just wait til this time you can better your odds at not getting stop hunted due to poor entry
A few things to take from this study are these.
1. after the OB is formed
2. whichever side gets taken out first (H/L) will 90% define the bias for the day. I have found that using the m13-m15 TF will add some more confirmation with 1-2 closes outside of range H/L/
3. After general bias has formed 2 things can happen
A) PA just takes off and there is really nothing you can do about it unless you had other studies that told you that will happen
B) PA will dip back INTO the OB and create the OTE which is any retracement below the .5 Fibonacci of the shaded OB
4. Typically OTE happens after the session has ended
5. If you used OTE off of the past days NYCOB then you can use the new (forming or just formed) NYCOB to CONFIRM your initial bias presented from the previous days OTE and bias.
6. When PA cannot close outside the NYCOB it presents a range to range play where PA will visit the opposite side of the range to chase liquidity,
7. When the NYCOB is TIGHT then deviation is more likely to result in price expansion, when the NYCOB is WIDE then deviation tends to present more range to range plays.
8. After bias is formed and OTE has been made your stops should always be outside the NYCOB. I use the m30 or H1 ATR to get a slight cushion from the OB to ensure i dont get stop hunted.
Standard TP are all set at the same level but you can adjust them accordingly
Shout out to Elevate-Trading family member Boederzeng for helping me with the code!

ak commodity gold,silver intradayHi friends this is Ak commodity gold , silver INTRADAY
It analyse price action when price makes higher high or higher low and it scalps and take profit ..It scalp on 1 min time frame..its occur in moment of time so for that algo trading require..it automatically take profit and stoploss and close trade near session end.it close all trade at 11pm..before commodity session close.. u can also change time for close trade...it automatically calculate previous candles high and low and when it breaks it generate buy and sell signal and take profit and loss
it is not holly grill strategy..it has drawdown...so before use be cauction..it calculates previous more than 200 candles high and low and than generate buy and sell signal.. its main advantage is it close all trade near session end so its more help full for intraday trader for backtesting..
if u want to use my strategy pls personal msg me

A.I.Driven TradersAI Model Trades for 20190612The entry and exit levels here are NOT derived from any specific indicator but are coming from our A.I. driven proprietary models.
This is an attempt at exploring the trading community here at TradingView and sharing our daily trading plans published at our site with the community here in the form a Pine Script - just starting and learning this platform. Please help point out any obvious errors or gotchas committed in the scripts. Thanks and have a great trading day!
**** The Trading Plan Published for today ****
>>>> Medium-Frequency Models: <<<<< For today, Wednesday 06/12, our medium-frequency models indicate using the 2895 as a pivot point - opening a long on a break above 2895, and opening a short on a break below 2895 (wait for a close on at least a five minute chart to determine the break), both sides with a 9-point trailing stop.
Note: For the trades to trigger, the breaks should occur during the regular session hours starting at 9:30am ET. By design, these models do NOT open any new positions after 3:45pm. Only one open position at any given time.
>>>>> Aggressive Intraday Models: <<<<< For today, Wednesday 06/12, our aggressive intraday models indicate going long on a break above 2892 or 2875 with an 6-point trailing stop, and going short on a break below 2887 or 2878 with an 8-point trailing stop.
Note: For the trades to trigger, the breaks should occur during regular session hours starting at 9:30am ET. Due to the intraday nature of these aggressive models, they indicate closing any open trades at 3:55pm and remaining flat into the session close. No opening of new positions after 3:45pm. Only one open position at any given time.

A.I.Driven Aggressive Intraday Models For 20190610(New to TradingView and trying to learn how best to share our daily Model Trades with the awesome community here. Still learning the tools here and may not be using the best approaches to publish ideas/charts/scirpts - please help us learn by suggesting best practices)
>>>>> Model Trades Published pre-market this morning at tradersai blogspot <<<<<
***** Medium-Frequency Models*****: For today, Monday 06/10, our medium-frequency models indicate going long on a break above 2903 with a 10-point trailing stop, and going short on a break below 2845 with an 8-point trailing stop.
---Note: For the trades to trigger, the breaks should occur during the regular session hours starting at 9:30am ET. By design, these models do NOT open any new positions after 3:45pm. Only one open position at any given time.---
***** Aggressive Intraday Models *****: For today, Monday 06/10, our aggressive intraday models indicate going long on a break above 2895 or 2886 or 2874 with an 8-point trailing stop, and going short on a break below 2890 or 2882 or 2870 with a 6-point trailing stop.
---- Note: For the trades to trigger, the breaks should occur during regular session hours starting at 9:30am ET. Due to the intraday nature of these aggressive models, they indicate closing any open trades at 3:55pm and remaining flat into the session close. No opening of new positions after 3:45pm. Only one open position at any given time.----

Turtle Multi-Market StrategyTurtle Multi-Market Strategy is a breakout trend-following approach designed to stay aligned with the dominant market direction and participate only when price proves it has enough strength to escape consolidation.
1. Core idea
This strategy treats trends as permission and breakouts as proof.
The market must already show a clear directional bias before any trade is considered. Only when price is consistently positioned on the correct side of the dominant direction does the strategy become active. This avoids engagement during random price movement and low-quality conditions.
2. Entry logic
Trades are initiated only when price demonstrates expansion beyond a well-defined recent range, signaling that the market may be transitioning from consolidation to directional movement.
An optional confirmation behavior can be used to avoid reacting to isolated spikes. In this case, the strategy waits for additional price acceptance beyond the breakout area before committing, favoring reliability over immediacy.
3. Trend quality filter
The strategy can optionally require evidence of genuine trend strength before allowing entries. When this filter is active, breakouts occurring in weak or indecisive environments are ignored. This helps reduce exposure during sideways markets where breakouts are more likely to fail.
4. Risk and position sizing
Risk is handled dynamically. Trade size adapts to current market volatility so that risk remains proportional across different instruments and volatility regimes. This makes the strategy suitable for use on crypto, commodities, indices, and forex without manual recalibration for each market.
5. Exit and trade management
Exits are protective and progressive.
A protective stop defines the initial risk and then adjusts as price moves favorably. As the trend develops, the stop follows price action, aiming to lock in gains while still allowing room for natural pullbacks.
An additional safety mechanism can be enabled to exit if the market decisively re-enters the long-term equilibrium zone. This reduces exposure during sharp reversals but may also shorten otherwise valid trends.
6. How to use it
This strategy is best applied to liquid markets where sustained trends can emerge and where breakouts carry informational value, such as major crypto pairs, gold, indices, and liquid forex pairs.
It performs best during transitions from consolidation to expansion and during trending phases. It is not designed for mean-reverting or range-bound environments.
7. Practical workflow
Apply it on higher intraday or swing-oriented timeframes.
Keep the trend strength filter enabled in mixed or uncertain market conditions.
Use confirmation on instruments prone to false breakouts or during news-sensitive sessions.
If price repeatedly fails to sustain movement and returns to equilibrium, standing aside is part of correct execution.
8. What to expect
Expect fewer trades rather than constant activity. Many positions will end with small controlled losses, while profitable trades tend to come from sustained directional moves. The edge lies in participation during expansion phases, not in high win rates or frequent signals.

Signal Algo - Elephant Edge Strategy🔶 Strategy Overview:
This strategy is designed for intraday trading and focuses on taking trades near important price reference areas instead of random market locations.
This strategy is designed to:
Take trades only near important price levels
Avoid random mid-market entries
Validate every trade using multiple confirmation filters
It combines the following core concepts:
Elephant Edge zones based on previous session volatility
Index & F&O strike price levels (psychological and liquidity-based levels)
Previous Day OHLC levels (important institutional reference prices)
The goal of this strategy is to allow trades only when price behavior is meaningful and occurs near key market reference areas, while filtering out low-quality signals. All filters are optional, allowing traders to customize the strategy according to their trading style, risk preference, and market conditions.
🔶 How to Use: Elephant Edge Support–Resistance
This strategy is based on the Elephant Edge Support–Resistance concept, where trades are taken only near important price zones instead of random market areas.
The image above shows how the strategy identifies Support Zones, Resistance Zones, and how trade entries and exits are generated.
🟩 Support Zones:
Shown as green areas. These are considered potential Buy zones.
A positive price reaction from these zones is required before a Buy entry is generated.
🟥 Resistance Zones:
Shown as red areas. These are considered potential Sell zones.
Price rejection from these zones is required before a Sell entry is generated.
Important:
The strategy does not blindly buy or sell at the zone. Entries are generated only after additional confirmation, such as: Candle structure validation, Directional filters, Optional, volume and time filters (if enabled)
Trade entries are generated only when price touches a Support or Resistance zone.
These zones represent areas where price is more likely to react, helping to avoid low-quality trades during sideways or random market movement.
Final Understanding:
This strategy is not about predicting the market. It is about reacting to price behavior at important levels and trading only when conditions are meaningful.
🔶 How to Use: Index Strike Price Support–Resistance
This concept is based on *Index & F&O Strike Price levels*, where trades are taken near important *round-number strike prices* (for example: every 50 or 100 points), instead of random price locations.
The image above shows how *strike prices act as natural Support and Resistance levels** in index trading.
🟩 Strike Price Support:
Strike levels below the current price act as potential Support zones. Price reaction from these levels is required before a Buy entry is generated.
🟥 Strike Price Resistance:
Strike levels above the current price act as potential Resistance zones. Price rejection from these levels is required before a Sell entry is generated.
Trade entries are generated only when price touches or reacts near a strike price level.
These levels represent *psychological and liquidity-based areas*, where price is more likely to pause, reverse, or react.
🔶 How to Use: Previous Day OHLC Levels
This concept is based on *Previous Day Open, High, Low, and Close (OHLC)* levels, which are widely used as *important market reference prices* by traders and institutions.
The image above shows how price reacts around Previous Day OHLC levels and how they act as natural *Support and Resistance areas** during intraday trading.
🟩 Previous Day Support Levels:
Previous Day Open, Low, or Close levels below the current price act as potential Support zones.
A positive price reaction from these levels is required before a Buy entry is generated.
🟥 Previous Day Resistance Levels:
Previous Day Open, High, or Close levels above the current price act as potential Resistance zones. Price rejection from these levels is required before a Sell entry is generated.
Trade entries are generated only when price touches or reacts near a Previous Day OHLC level.
These levels represent *high-interest price areas* where price is more likely to pause, reverse, or show strong reactions.
🔵 Strategy Setting Features Overview :
Trade Direction Controls : -
Buy Only When enabled: The strategy will generate only Buy trades All Sell signals are ignored Sell Only When enabled: The strategy will generate only Sell trades All Buy signals are ignored
Important Note If both Buy Only and Sell Only are enabled: The strategy can generate both Buy and Sell trades
Candle Direction & Color Filter : -
Available Options:
Both - Candle color is ignored Trades depend only on strategy logic
Trend - Buy → Green candles only. Sell → Red candles only
O-Trend - Buy → Red candles only. Sell → Green candles only
Continuous Buy / Sell Check : -
When enabled: Prevents repeated trades in the same direction Reduces over-trading during sideways markets Example: After a Buy trade, another Buy trade will not be taken immediately unless conditions reset.
Elephant Edge Percentile Levels : -
When enabled: Buy trades are allowed only near lower percentile levels Sell trades are allowed only near upper percentile levels
Why this matters: Percentile levels act as dynamic intraday support and resistance based on historical price movement.
Strike Price Level Filters : -
When enabled: Buy trades require price to touch lower strike zones Sell trades require price to touch upper strike zones
Why strike levels are important: Strike prices often act as psychological and liquidity zones, especially in index trading.
Previous Day OHLC Levels : -
When enabled: Draws Previous Day Open, High, Low, and Close on the chart Trades are allowed only when price touches any of these levels
Why Previous Day levels matter: These levels are widely watched by traders and institutions Price often reacts strongly near them Helps filter out low-probability trades
Stoploss Settings : -
Candle Touch: Stoploss triggers immediately when price touches the level
Candle Close: Stoploss triggers only after candle closes beyond the level
Stoploss Type Choose how stoploss distance is calculated:
Candle High / Low
Fixed Points
Percentage based
Trailing Stoploss : -
Trailing stoploss helps protect profits as price moves favorably. Trailing Mode
Points
Percentage
Trailing Activation Defines how much profit is required before trailing starts.
Candle Structure Filters : -
Candle Size : Filter Avoids trades on: Very small candles (low momentum) Extremely large candles (high risk)
Candle Body : Filter Ensures trades are taken only on candles with sufficient body strength.
Wick Filter : Filters out candles with unusually long wicks, which often indicate fake breakouts.
Hammer Candle Detection : -
Enable Hammer Pattern Detects hammer-type candles using wick-to-body ratios.
Useful for: Reversal-based setups near key levels
Entry & Stop Buffers : -
Buffers add small offsets to: Entry price Stoploss price
Purpose: Helps avoid false triggers caused by small price spikes or noise.
Volume-Based Validation : -
Use Volume Alert Validity Trades are allowed only after a high-volume candle appears.
Why volume matters: High volume confirms participation and interest.
Time & Trade Limits : -
Entry / Exit Time Restricts trades to specific market hours. Trade Count Limits Controls the maximum number of trades per session to avoid over-trading.
Quantity Calculation: -
Investment Amount Automatically calculates trade quantity based on capital amount.
Benefit: Helps maintain consistent risk across different instruments.
JSON Alert Output: -
Used for: Automation Broker integration This does not affect strategy logic.
⚠️ Disclaimer This strategy is provided for educational and research purposes only. Past performance does not guarantee future results. Users should test and manage risk independently.

FluxMA ProFluxMA Pro
FluxMA Pro is an intraday trend-following strategy based on moving-average cross signals , with built-in execution filters (time window + weekdays), direction control, and an optional strict one-trade-per-day rule.
The system enters when price crosses the selected moving average, and manages risk using fixed SL/TP in ticks . For clarity and auditing, it plots the MA and draws risk (SL) / reward (TP) zones on the chart.
This script is published for educational and research purposes , with documented mechanics and replication settings to support transparency and reproducibility.
How the strategy works
Signal engine (MA cross)
A base Moving Average (MA) is computed from a selectable price source.
A Long signal triggers when price crosses above the MA.
A Short signal triggers when price crosses below the MA.
Execution filters
Time filter : trades only inside the configured window (supports overnight windows correctly).
Weekday filter : enable/disable trading by day (Mon–Sun).
Direction filter : run Long only , Short only , or Both .
One trade per day (optional) : if enabled, once a trade is placed, no new trades are allowed until the next daily reset.
Risk management (ticks)
Stop-loss and take-profit are set using fixed distances in ticks from entry.
Orders are placed with a stop and a limit exit to keep execution auditable.
Visual audit layer
Plots the Moving Average on the chart.
Draws SL/TP zones as boxes that extend while the position is open.
Adds entry labels (“buy” / “sell”) for quick review in replays and optimizations.
Visual features
MA plot with selectable MA type (SMA/EMA/WMA/RMA) and length.
Risk/Reward boxes projected from entry (SL zone + TP zone).
Entry labels with configurable styling (label/flag) and colors.
Settings used for the published backtest (replication)
The performance screenshots included with this publication were generated using the following configuration:
Market & chart
Symbol : XAUUSD (FXCM feed)
Timeframe : 15 minutes
Date range : 02 Jan 2025 → 07 Nov 2025
Inputs (Strategy settings)
Source : Close
MA type : SMA
MA length : 10
Stop Loss : 1400 ticks
Take Profit : 2000 ticks
Time filter : enabled — 06:00 to 22:15 (exchange time)
Weekday filter : enabled — Monday to Sunday enabled
Direction : Long only
One trade per day : enabled
TradingView Strategy Properties used
Initial capital : 1,000 USD
Commission : 0.2 (as set in Strategy Properties)
Slippage : 1 tick
Backtest snapshot (as shown)
Net Profit : +727.41 USD (+72.74%)
Max Drawdown : 200.25 USD (12.71%)
Total Trades : 218
Win Rate : 52.29% (114 / 218)
Profit Factor : 1.485
Backtest context and limitations
Stop/limit fills may occur intrabar depending on TradingView’s execution model and bar magnifier assumptions.
Results vary by symbol, timeframe, broker feed, spreads, commissions, slippage, and session selection.
Past performance does not guarantee future results.
This script is not financial advice.
Originality and usefulness
While MA-cross strategies are a known concept, FluxMA Pro focuses on an execution-grade implementation designed for testing and disciplined deployment:
Execution guardrails : optional one-trade-per-day lock + direction filter to prevent over-trading and strategy drift.
Session handling done properly : time windows support overnight logic (no “broken window” edge cases).
MA modularity : SMA/EMA/WMA/RMA selection enables controlled experiments without rewriting logic.
Auditable visuals : SL/TP zones and labels allow fast review of behavior during replays, optimization, and multi-asset scans.

Deviation Burn + Pivots + Advanced stop + Midpoint CancelA session-based range strategy that places buy and sell orders at the session high and low, expecting price reactions from these levels.
Additional filters help avoid low-probability trades.

Institutional Execution Engine v3 [Nishith Rajwar]
Institutional Execution Engine v3
Market-Structure-Driven Execution Framework (Indicator + Strategy Hybrid)
The **Institutional Execution Engine v3** is a professional-grade execution framework designed to model **how institutional participants interact with liquidity, volatility regimes, and market structure**.
It is built for **index traders, crypto traders, and systematic intraday participants** who require **non-repainting, forward-validated signals** with strict risk control.
This is **not a mashup of indicators**.
Every module is purpose-built and interacts through a unified execution pipeline.
---
🔍 Core Concepts & Methodology
1️⃣ Market Structure & POI Engine
* Identifies **Points of Interest (POIs)** using swing structure, volatility context, and liquidity positioning
* POIs are **confirmed only after bar close** (strict non-repaint enforcement)
* Adaptive pivot sensitivity based on selected execution preset
2️⃣ Liquidity-Aware Scoring System
Each potential trade is filtered through a **multi-factor execution score**, including:
* Structural alignment
* Volatility normalization (ATR regime)
* Liquidity reaction quality
* Directional efficiency
Trades are only allowed when the **minimum institutional score threshold** is met.
3️⃣ Regime Detection (Forward-Walk Safe)
The engine dynamically classifies market conditions into execution regimes:
* Trending
* Rotational
* Mean-reverting
Regime detection is **forward-walk compatible** and does **not leak future data**.
4️⃣ Risk-First Execution Model
* ATR-normalized stop placement
* R-multiple-based take-profit targeting
* Optional **single-trade-per-session guard**
* Strategy engine includes **open-trade protection** to prevent over-execution
5️⃣ Strategy + Indicator Hybrid
This script can be used in **two ways**:
* **Indicator mode** → discretionary execution with visual POIs, signals, and context
* **Strategy mode** → systematic backtesting with full TradingView Strategy Tester support
Both modes share the **same execution logic** (no divergence).
---
⚙️ Preset-Driven Architecture
Built-in execution presets auto-configure internal parameters without changing core logic:
* **Scalp (Index)**
* **Daytrade (Index)**
* **Crypto Intraday**
* **Institutional Research (FWalk)**
Presets adjust pivot sensitivity, score thresholds, ATR behavior, and risk profile — while preserving execution integrity.
---
## 🚫 Non-Repainting & Data Integrity
* No look-ahead bias
* No future bar references
* No repainting signals
* VWAP and regime logic reset correctly per session
* Safe handling of strategy.opentrades to avoid execution errors
All signals are **bar-close confirmed**.
---
📊 Who This Is For
✔ Index traders (NIFTY / BANKNIFTY / SENSEX)
✔ Crypto intraday traders
✔ Systematic traders validating execution logic
✔ Traders who value **structure + liquidity + risk discipline** over indicators
---
⚠️ Disclaimer
This script is a **research and execution framework**, not financial advice.
Always forward-test and adapt risk parameters to your instrument and timeframe.
---
**Author:** Nishith Rajwar
**Version:** v3
**Execution Philosophy:** Trade where institutions execute — not where indicators react.

Buy-Dip / Sell-Pullback Buy the Dip / Sell the Pullback – Trend-Following Strategy (EOD → Next Day Execution)
Overview
This is a trend-following futures strategy designed to participate in pullbacks within established trends, not to predict reversals.
It works on End-of-Day (EOD) confirmation and executes trades on the next trading session, making it suitable for positional and swing traders.
The strategy combines momentum, trend direction, volatility, and price location to filter for high-quality setups while avoiding overtrading.
🔍 Core Philosophy
Trade only in the direction of the prevailing trend
Buy dips in uptrends
Sell pullbacks in downtrends
Avoid chasing price after extended gaps
Use volatility-adjusted risk management (ATR-based SL & targets)
📊 Indicators Used
RSI (20)
Measures underlying momentum strength
Stochastic Oscillator (55, 34, 21)
Confirms pullback exhaustion within a trend
Supertrend (10, 2)
Defines primary trend direction
Bollinger Bands (20, 2)
Provides structural trend bias
ATR (5)
Used for:
Entry gap filter
Stop-loss
Profit target
Supertrend buffer
✅ Long (Buy) Setup – Evaluated at EOD
A long setup is generated when all of the following conditions are satisfied at the close of the trading day:
RSI(20) is above the bullish threshold (default: 48)
Stochastic %K is above %D (confirming pullback momentum)
Supertrend direction is bullish
Price is near or above Supertrend, allowing a volatility-adjusted buffer (ATR-based)
Price is above the Bollinger Band middle line
This combination ensures:
The market is trending up
Momentum supports continuation
The pullback is controlled, not a breakdown
❌ Short (Sell) Setup – Evaluated at EOD
A short setup is generated when:
RSI(20) is below the bearish threshold (default: 52)
Stochastic %K is below %D
Supertrend direction is bearish
Price is near or below Supertrend, with an ATR buffer
Price is below the Bollinger Band middle line
This filters for pullbacks within sustained downtrends.
⏰ Trade Execution Logic (Next Day Rule)
Once a setup is confirmed at EOD, a trade is attempted on the next trading session
To avoid chasing gaps:
Long trades are allowed only if price does not move more than a defined multiple of the previous day’s True Range
Short trades follow the same logic in reverse
This is implemented via limit orders, ensuring realistic backtesting and execution behavior
🛑 Risk Management
All exits are volatility-adjusted using ATR:
Stop-Loss:
1.1 × ATR(5) from entry price
Target:
2.2 × ATR(5) from entry price
This results in a risk–reward ratio of approximately 1:2
ATR is frozen at entry to avoid forward-looking bias.
🧠 Why This Strategy Works
Avoids low-quality trades during consolidation
Participates only when trend + momentum align
Prevents emotional gap-chasing
Adapts automatically to changing volatility
Suitable for index futures and liquid stocks
📌 Recommended Usage
Timeframe: Daily
Instruments:
Index Futures (e.g. NIFTY, BANKNIFTY)
Highly liquid stocks
Market Type: Trending markets
Not ideal for: Sideways or low-volatility environments
⚙️ Customization Tips
You can control trade frequency and aggressiveness by adjusting:
RSI thresholds
Supertrend buffer (ATR multiple)
Gap filter multiplier
Stochastic edge parameter
Looser settings → more trades
Stricter settings → higher selectivity
⚠️ Disclaimer
This strategy is for educational and research purposes only.
Backtest results do not guarantee future performance.
Always validate with paper trading before deploying real capital.

Disoxis Capital Club📊 Strategy B✅This indicator has been exclusively developed for Disoxis Capital Club members, combining advanced volume-weighted analytics with institutional trading concepts.
The indicator automatically resets at the start of each trading session and uses volume-weighted statistical calculations to ensure accuracy that aligns with professional trading platforms. All visual elements, including customizable color schemes and line styles, have been optimized for clarity and real-time decision-making. Designed specifically for active intraday traders within the Disoxis Capital Club community, this indicator incorporates time-based filtering capabilities and session-specific analytics to help identify high-probability trading opportunities.
The tool displays key institutional levels through clean visual representation, making it easier to recognize market behavior around volume-weighted price zones. Whether you're analyzing futures, forex, or equity markets, this indicator provides the technical foundation needed to align your trading with smart money movements and institutional order flow patterns.

XAU BUY/SELL Scalping Strategy M5 PROFX:XAUUSD
This XAU/USD Pro Scalping Strategy is tailored specifically for the M5 timeframe , designed to capture rapid Gold price movements. Instead of relying on lagging indicators, this system utilizes advanced Price Action and Market Structure analysis to identify high-probability entry zones.
The core strength of this strategy lies in its built-in Money Management engine and Multi-threaded Trailing Stop system, ensuring capital preservation and profit maximization.
🚀 Key Features:
1. Smart Price Action Recognition:
The algorithm scans for specific market scenarios to apply dynamic Risk:Reward ratios (ranging from 1:1 to 1:3).
Filters out noise and false breakouts using multi-candle analysis.
Auto Position Sizing:
Calculates trade quantity automatically based on your defined Risk % per Trade .
Ensures consistent risk management regardless of the Stop Loss distance.
Intelligent Trailing Stop:
Uses a dynamic trailing mechanism based on "R" multiples (Risk Units).
Automatically secures profits by moving SL based on the specific setup type ("Case") of each trade.
Safety Filters:
Min SL and Max SL inputs prevent trades during periods of extremely low volatility or excessive risk.
⚙️ Settings:
Risk % per Trade: The percentage of equity to risk per trade (Recommended: 1.0% - 2.0%).
Min/Max SL Points: Dynamic boundaries for Stop Loss to adapt to current market volatility.
💡 Recommendations:
Symbol: XAUUSD / Gold - FXCM.
Timeframe: M5.
Best performance during London and New York sessions.
