Apex Edge - MTF Confluence PanelApex Edge – MTF Confluence Panel
Description:
The Apex Edge – MTF Confluence Panel is a powerful multi-timeframe analysis tool built to streamline trade decision-making by aggregating key confluences across three user-defined timeframes. The panel visually presents the state of five core market signals—Trend, Momentum, Sweep, Structure, and Trap—alongside a unified Score column that summarizes directional bias with clarity.
Traders can customize the number of bullish/bearish conditions required to trigger a score signal, allowing the tool to be tailored for both conservative and aggressive trading styles. This script is designed for those who value a clean, structured, and objective approach to identifying market alignment—whether scalping or swing trading.
How it Works:
Across each of the three selected timeframes, the panel evaluates:
Trend: Based on a user-configurable Hull Moving Average (HMA), the script compares price relative to trend to determine bullish, bearish, or neutral bias.
Momentum: Uses OBV (On-Balance Volume) with volume spike detection to identify bursts of strong buying or selling pressure.
Sweep: Detects potential liquidity grabs by identifying price rejections beyond prior swing highs/lows. A break below a previous low with reversal signals bullish intent (and vice versa for bearish).
Structure: Uses dynamic pivot-based logic to identify market structure breaks (BOS) beyond recent confirmed swing levels.
Trap: Flags potential false moves by measuring RSI overbought/oversold signal clusters combined with minimal price movement—highlighting exhaustion or deceptive breaks.
Score: A weighted consensus of the above components. The number of required confluences to trigger a score (default: 3) can be set by the user via input, offering flexibility in signal sensitivity.
Why It’s Useful for Traders:
Quick Decision-Making: The color-coded panel provides instant visual feedback on whether confluences align across timeframes—ideal for fast-paced environments like scalping or high-volatility news sessions.
Multi-Timeframe Confidence: Helps eliminate guesswork by confirming whether higher and lower timeframe conditions support your trade idea.
Customizability: Adjustable confluence threshold means traders can fine-tune how sensitive the system is—more signals for faster entries, stricter confluence for higher conviction trades.
Built-In Alerts: Automated alerts for score alignment, trap detection, and liquidity sweeps allow traders to stay informed even when away from the screen.
Strategic Edge: Supports directional bias confirmation and trade filtering with logic designed to mimic professional decision-making workflows.
Features:
Clean, real-time confluence table across three user-selected timeframes
Configurable score sensitivity via “Minimum Confluences for Score” input
Cell-based colour coding for at-a-glance trade direction
Built-in alerts for score alignment, traps, and sweep triggers
Note - This Indicator works great in sync with Apex Edge - Session Sweep Pro
Useful levels for TP = previous session high/low boxes or fib levels.
⚠️ Disclaimer:
This script is for informational and educational purposes only and should not be considered financial advice. Always perform your own due diligence and practice proper risk management when trading.
Buscar en scripts para "session high"

Opening Range and Market BoundariesOpening Range and Market Boundaries
This versatile and insightful indicator combines two powerful concepts frequently used by professional traders: Opening Range Analysis and Market Boundaries derived from previous high/low levels. It is specifically designed to support intraday trading strategies and helps you identify key price zones for entries, exits, and breakout confirmations.
🔍 Features & Utility
1. Opening Range Box
What it does:
Highlights the high and low of the first candle after market open (9:15 AM IST) with a shaded box. This box spans the full trading session, from 9:15 AM to 3:30 PM, representing the key price range where the initial balance is formed.
Timeframe Compatibility:
The Opening Range box is optimized for 1-minute to 1-hour charts. It is most effective on lower timeframes (1m, 5m, 15m, 30m) where intraday price movements and breakout patterns can be clearly observed.
Usage Tips:
Breakouts above or below the Opening Range box can signal potential directional bias for the rest of the trading day.
Price consolidating within the range may indicate a choppy or range-bound session.
Works well with volume and momentum indicators for confirmation.
2. Market Boundaries
What it does:
Plots horizontal lines at:
Previous Day High/Low
Previous Week High/Low
Previous Month High/Low
Why it matters:
These levels act as natural support and resistance zones, and are commonly watched by institutional traders, making them crucial for:
Spotting reversals or breakouts
Planning stop-loss and target zones
Avoiding trades around high-rejection areas
Customization Options:
Toggle ON/OFF for Daily, Weekly, and Monthly levels.
Independent colors and line thickness for each level, enabling you to distinguish between different timeframes easily.
🛠️ How to Use Effectively
Use during market open:
Switch to a 5-minute or 15-minute chart during the first few candles of the session. Observe the Opening Range box formation and plan trades based on breakout direction.
Confluence Trading:
Look for price action near previous session highs/lows in confluence with the Opening Range box edges. These intersections often become high-probability zones for breakouts or reversals.
Session Preparation:
Before the market opens, analyze where the price is relative to past high/low boundaries. If it's near a weekly/monthly level, be cautious — those areas can cause whipsaws or false breakouts.
Avoid low-volume breakouts:
Use this indicator in conjunction with volume tools or price action confirmation to validate the strength of a move outside the Opening Range or Market Boundaries.
📌 Summary
This indicator is designed for intraday traders, scalpers, and swing traders who want a reliable structure to guide their decisions. It visually marks the opening balance of the market and essential higher timeframe boundaries, helping you trade with discipline and precision.

London/NY Sessions + SMC Levels📜 Indicator Description: London/NY Sessions + SMC Levels
Overview: This indicator highlights the key trading sessions — London, New York, NY Lunch, and Asian Range — providing structured visual guides based on Smart Money Concepts (SMC) and ICT principles.
It dynamically plots:
Session Backgrounds and Boxes for London, NY, Lunch, and Asian sessions
Reference Levels for the High, Low, and Close from today, previous day, or weekly data
Midnight Open line for ICT-style power of three setups
Real-time alerts for session starts, session closes, and important price level crossings
Features:
🕰️ Session Visualization:
Toggle London, NY, Lunch, and Asian session ranges individually, with customizable colors and transparent backgrounds.
🔔 Built-in Alerts:
Alerts for:
Price crossing the previous day's high/low
Price crossing the Midnight Open
Start and end of major sessions (London, NY, Lunch, Asian)
🟩 Reference Levels:
Plot selectable session reference levels:
Today’s intraday High/Low/Close
Previous Day’s High/Low/Close
This Week’s or Previous Week’s levels for broader context.
🌙 Midnight Open:
Track the Midnight New York Open as a reference point for daily bias shifts.
🎯 Customizable Settings:
Choose your session time zones (UTC, New York, London, etc.)
Customize all border colors, background colors, and session hours.
Use Cases:
Identify killzones and optimal trade entry windows for Smart Money Concepts (SMC) and ICT strategies.
Monitor liquidity pool sweeps and session transitions.
Confirm or refine your intraday or swing trading setups by referencing session highs/lows.
Recommended For:
ICT traders
Smart Money Concepts (SMC) practitioners
Forex, indices, crypto, and futures traders focusing on session-based volatility patterns
Anyone wanting a clean, professional session mapping tool
📈
Designed to help you trade with session precision and Smart Money accuracy.
Integrates seamlessly into any ICT, Wyckoff, or Liquidity-based trading approach.

VWAP 2.0 with desv + Initial Balance by RiotWolftrading🌟 Overview
This powerful tool is designed for traders who want to harness the power of the Volume Weighted Average Price (VWAP) alongside session-based ranges to make informed trading decisions. Whether you're a day trader or a swing trader, this indicator provides a clean and effective way to identify support, resistance, and market trends—all in one place! 💡
✨ Key Features
Auto-Anchored VWAP 📊
Automatically calculates the VWAP based on a user-defined anchor period (e.g., Daily, Weekly, Monthly).
Resets at the start of each period (e.g., daily for a Daily anchor).
Displays a customizable VWAP line with standard deviation bands to highlight key price levels.
Standard Deviation Bands 📏
Plots up to three sets of standard deviation bands above and below the VWAP (multipliers: 1.0, 2.0, 3.0).
Includes volume percentage labels to show where trading volume is concentrated. 📉
Session High/Low Range 🕒
Identifies the high and low prices within a customizable session (default: 12:00 to 15:31).
Draws horizontal lines at the session high and low, with dotted deviation lines for additional reference points.
Perfect for spotting key levels during your trading session! 🔑
Time-Based Range Box ⏰
Highlights a specific time window (default: 15:40 to 15:50) with a colored box showing the high and low prices.
Ideal for tracking price action during high-impact events like news releases or market opens. 📅
Alerts 🚨
Set up alerts for when the price crosses above or below the VWAP—never miss a potential trading opportunity!
⚙️ Settings
Customize the indicator to fit your trading style with these easy-to-use settings:
VWAP Settings
Timezone 🌍: Select your timezone (default: GMT+2) to align calculations with your local time.
VWAP Source 📈: Choose the price source for VWAP (default: hlc3 - average of high, low, close).
Std Deviation Multipliers 📐: Adjust the multipliers for the bands (default: 1.0, 2.0, 3.0).
Line Width ✏️: Set the thickness of the VWAP and band lines (default: 1).
Session Time ⏳: Define the session window for VWAP calculations (default: 08:00-18:00, all days).
Show Upper/Lower Bands 👀: Toggle visibility for each set of bands (default: Band 1 visible, Bands 2 & 3 hidden).
Range Settings
Range Start/End Time 🕙: Set the time window for the range box (default: 15:40 to 15:50).
Box Color 🎨: Customize the border color (default: blue).
Box Background Color 🖌️: Adjust the background color (default: light aqua, 90% transparency).
I created this indicator to provide a streamlined, clutter-free tool for traders who rely on VWAP and session-based analysis. It focuses on the essentials—VWAP, standard deviation bands, session high/low, and range box—without unnecessary overlays. I hope it helps you in your trading journey! If you have feedback or suggestions, feel free to share—I’d love to hear from you! 😊

ICT Bread and Butter Sell-SetupICT Bread and Butter Sell-Setup – TradingView Strategy
Overview:
The ICT Bread and Butter Sell-Setup is an intraday trading strategy designed to capitalize on bearish market conditions. It follows institutional order flow and exploits liquidity patterns within key trading sessions—London, New York, and Asia—to identify high-probability short entries.
Key Components of the Strategy:
🔹 London Open Setup (2:00 AM – 8:20 AM NY Time)
The London session typically sets the initial directional move of the day.
A short-term high often forms before a downward push, establishing the daily high.
🔹 New York Open Kill Zone (8:20 AM – 10:00 AM NY Time)
The New York Judas Swing (a temporary rally above London’s high) creates an opportunity for short entries.
Traders fade this move, anticipating a sell-off targeting liquidity below previous lows.
🔹 London Close Buy Setup (10:30 AM – 1:00 PM NY Time)
If price reaches a higher timeframe discount array, a retracement higher is expected.
A bullish order block or failure swing signals a possible reversal.
The risk is set just below the day’s low, targeting a 20-30% retracement of the daily range.
🔹 Asia Open Sell Setup (7:00 PM – 2:00 AM NY Time)
If institutional order flow remains bearish, a short entry is taken around the 0-GMT Open.
Expect a 15-20 pip decline as the Asian range forms.
Strategy Rules:
📉 Short Entry Conditions:
✅ New York Judas Swing occurs (price moves above London’s high before reversing).
✅ Short entry is triggered when price closes below the open.
✅ Stop-loss is set 10 pips above the session high.
✅ Take-profit targets liquidity zones on higher timeframes.
📈 Long Entry (London Close Reversal):
✅ Price reaches a higher timeframe discount array between 10:30 AM – 1:00 PM NY Time.
✅ A bullish order block confirms the reversal.
✅ Stop-loss is set 10 pips below the day’s low.
✅ Take-profit targets 20-30% of the daily range retracement.
📉 Asia Open Sell Entry:
✅ Price trades slightly above the 0-GMT Open.
✅ Short entry is taken at resistance, targeting a quick 15-20 pip move.
Why Use This Strategy?
🚀 Institutional Order Flow Tracking – Aligns with smart money concepts.
📊 Precise Session Timing – Uses market structure across London, New York, and Asia.
🎯 High-Probability Entries – Focuses on liquidity grabs and engineered stop hunts.
📉 Optimized Risk Management – Defined stop-loss and take-profit levels.
This strategy is ideal for traders looking to trade with institutions, fade liquidity grabs, and capture high-probability short setups during the trading day. 📉🔥

London/NY Sessions [jpkxyz]London/NY Sessions Indicator Guide
This indicator tracks the forex market's most active trading periods: London session, New York session, and their overlap.
This characteristics of the London and New York trading sessions are well documented and many traders use them as a key element in their trading strategies. It is most relevant in forex trading, however it is to an extend also applicable in cryptocurrencies.
London Session (08:00-16:00 UTC)
Most active trading session (35% of daily forex volume)
Highest trading volume and liquidity
Major price movements and trend development
Significant institutional participation
New York Session (13:00-20:00 UTC)
Second most active trading period
High institutional order flow
Major US economic releases
Significant impact on USD pairs
London/New York Overlap (13:00-16:00 UTC)
The most active period in forex markets:
Maximum market liquidity
Highest daily trading volume
Strong price movements
Tightest spreads
Peak institutional activity
This indicator helps traders:
Visualize key trading sessions
Track session highs and lows
Monitor overlap dynamics
Identify potential support/resistance levels (session highs/lows)

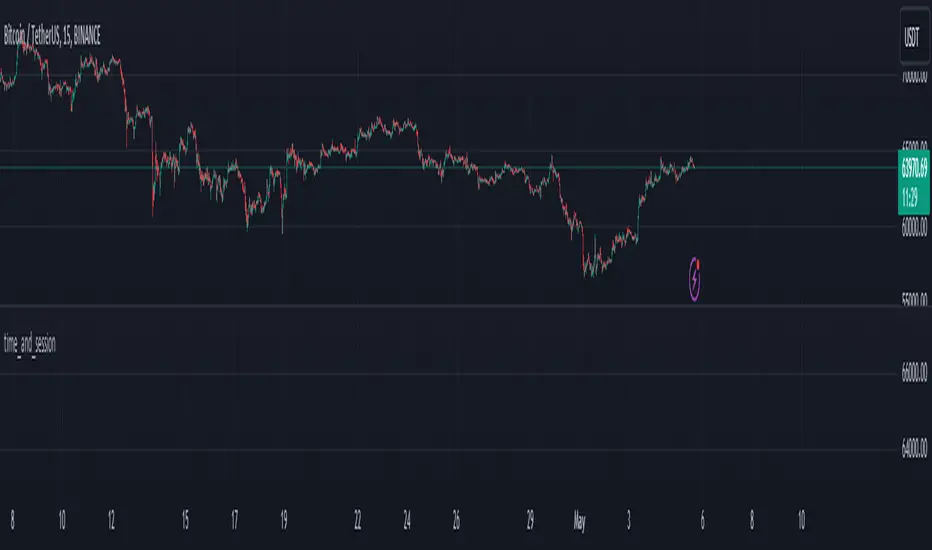
time_and_sessionA library that provides utilities for working with trading sessions and time-based conditions. Functions include session checks, date range checks, day-of-week matching, and session high/low calculations for daily, weekly, monthly, and yearly timeframes. This library streamlines time-related calculations and enhances time-based strategies and indicators.
Library "time_and_session"
Provides functions for checking time and session-based conditions and retrieving session-specific high and low values.
is_session(session, timeframe, timezone)
Checks if the current time is within the specified trading session
Parameters:
session (string) : The trading session, defined using input.session()
timeframe (string) : The timeframe to use, defaults to the current chart's timeframe
timezone (string) : The timezone to use, defaults to the symbol's timezone
Returns: A boolean indicating whether the current time is within the specified trading session
is_date_range(start_time, end_time)
Checks if the current time is within a specified date range
Parameters:
start_time (int) : The start time, defined using input.time()
end_time (int) : The end time, defined using input.time()
Returns: A boolean indicating whether the current time is within the specified date range
is_day_of_week(sunday, monday, tuesday, wednesday, thursday, friday, saturday)
Checks if the current day of the week matches any of the specified days
Parameters:
sunday (bool) : A boolean indicating whether to check for Sunday
monday (bool) : A boolean indicating whether to check for Monday
tuesday (bool) : A boolean indicating whether to check for Tuesday
wednesday (bool) : A boolean indicating whether to check for Wednesday
thursday (bool) : A boolean indicating whether to check for Thursday
friday (bool) : A boolean indicating whether to check for Friday
saturday (bool) : A boolean indicating whether to check for Saturday
Returns: A boolean indicating whether the current day of the week matches any of the specified days
daily_high(source)
Returns the highest value of the specified source during the current daily session
Parameters:
source (float) : The data series to evaluate, defaults to high
Returns: The highest value during the current daily session, or na if the timeframe is not suitable
daily_low(source)
Returns the lowest value of the specified source during the current daily session
Parameters:
source (float) : The data series to evaluate, defaults to low
Returns: The lowest value during the current daily session, or na if the timeframe is not suitable
regular_session_high(source, persist)
Returns the highest value of the specified source during the current regular trading session
Parameters:
source (float) : The data series to evaluate, defaults to high
persist (bool) : A boolean indicating whether to retain the last value outside of regular market hours, defaults to true
Returns: The highest value during the current regular trading session, or na if the timeframe is not suitable
regular_session_low(source, persist)
Returns the lowest value of the specified source during the current regular trading session
Parameters:
source (float) : The data series to evaluate, defaults to low
persist (bool) : A boolean indicating whether to retain the last value outside of regular market hours, defaults to true
Returns: The lowest value during the current regular trading session, or na if the timeframe is not suitable
premarket_session_high(source, persist)
Returns the highest value of the specified source during the current premarket trading session
Parameters:
source (float) : The data series to evaluate, defaults to high
persist (bool) : A boolean indicating whether to retain the last value outside of premarket hours, defaults to true
Returns: The highest value during the current premarket trading session, or na if the timeframe is not suitable
premarket_session_low(source, persist)
Returns the lowest value of the specified source during the current premarket trading session
Parameters:
source (float) : The data series to evaluate, defaults to low
persist (bool) : A boolean indicating whether to retain the last value outside of premarket hours, defaults to true
Returns: The lowest value during the current premarket trading session, or na if the timeframe is not suitable
postmarket_session_high(source, persist)
Returns the highest value of the specified source during the current postmarket trading session
Parameters:
source (float) : The data series to evaluate, defaults to high
persist (bool) : A boolean indicating whether to retain the last value outside of postmarket hours, defaults to true
Returns: The highest value during the current postmarket trading session, or na if the timeframe is not suitable
postmarket_session_low(source, persist)
Returns the lowest value of the specified source during the current postmarket trading session
Parameters:
source (float) : The data series to evaluate, defaults to low
persist (bool) : A boolean indicating whether to retain the last value outside of postmarket hours, defaults to true
Returns: The lowest value during the current postmarket trading session, or na if the timeframe is not suitable
weekly_high(source)
Returns the highest value of the specified source during the current weekly session. Can fail on lower timeframes.
Parameters:
source (float) : The data series to evaluate, defaults to high
Returns: The highest value during the current weekly session, or na if the timeframe is not suitable
weekly_low(source)
Returns the lowest value of the specified source during the current weekly session. Can fail on lower timeframes.
Parameters:
source (float) : The data series to evaluate, defaults to low
Returns: The lowest value during the current weekly session, or na if the timeframe is not suitable
monthly_high(source)
Returns the highest value of the specified source during the current monthly session. Can fail on lower timeframes.
Parameters:
source (float) : The data series to evaluate, defaults to high
Returns: The highest value during the current monthly session, or na if the timeframe is not suitable
monthly_low(source)
Returns the lowest value of the specified source during the current monthly session. Can fail on lower timeframes.
Parameters:
source (float) : The data series to evaluate, defaults to low
Returns: The lowest value during the current monthly session, or na if the timeframe is not suitable
yearly_high(source)
Returns the highest value of the specified source during the current yearly session. Can fail on lower timeframes.
Parameters:
source (float) : The data series to evaluate, defaults to high
Returns: The highest value during the current yearly session, or na if the timeframe is not suitable
yearly_low(source)
Returns the lowest value of the specified source during the current yearly session. Can fail on lower timeframes.
Parameters:
source (float) : The data series to evaluate, defaults to low
Returns: The lowest value during the current yearly session, or na if the timeframe is not suitable
Vanitati's Market Scope=========================================================
How to Use the Indicator
=========================================================
Configuration: Begin by setting the session times to match your trading interests. Customize the colors and styles according to your preferences.
Observation: Watch for the high and low markers of each session to form the initial balance. Note how the price moves in relation to these levels.
Action: Pay special attention to God Candles and engulfing patterns, especially when they coincide with high volume. These may offer trading signals in line with your strategy.
Adjustment: Regularly review and adjust the settings (e.g., session times, lookback periods) based on market conditions and your trading performance.
=========================================================
Initial Balance (IB) Settings:
=========================================================
Purpose: Marks the high and low of a specific trading session to indicate the initial range of market movement.
Usage: Customize session times for New York (NY), London (LN), and Tokyo (TK) to see the initial balance of each. Colors for the high, low, and mid-point lines can be adjusted.
Practical Application: Traders can use these lines to gauge market volatility or breakouts outside of these initial ranges.
=========================================================
Session Settings and Session Highlight Boxes
=========================================================
Purpose: Highlights trading sessions with customizable background colors and border styles, allowing for a quick visual reference of market sessions.
Usage: Set the times for NY, London, and Tokyo sessions along with desired background colors to have these periods visually marked on the chart.
Practical Application: Helps in identifying the overlap between major market sessions and potential increases in trading volume and volatility.
=========================================================
God Candle Settings
=========================================================
Purpose: Identifies significantly large and voluminous candles, known as "God Candles", which could signal strong market movements.
Usage: Adjust the lookback period, line length, and volume criteria to define what constitutes a God Candle. These settings also allow for the display of diamonds on bars that meet certain criteria but are not classified as God Candles.
Practical Application: These candles can signal strong buying or selling pressure and might be used as potential entry or exit points based on the trader's strategy.
=========================================================
Additional Features
=========================================================
Session Time Filters: Allows for filtering signals based on the time of day, useful for focusing on specific market hours.
Engulfing Pattern Detection: The script includes logic to identify bullish and bearish engulfing patterns, adding another layer of analysis for potential trading opportunities.
Volume Analysis: Incorporates volume into the analysis of God Candles and engulfing patterns to identify significant market movements.
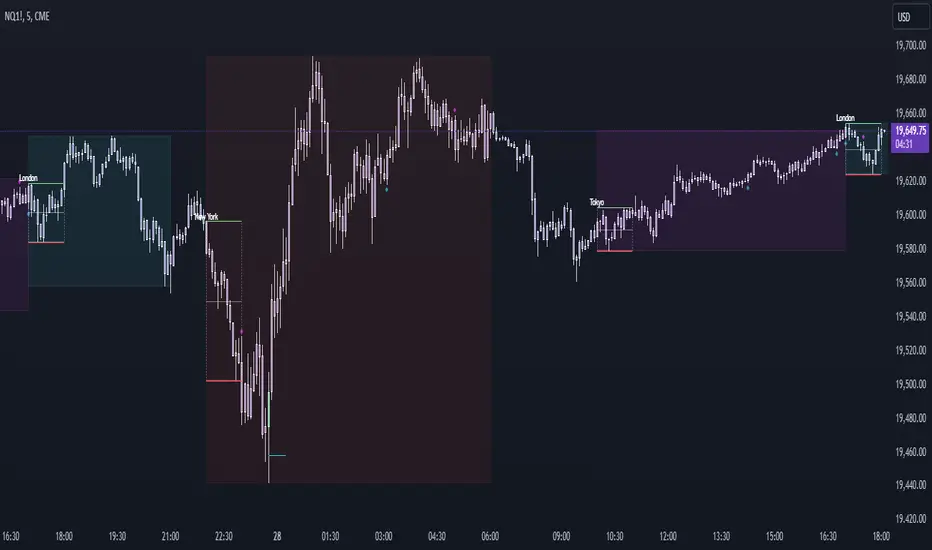
skThis Pine Script is an indicator designed to mark and highlight specific trading sessions on a TradingView chart. Here's a description of the script's functionality:
1. *Session Selection*: The script allows you to select a session time frame using the `session_input` input. The available options for session time frames are "D" (daily), "W" (weekly), "M" (monthly), "H" (hourly), "15" (15 minutes), "5" (5 minutes), and "1" (1 minute).
2. *Session Times*: You can specify the start and end times for three different trading sessions - CBDR (Central Bank Dealer Range), Asia, and London - using the corresponding input options. These times are specified in Indian Standard Time (IST).
3. *Time Calculation*: The script calculates the start and end times for each session based on the specified hours and minutes. It uses the `timestamp` function to create time objects for these sessions.
4. *Session Highlighting*: The script creates rectangles on the chart to highlight each session:
- CBDR Session: A gray rectangle is drawn during the CBDR session time.
- Asia Session: Another gray rectangle is drawn during the Asia session time.
- London Session: A green rectangle is drawn at the top of the chart during the London session time.
5. *Transparency*: The rectangles have a transparency level of 90%, allowing you to see the price data beneath them while still marking the sessions.
6. *Overlay*: The indicator is set to overlay on the price chart, so it doesn't obstruct the price data.
7. *Customization*: You can customize the session times and appearance by adjusting the input values in the settings panel of the indicator.
Overall, this script provides a visual way to identify and highlight specific trading sessions on your TradingView chart, helping traders understand price action in different market sessions.

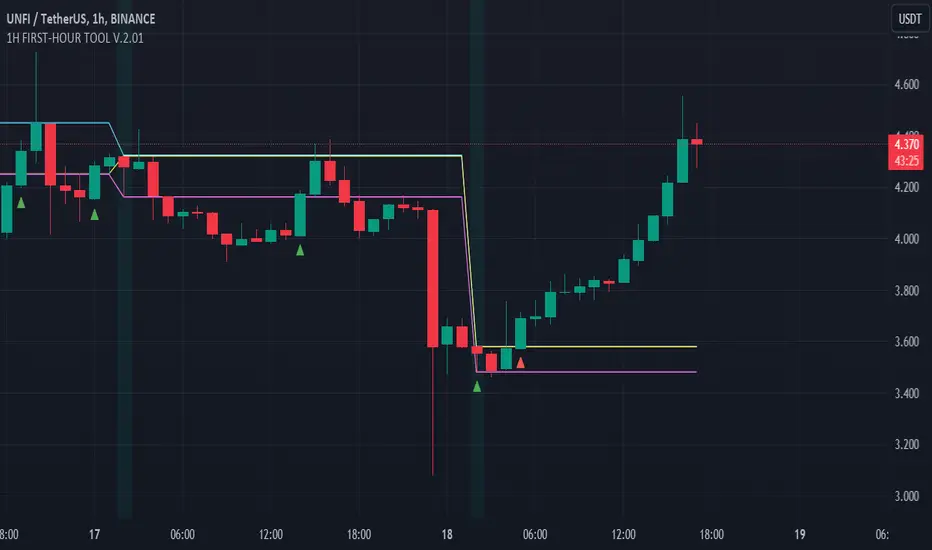
FIRST-HOUR TOOL V.1.8.08.23Three horizontal lines are drawn on the chart to represent session prices. These prices are calculated based on the user-specified session:
"FirstHour Session High" represents the highest price reached during the firsthour session.
"FirstHour Session Open" represents the opening price of the firsthour session
"FirstHour Session Low" represents the lowest price reached during the firsthour session.
These prices are respectively colored with light blue, light yellow, and light pink.
The chart background can change color based on whether the current time is within the specified session. If the current time is within the session, the background will be colored in semi-transparent aqua green. Otherwise, it will remain transparent.
Upward-pointing triangle markers are used to highlight points where the closing price crosses above (crossover) or below (crossunder) the session levels.
These markers appear below the corresponding bar.
They are colored based on the type of crossover:
Yellow for crossover above the "FirstHour High"
Red for crossover above the "FirstHour Open"
Green for crossover above the "FirstHour Low"
Alerts:
Alert messages are generated when crossovers or crossunders of the closing price relative to the session levels occur.
The alerts appear once per bar. Alerts are generated for the following events:
Crossover of the price above the "Session High" with the message "High First Hour Crossover."
Crossunder of the price below the "Session Open" with the message "Open First Hour Crossunder."
Crossunder of the price below the "Session Low" with the message "Low First Hour Crossunder."
Crossover of the price above the "Session Low" with the message "Low First Hour Crossover."
In summary, this indicator provides a visual representation of session prices and events, helping traders spot significant crossovers and crossunders relative to key price levels.
Author @tumiza999
ICT Sessions_One Setup for Life [MK]The script plots the High/Low of the following trading sessions:
London - 02:00-05:00
NY AM - 09:30-12:00
New York Lunch - 12:00-13:30
New York PM - 13:30-16:00
Due to the high level of liquidity (resting orders), highs and lows of these sessions may be used as buy/sell areas and also as profit target areas. Typically, buy orders would be initiated below a session low and sell orders would be initiated above a
session high.
The script also plots 'RTH (Regular Trading Hours) Opening Gaps'. The RTH gaps are drawn from the closing price of regular trading at 16:15 (EST) to the open price of regular trading at 09:30 (EST). Gaps can be areas that traders might anticipate to be filled at some time in the future. A gap 'midline' is available if needed and yesterday RTH close line can be shown and extended to the current bar.
This script is simply a means to draw boxes around certain areas/periods on the charts. It is in no way a trading strategy and users should spend much time to study the concept and should also perform extensive back-testing before taking any trades.
By setting the lookback value to a much higher value then the default of 6, users can utilise the script to perform their own backtesting studies.
The above chart shows the default setup of the indicator. Note that the user has to choose how far (in days) to lookback and draw the sessions/gaps.
It is also possible to show the session high//low lines and extend them to the current bar time. If this is used it is advised to keep the lookback period as low as possible to ensure charts stay clean/uncluttered.
All boxes/lines styles/colors are fully customisable.

Take Session High/Low Alert [MsF]Japanese below / 日本語説明は英文の後にあります。
-------------------------
This indicator that displays High/Low lines for each session. The Key Levels of each session can be visually recognized, which is useful for PD Array analysis. You can display the last 3 days. Based on trinity by ICT.
The biggest feature is that the color shape of the line changes when reaching High/Low. Of course, you can also set alerts.
Unreached High/Low lines can be extended to the right. hides all timeframes over 1 hour. (alert is alive)
You can choose 4 sessions. If you only want to use 3 sessions, you can do that by setting the same session time for 2 of the 4 session settings.
About Parameter Settings
Session Time: Please set it to be a 24-hour cycle. You can also specify the time zone. The default is NY time.
Basis/Other color: The first time specified in "Session Time" in this indicator's parameter is the "Basis color". "Other color" is a line other than that.
Enable Time Lines: You can turn on/off the display of vertical lines.
High/Low color: High/Low line setting that has not been reached.
Taken color: High/Low line setting that has already been reached.
Extend Lines: Allows unreached High/Low lines to be extended to the right in the chart.
-------------------------
セッションごとのHigh/Lowをライン表示するインジケーターです。
過去約3日分を表示することができます。
最大の特徴はHigh/Low到達時にラインの色形が変わることです。もちろんアラート設定も可能です。
未到達のHigh/Lowラインは右側に延長することができます。
チャート表示がビジーとなる為、1時間を超える時間足ではすべて非表示とする仕様です。(アラートは生きてます)
セッションは4つ指定できます。
もしセッションを3つのみ使用したい場合は、4つのセッション設定の内2つに同じセッション時間を設定することで実現可能です。
■パラメータ設定
Session Time:24時間周期となるように設定してください。またタイムゾーンが指定できます。デフォルトはNY timeです。
Basis/Other color:パラメータの"Session Time"にて一番最初に指定した時間が基準=Basisとなります。Otherはそれ以外のラインとなります。
Enable Time Lines:垂直ラインの表示ON/OFFが可能です。
High/Low color:未到達のHigh/Lowライン設定となります。
Taken color:到達済みのHigh/Lowライン設定となります。
Extend Lines:未到達のHigh/Lowラインを右に延長できます。

Asia & London Session High/Low Description:
This indicator plots the highest and lowest points of the Asian and London trading sessions based on Eastern Time (ET).
Features:
Draws horizontal rays for session highs and lows
Automatically resets for each session
Perfect for I CT-style liquidity analysis , range breaks , and session-based trading setups
Clean chart : no labels or clutter, just the key session levels
Use it to identify liquidity zones , plan entries , and anticipate potential session raids in your trading strategy.

CVD Flow Labels for Sessions Ranges [AMT Edition]CVD Flow Labels for Session Ranges
Description:
This script provides a session-aware Cumulative Volume Delta (CVD) analysis designed to enhance the “Session Ranges ” framework by combining price extremes with detailed volume flow dynamics. Unlike generic trend or scalping indicators, this tool focuses on identifying aggressive buying and selling pressure, distinguishing between absorption (failed auctions where aggressive flows are rejected) and acceptance (confirmed continuation of flows).
How it works:
CVD Calculation: The script calculates delta for each bar using a choice of Total, Periodic, or EMA-based cumulative methods. Delta represents the net difference between estimated buying and selling volume per bar.
Normalization: By normalizing delta relative to recent volatility, it highlights extreme flows that are statistically significant, making large shifts in market sentiment easier to spot.
Session-Specific Analysis: The indicator separates Asia, London, and New York sessions to allow context-sensitive interpretation of price and volume interactions. Each session’s extremes are monitored, and flow labels are plotted relative to these extremes.
Flow Labels: Bullish and bearish absorption (“ABS”) and acceptance (“ACC WEAK/STRONG”) labels provide immediate visual cues about whether aggressive flows are being absorbed or accepted at key price levels.
Alerts: Configurable alerts trigger when absorption or acceptance occurs, supporting active trading or strategy automation.
Originality & Usefulness:
This script is original because it integrates volume-based auction theory with session-specific market structure, rather than simply showing trend or scalping signals. By combining CVD dynamics with session extreme levels from the “Session Ranges ” script, traders can:
Identify where price is likely to be accepted or rejected.
Confirm aggressive buying or selling flows before entering trades.
Time entries near session extremes with higher probability setups.
How to use:
Apply the “Session Ranges ” to see session highs, lows, and interaction lines.
Use this CVD Flow Labels script to visualize absorption and acceptance at these session levels.
Enter trades based on alignment of session extremes and flow signals:
Absorption at a session extreme may indicate a potential reversal.
Acceptance suggests continuation in the direction of the flow.
Alerts can help manage trades without constant screen monitoring.
This tool is designed to give traders a structured, session-based view of market auctions, providing actionable insights that go beyond typical trend-following or scalping methods. It emphasizes flow analysis and statistical extremes, enabling traders to make more informed decisions grounded in market microstructure.

Custom Psych Levels V1.0 Theo SignalDesigned for Index Traders (US30, NAS100, SPX, etc.)
This script is especially effective on indices such as US30, where price reacts strongly to round numbers and psychological zones. By default, levels adapt to index volatility and scale, making them ideal for:
intraday bias
pullback reactions
breakout continuation
mean reversion back to balance
Key Features
Rolling 5-Level Structure: Always centered on current price, no chart clutter.
Market- Aware Magnitude: Automatically adjusts spacing for indices, forex, and crypto.
Higher- Timeframe Anchoring: Optionally anchor levels to 1H, 4H, or Daily closes while trading lower timeframes like 5m.
Session & Daily Resets: Re-anchor levels at New York session open or new trading day.
Center Line Emphasis: Highlight the equilibrium level with custom color, thickness, and style for balance or decision-making.
Clean Professional Display: Only relevant levels near price are shown.
Trading Use Cases
This indicator is best used as a framework, not a signal generator. It excels when combined with:
momentum confirmation
liquidity sweeps
volume expansion
break-and-retest structures
session highs/lows
Traders can use the center line as balance, outer levels as reaction or target zones, and band shifts as confirmation of expanding price acceptance.

ICT Asian Range |MC|ICT Asian Range |MC| Indicator
💎 Overview 💎
Automatically highlights the Asian trading session on the chart with session High, Low, Midline, and a shaded box. Shows both current and previous sessions for quick reference.
Range Definition: Identify the highest and lowest prices during this session
Trading Setup: Use the defined range to anticipate future breakouts or liquidity sweeps
💎 Key Inputs 💎
ICT Session Range Time: 7:00pm – 0:00am EST (default, 👉 customizable)
Label Text customizable: e.g. “ASIA RANGE”
Line Colors: High/Low (customizable)
Line Style & Width:(customizable)
Midline: optional, calculated as session average
Box Color: (customizable)
Extension: how far lines extend into the future (customizable)
Happy Trading!

Weekend Asia High/Low Dots + Trading Window (UTC+1)**Weekend Asia High/Low Dots & Trading Window** is a lightweight TradingView indicator designed to **mark the exact Asia session extremes on weekends (Saturday & Sunday)** and highlight predefined **trading time windows** with maximum clarity and minimal chart clutter.
The indicator focuses on **precision, simplicity, and manual trading workflows**.
---
### 🔍 Key Features
#### 🟢 Asia Session High & Low (Weekend Only)
* Tracks the **Asia session on Saturday and Sunday**
* Marks **exactly two points per session**:
* One dot at the **true wick high**
* One dot at the **true wick low**
* Dots are plotted **only once**, at the **end of the Asia session**
* **No lines, no boxes, no extensions** – just clean reference points
* Ideal for traders who prefer to **draw their own ranges manually**
#### 🟩 Trading Window Highlight
* Customizable **trading time windows** for Saturday and Sunday
* Displayed as a **clean outline box** (no background fill)
* Helps visually separate **range formation** from **active trading hours**
---
### ⏰ Time Handling
* All session times are defined in **UTC+1**
* Uses a **fixed UTC+1 timezone** (`Etc/GMT-1`) for consistent behavior
* Easily adjustable to other timezones if needed
---
### ⚙️ Customizable Inputs
* Asia session times (Saturday & Sunday)
* Trading session times (Saturday & Sunday)
* Optional trading window labels
* Easy point size adjustment directly in the code
---
### 🎯 Use Cases
* Weekend trading (Crypto, Indices, Synthetic markets)
* Asia range analysis
* Manual range drawing & breakout planning
* Clean, distraction-free chart layouts
---
### 🧠 Who Is This Indicator For?
* Price action traders
* Range & session-based traders
* Traders who prefer **manual chart markup**
* Anyone trading **weekends with structured time windows**
---
### 🛠 Technical Details
* Pine Script® **Version 6**
* Overlay indicator
* Optimized for clarity and performance
---
If you want, I can also provide:
* a **short description** (1–2 lines for the TradingView header)
* **tags & keywords** for better discoverability
* or a **version with user-adjustable dot size via Inputs**

Session Fibonacci Tracker with Dynamic Range FreezeSession Fibonacci Tracker with Dynamic Range Freeze
This indicator plots Fibonacci retracement and extension levels based on session high/low ranges with a unique "freeze" mechanism that locks levels during volatility and recalculates only when price returns to the established range.
How It Works:
The indicator uses a three-stage process to maintain stable Fibonacci levels:
Range Establishment: At the start of each session (default 1800 ET), the indicator tracks the session high and low. Fibonacci levels are calculated with dynamic anchoring - when price is above the session open, 0 anchors at the high with 1 at the low; when below, 0 anchors at the low with 1 at the high.
Freeze Mechanism: Once the range is established, it immediately freezes. If a candle closes outside this range, the Fibonacci levels remain locked at their current values even as new session highs or lows form. This prevents levels from constantly recalculating during trending moves.
Recalculation: The frozen range only updates when price action (high or low) touches back inside the established range. At this point, levels recalculate based on the current session high/low, then freeze again.
Key Features:
Customizable Fibonacci levels: All retracement (0.236, 0.382, 0.500, 0.618, 0.786) and extension levels (-1.0, -0.618, -0.272, 1.272, 1.618, 2.0) can be enabled/disabled and adjusted to custom values
Time-based line extension prevents historical buffer overflow errors
Works across all timeframes
Session start time fully customizable
Visual status indicator shows whether levels are frozen or active
All lines and labels are fully customizable (colors, width, labels, prices)
Use Cases:
This indicator is particularly useful for traders who want stable reference levels during volatile periods. Traditional Fibonacci tools recalculate with every new extreme, making them difficult to use as support/resistance during trends. This implementation keeps levels stable until price returns to consolidation, providing consistent reference points for entries, exits, and stop placement.
Settings:
Session Settings: Configure session start time (default 1800 ET)
Fibonacci Levels: Enable/disable and customize each retracement level value
Extension Levels: Enable/disable and customize each extension level value
Visual Settings: Adjust line extension, width, labels, and price display
Colors: Customize colors for open line, 0 level, 1 level, retracements, and extensions


Quantrader📊 Overview
This custom indicator combines intraday session analysis with multi-timeframe trend confirmation to identify high-probability trading opportunities. It features:
Custom intraday session tracking (GMT+7 timezone)
Multi-level moving average confluence (SMA 20, 100, 200)
Bollinger Bands mean reversion signals
Key intraday reference levels
⚙️ Core Components
1. Custom Intraday Session Tracking
Session Start: 7:00 AM GMT+7 (Vietnamese market open)
Calculates per session:
Intraday High/Low (resets at 7:00 AM daily)
Intraday Midline = (Session High + Session Low) / 2
Pre-Day Center = Previous day's midline (carried forward)
Open Day = First 15-minute candle's open price
2. Trend Analysis Framework
SMA 20 (Short-term momentum)
SMA 100 (Medium-term trend)
SMA 200 (Long-term trend direction)
Bollinger Bands (20-period, 2 standard deviations)
3. Signal Detection Logic
Bullish Mean Reversion Setup:
javascript
Condition 1: Green candle closes ABOVE Upper Bollinger Band
Condition 2: Following candle is ALSO green
→ Triggers: Green highlight + Triangle below bar
Bearish Mean Reversion Setup:
javascript
Condition 1: Red candle closes BELOW Lower Bollinger Band
Condition 2: Following candle is ALSO red
→ Triggers: Red highlight + Triangle above bar
🎯 Visual Elements
Element Color Description
Intraday Midline Blue Real-time session midpoint
Pre-Day Center Yellow Yesterday's midline (reference)
Open Day Purple (dashed) Day's opening price
SMA 20 Red Short-term trend
SMA 100 Green Medium-term trend
SMA 200 Orange Long-term trend
Bollinger Bands Red/Green/Blue Volatility boundaries
Bull Signal Green triangle ↓ Oversold bounce potential
Bear Signal Red triangle ↑ Overbought rejection potential
📈 Trading Applications
1. Trend Confirmation
Bullish Alignment: Price > All SMAs + Above Intraday Midline
Bearish Alignment: Price < All SMAs + Below Intraday Midline
2. Mean Reversion Opportunities
Overbought Scenario: Consecutive green candles above Upper BB → Potential reversal
Oversold Scenario: Consecutive red candles below Lower BB → Potential bounce
3. Intraday Level Trading
Intraday Midline: Dynamic support/resistance
Pre-Day Center: Psychological reference level
Open Day: Key opening price level
⚡ Key Features
Automatic Session Reset: Daily at 7:00 AM GMT+7
Multi-Timeframe Confluence: Combines intraday, daily, and trend analysis
Clean Visual Design: Non-cluttered, focused on key levels
Real-Time Calculation: All levels update with each new candle
🛠️ Recommended Settings
Timeframe: 15-minute to 1-hour charts
Markets: Forex, Indices, Commodities
Best Pairs: EURUSD, XAUUSD, VN30, USDJPY
Trading Style: Swing trading, Day trading
📖 Usage Tips
Trend Trading: Enter in direction of SMA alignment (20 > 100 > 200 for bullish)
Mean Reversion: Use BB signals at key intraday levels (Midline, Pre-Day Center)
Confirmation: Wait for candle close above/below key levels
Risk Management: Place stops beyond opposite intraday extreme
🎨 Customization Options
Users can modify:
Session start time (line 6)
Bollinger Band parameters (length, multiplier)
SMA periods
Color schemes

RCV Essentials════════════════════════════════════════════
RCV ESSENTIALS - MULTI-TIMEFRAME & SESSION ANALYSIS TOOL
════════════════════════════════════════════
📊 WHAT THIS INDICATOR DOES
This professional-grade indicator combines two powerful analysis modules:
1. TRADING SESSION TRACKER - Visualizes high/low ranges for major global market sessions (NY Open, London Open, Asian Session, etc.)
2. MULTI-TIMEFRAME CANDLE DISPLAY - Shows up to 8 higher timeframes simultaneously on your chart (15m, 30m, 1H, 4H, 1D, 1W, 1M, 3M)
════════════════════════════════════════════
🎯 KEY FEATURES
════════════════════════════════════════════
TRADING SESSIONS MODULE:
✓ Track up to 6 custom trading sessions simultaneously
✓ Real-time high/low range detection during active sessions
✓ Pre-configured for NYO (7-9am), LNO (2-3am), Asian Session (4:30pm-12am)
✓ 60+ global timezone options
✓ Customizable colors, labels, and transparency
✓ Daily divider lines (optional Sunday skip for traditional markets)
✓ Only displays on ≤30m timeframes for optimal clarity
MULTI-TIMEFRAME CANDLES MODULE:
✓ Display 1-8 higher timeframes with up to 10 candles each
✓ Real-time candle updates (non-repainting)
✓ Fully customizable colors (separate bullish/bearish for body/border/wick)
✓ Adjustable candle width, spacing, and positioning
✓ Smart label system (top/bottom/both, aligned or follow candles)
✓ Automatic timeframe validation (only shows TFs higher than chart)
✓ Memory-optimized with automatic cleanup
════════════════════════════════════════════
🔧 HOW IT WORKS
════════════════════════════════════════════
TECHNICAL IMPLEMENTATION:
Session Tracking Algorithm:
• Detects session start/end using time() function with timezone support
• Continuously monitors and updates high/low during active session
• Finalizes range when session ends using var persistence
• Draws boxes using real-time bar_index positioning
• Maintains session ranges across multiple days for reference
Multi-Timeframe System:
• Uses ta.change(time()) detection to identify new MTF candle formation
• Constructs candles using custom Type definitions (Candle, CandleSet, Config)
• Stores OHLC data in arrays with automatic size management
• Renders using box objects (bodies) and line objects (wicks)
• Updates current candle every tick; historical candles remain static
• Calculates dynamic positioning based on user settings (offset, spacing, width)
Object-Oriented Architecture:
• Custom Type "Candle" - Stores OHLC values, timestamps, visual elements
• Custom Type "CandleSet" - Manages arrays of candles + settings per timeframe
• Custom Type "Config" - Centralizes all display configuration
• Efficient memory management via unshift() for new candles, pop() for old
Performance Optimizations:
• var declarations minimize recalculation overhead
• Conditional execution (sessions only on short timeframes)
• Maximum display limits prevent excessive object creation
• Timeframe validation at barstate.isfirst reduces redundant checks
════════════════════════════════════════════
📈 HOW TO USE
════════════════════════════════════════════
SETUP:
1. Add indicator to chart (works best on 1m-30m timeframes)
2. Open Settings → "Trading Sessions" group
- Enable desired sessions (NYO, LNO, AS, or custom)
- Select your timezone from 60+ options
- Adjust colors and transparency
3. Open Settings → "Multi-TF Candles" group
- Enable timeframes (TF1-TF8)
- Configure each timeframe and display count
- Customize colors and layout
READING THE CHART:
• Session boxes show high/low ranges during active sessions
• MTF candles display to the right of current price
• Labels identify each timeframe (15m, 1H, 4H, etc.)
• Real-time updates on the most recent MTF candle
TRADING APPLICATIONS:
Session Breakout Strategy:
→ Identify session high/low (e.g., Asian session 16:30-00:00)
→ Wait for break above/below range
→ Confirm with higher timeframe candle close
→ Enter in breakout direction, stop at opposite side of range
Multi-Timeframe Confirmation:
→ Spot setup on primary chart (e.g., 5m)
→ Verify 15m, 1H, 4H candles align with trade direction
→ Only take trades where higher TFs confirm
→ Exit when higher TF candles show reversal
Combined Session + MTF:
→ Asian session establishes range overnight
→ London Open breaks Asian high
→ Confirm with bullish 15m + 1H candles
→ Enter long with stop below Asian high
════════════════════════════════════════════
🎨 ORIGINALITY & INNOVATION
════════════════════════════════════════════
What makes this indicator original:
1. INTEGRATED DUAL-MODULE DESIGN
Unlike separate session or MTF indicators, this combines both in a single performance-optimized script, enabling powerful correlation analysis between session behavior and timeframe structure.
2. ADVANCED RENDERING SYSTEM
Uses custom Pine Script v5 Types with dynamic box/line object management instead of basic plot functions. This enables:
• Precise visual control over positioning and spacing
• Real-time updates without repainting
• Efficient memory handling via automatic cleanup
• Support for 8 simultaneous timeframes with independent settings
3. INTELLIGENT SESSION TRACKING
The algorithm continuously recalculates ranges bar-by-bar during active sessions, then preserves the final range. This differs from static zone indicators that simply draw fixed boxes at predefined levels.
4. MODULAR ARCHITECTURE
Custom Type definitions (Candle, CandleSet, Config) create extensible, maintainable code structure while supporting complex multi-timeframe operations with minimal performance impact.
5. PROFESSIONAL FLEXIBILITY
Extensive customization: 6 configurable sessions, 8 timeframe slots, 60+ timezones, granular color/sizing/spacing controls, multiple label positioning modes—adaptable to any market or trading style.
6. SMART VISUAL DESIGN
Automatic timeframe validation, dynamic label alignment options, and intelligent spacing calculations ensure clarity even with multiple timeframes displayed simultaneously.
════════════════════════════════════════════
⚙️ CONFIGURATION OPTIONS
════════════════════════════════════════════
TRADING SESSIONS:
• Session 1-6: On/Off toggles
• Time Ranges: Custom start-end times
• Labels: Custom text for each session
• Colors: Individual color per session
• Timezone: 60+ options (Americas, Europe, Asia, Pacific, Africa)
• Range Transparency: 0-100%
• Outline: Optional border
• Label Display: Show/hide session names
• Daily Divider: Dotted lines at day changes
• Skip Sunday: For traditional markets vs 24/7 crypto
MULTI-TF CANDLES:
• Timeframes 1-8: Enable/disable individually
• Timeframe Selection: Any TF (seconds to months)
• Display Count: 1-10 candles per timeframe
• Bullish Colors: Body/Border/Wick (independent)
• Bearish Colors: Body/Border/Wick (independent)
• Candle Width: 1-10+ bars
• Right Margin: 0-200+ bars from edge
• TF Spacing: Gap between timeframe groups
• Label Color: Any color
• Label Size: Tiny/Small/Normal/Large/Huge
• Label Position: Top/Bottom/Both
• Label Alignment: Follow Candles or Align
════════════════════════════════════════════
📋 TECHNICAL SPECIFICATIONS
════════════════════════════════════════════
• Pine Script Version: v5
• Chart Overlay: True
• Max Boxes: 500
• Max Lines: 500
• Max Labels: 500
• Max Bars Back: 5000
• Update Frequency: Real-time (every tick)
• Timeframe Compatibility: Chart TF must be lower than selected MTFs
• Session Display: Activates only on ≤30 minute timeframes
• Memory Management: Automatic cleanup via array operations

Session Range Boxes GR v2.1This indicator draws intraday range boxes for the main Forex sessions based on Europe/Budapest time (CET/CEST).
Tracked sessions (Budapest time):
Asia: 01:00 – 08:00
Frankfurt (pre-London): 08:00 – 09:00
London: 09:00 – 18:00
New York: 14:30 – 23:00
For each session, the script:
Detects the session start and session end using the current chart timeframe and the Europe/Budapest time zone.
Tracks the high and low of price during the session.
Draws a colored box from session open to session close, covering the full price range between the session high and low.
Draws a white midline inside every box at the midpoint between the session high and low (and keeps it visible for all past sessions).
Optionally plots a small label (“Asia”, “Fra”, “London”, “NY”) above the first bar of each session.
Color scheme:
Asia: soft orange box
Frankfurt: light aqua box
London: darker blue box
New York: light lime box
Use this tool to:
Quickly see which session created the high or low of the day,
Highlight important liquidity zones and prior session ranges that price may revisit,
Visually separate Asia, Frankfurt, London and New York volatility profiles on intraday charts.
Optimized for intraday trading (Forex / indices), but it works on any symbol where session behavior and time-of-day structure matter.

Session Breakout, Retest, Reversal + Large Move Alert## **Session Breakout, Retest, Reversal + Large Move Alert**
### Overview
A powerful multi-functional indicator designed for day traders and futures traders to identify session-based breakout opportunities, retest confirmations, and significant price movements across all futures contracts (Gold, E-mini S&P 500, Nasdaq, Crude Oil, and more).
### Key Features
**📊 Pre-Market Session Tracking**
- Automatically calculates pre-market/overnight session highs and lows
- Displays session ranges with customizable colors and styling
- Extends lines through the entire trading session for easy reference
- Supports overnight sessions (e.g., 4 PM – 7:30 AM for Gold futures)
**🚀 Breakout Detection**
- Identifies breakouts above/below pre-market highs and lows
- Uses close-price confirmation to filter false signals from wicks
- Displays "BO ↑" and "BO ↓" labels at breakout points
- Generates instant alerts when breakouts occur
**♻️ Retest Failed Tracking**
- Monitors price retests after breakouts
- Detects when retests fail to reach previous support/resistance
- Labels "RF" (Retest Failed) for high-probability trade setups
- Helps identify reversal opportunities
**📈 First 5-Minute Analysis**
- Captures first 5 minutes of market open (customizable timeframe)
- Tracks first 5-minute highs and lows separately
- Essential for mean-reversion and breakout confirmation strategies
- Blue lines extend through the trading session for easy tracking
**⚡ Large Move Alerts**
- Detects significant price movements based on point thresholds
- Individual thresholds for 5+ different symbols:
- GC (Gold): 15 points
- ES (E-mini S&P 500): 15 points
- NQ (E-mini Nasdaq): 50 points
- CL (Crude Oil): 1.5 points
- Custom: Fully adjustable
- Auto-detects symbol from chart ticker
- Labels show exact point movement and candle direction
### Customization Options
**Symbol Configuration**
- **Auto-Mode**: Automatically detects trading symbol from chart ticker
- **Manual-Mode**: Select specific symbol (GC, ES, NQ, CL, or Custom)
**Session Settings**
- Fully customizable pre-market session time (24-hour format)
- Adjustable market open time for first 5-minute window
- Market close hour and minute configuration
- Support for any timezone
**Point Move Thresholds by Symbol**
- Set independent thresholds for each of your trading symbols
- Quickly adjust settings when switching between different futures
- Includes helpful tooltips for recommended values
**Display & Styling**
- Toggle all visual elements on/off individually
- Customizable colors for all lines and labels:
- Pre-market high/low colors
- Breakout labels (up/down)
- Retest failed labels
- First 5-minute session lines
- Large move indicators
- Text size options: tiny, small, normal, large, huge
### How It Works
1. **Session Tracking**: The indicator identifies your pre-market session and marks the high and low with labeled lines (PH/PL)
2. **Breakout Signal**: Once the market opens, it monitors for close prices above/below the pre-market levels and alerts you with "BO ↑" or "BO ↓"
3. **Retest Confirmation**: After a breakout, it tracks retests and labels "RF" when the retest fails to reach the opposite extreme, confirming trade direction
4. **Large Move Detection**: Simultaneously monitors for significant point moves that exceed your symbol-specific thresholds
5. **Alert Triggers**: Get real-time alerts for:
- Breakout Up/Down
- Any Breakout
- Large Move events
### Alert Conditions
The indicator includes four alert conditions:
- **Breakout Up Alert**: Price closes above pre-market high
- **Breakout Down Alert**: Price closes below pre-market low
- **Any Breakout Alert**: Either breakout condition triggers
- **Large Move Alert**: Point movement exceeds threshold for current symbol
### Ideal For
- ✅ Day traders (breakout/retest strategies)
- ✅ Futures traders (Gold, Oil, Stock Index Contracts)
- ✅ Intraday scalpers (first 5-minute analysis)
- ✅ Swing traders (session-based levels)
- ✅ Multi-symbol traders (independent thresholds per symbol)
### Disclaimer
This indicator is designed for educational and informational purposes. Past performance does not guarantee future results. Always use proper risk management and position sizing. Test thoroughly on historical data before trading live.
