Multipower Entry SecretMultipower Entry Secret indicator is designed to be the ultimate trading companion for traders of all skill levels—especially those who struggle with decision-making due to unclear or overwhelming signals. Unlike conventional trading systems cluttered with too many lines and confusing alerts, this indicator provides a clear, adaptive, and actionable guide for market entries and exits.
Key Points:
Clear Buy/Sell/Wait Signals:
The script dynamically analyzes price action, candle patterns, volume, trend strength, and higher time frame context. This means it gives you “Buy,” “Sell,” or “Wait” signals based on real, meaningful market information—filtering out the noise and weak trades.
Multi-Timeframe Adaptive Analysis:
It synchronizes signals between higher and current timeframes, ensuring you get the most reliable direction—reducing the risk of getting caught in fake moves or sudden reversals.
Automatic Support, Resistance & Liquidity Zones:
Key levels like support, resistance, and liquidity zones are auto-detected and displayed directly on the chart, helping you make precise decisions without manual drawing.
Real-Time Dashboard:
All relevant information, such as trend strength, market intent, volume sentiment, and the reason behind each signal, is neatly summarized in a dashboard—making monitoring effortless and intuitive.
Customizable & Beginner-Friendly:
Whether you’re a newcomer wanting straightforward guidance or a professional needing advanced customization, the indicator offers flexible options to adjust analysis depth, timeframes, sensitivity, and more.
Visual & Clutter-Free:
The design ensures that your chart remains clean and readable, showing only the most important information. This minimizes mental overload and allows for instant decision-making.
Who Will Benefit?
Beginners who want to learn trading logic, avoid common traps, and see the exact reason behind every signal.
Advanced traders who require adaptive multi-timeframe analytics, fast execution, and stress-free monitoring.
Anyone who wants to save screen time, reduce analysis paralysis, and have more confidence in every trade they take.
1. No Indicator Clutter
Intent:
Many traders get confused by charts filled with too many indicators and signals. This often leads to hesitation, missed trades, or taking random, risky trades.
In this Indicator:
You get a clean and clutter-free chart. Only the most important buy/sell/wait signals and relevant support/resistance/liquidity levels are shown. These update automatically, removing the “overload” and keeping your focus sharp, so your decision-making is faster and stress-free.
2. Exact Entry Guide
Intent:
Traders often struggle with entry timing, leading to FOMO (fear of missing out) or getting trapped in sudden market reversals.
In this Indicator:
The system uses powerful adaptive logic to filter out weak signals and only highlight the strongest market moves. This not only prevents you from entering late or on noise, but also helps avoid losses from false breakouts or whipsaws. You get actionable suggestions—when to enter, when to hold back—so your entries are high-conviction and disciplined.
3. HTF+LTF Logic: Multitimeframe Sync Analysis
Intent:
Most losing trades happen when you act only on the short-term chart, ignoring the bigger market trend.
In this Indicator:
Signals are based on both the current chart timeframe (LTF) and a higher (HTF, like hourly/daily) timeframe. The indicator synchronizes trend direction, momentum, and structure across both levels, quickly adapting to show you when both are aligned. This filtering results in “only trade with the bigger trend”—dramatically increasing your win rate and market confidence.
4. Auto Support/Resistance & Liquidity Zones
Intent:
Drawing support/resistance and liquidity zones manually is time-consuming and error-prone, especially for beginners.
In this Indicator:
The system automatically identifies and plots the most crucial support/resistance levels and liquidity zones on your chart. This is based on adaptive, real-time price and volume analysis. These zones highlight where major institutional activity, trap setups, or real breakouts/reversals are most likely, removing guesswork and giving you a clear reference for entries, exits, and stop placements.
5. Clear Action/Direction
Intent:
Traders need certainty—what does the market want right now? Most indicators are vague.
In this Indicator:
Your dashboard always displays in plain words (like “BUY”, “SELL”, or “WAIT”) what action makes sense in the current market phase. Whether it’s a bull trap, volume spike, wick reversal, or exhaustion—it’s interpreted and explained clearly. No more confusion—just direct, real-time advice.
6. For Everyone (Beginner to Pro)
Intent:
Most advanced indicators are overwhelming for new traders; simple ones lack depth for professionals.
In this Indicator:
It is simple enough for a beginner—just add it to the chart and instantly see what action to consider. At the same time, it includes advanced adaptive analysis, multi-timeframe logic, and customizable settings so professional traders can fine-tune it for their strategies.
7. Ideal Usage and User Benefits
Instant Decision Support:
Whenever you’re unsure about a trade, just look at the indicator’s suggestion for clarity.
Entry Learning:
Beginners get real-time “practice” by not only seeing signals, but also the reason behind them—improving your chart reading and market understanding.
Screen Time & Stress Reduction:
Clear, relevant information only; no noise, less fatigue, faster decisions.
Makes Trading Confident & Simple:
The smart dashboard splits actionable levels (HTF, LTF, action) so you never miss a move, avoid traps, and stay aligned with high-probability trades.
8. Advanced Input Settings (Smart Customization)
Explained with Examples:
Enable Wick Analysis:
Finds candles with strong upper/lower wicks (signs of rejection/buying/selling force), alerting you to hidden reversals and protecting from FOMO entries.
Enable Absorption:
Detects when heavy order flow from one side is “absorbed” by the other (shows where institutional buyers/sellers are likely active, helps spot fake breakouts).
Enable Unusual Breakout:
Highlights real breakouts—large volatility plus high volume—so you catch genuine moves and avoid random spikes.
Enable Range/Expansion:
Smartly flags sudden range expansions—when the market goes from quiet to volatile—so you can act at the start of real trends.
Trend Bar Lookback:
Adjusts how many bars/candles are used in trend calculations. Short (fast trades, more signals), long (more reliability, fewer whipsaws).
Bull/Bear Bars for Strong Trend Min:
Sets how many candles in a row must support a trend before calling it “strong”—prevents flipping signals, keeps you disciplined.
Volume MA Length:
Lets you adjust how many bars back volume is averaged—fine-tune for your asset and trading style for best volume signals.
Swing Lookback Bars:
Set how many bars to use for swing high/low detection—short (quick swing levels), long (stronger support/resistance).
HTF (Bias Window):
Decide which higher timeframe the indicator should use for big-picture market mood. Adjustable for any style (scalp, swing, position).
Adaptive Lookback (HTF):
Choose how much HTF history is used for detecting major extremes/zones. Quick adjust for more/less sensitivity.
Show Support/Resistance, Liquidity Zones, Trendlines:
Toggle them on/off instantly per your needs—keeps your chart relevant and tailored.
9. Live Dashboard Sections Explained
Intent HTF:
Shows if the bigger timeframe currently has a Bullish, Bearish, or Neutral (“Chop”) intent, based on strict volume/price body calculations. Instant clarity—no more guessing on trend bias.
HTF Bias:
Clear message about which side (buy/sell/sideways) controls the market on the higher timeframe, so you always trade with the “big money.”
Chart Action:
The central action for the current bar—Whether to Buy, Sell, or Wait—calculated from all indicator logic, not just one rule.
TrendScore Long/Short:
See how many candles in your chosen window were bullish or bearish, at a glance. Instantly gauge market momentum.
Reason (WHY):
Every time a signal appears, the “reason” cell tells you the primary logic (breakout, wick, strong trend, etc.) behind it. Full transparency and learning—never trade blindly.
Strong Trend:
Shows if the market is currently in a powerful trend or not—helping you avoid choppy, risky entries.
HTF Vol/Body:
Displays current higher timeframe volume and candle body %—helping spot when big players are active for higher probability trades.
Volume Sentiment:
A real-time analysis of market psychology (strong bullish/bearish, neutral)—making your decision-making much more confident.
10. Smart and User-Friendly Design
Multi-timeframe Adaptive:
All calculations can now be drawn from your choice of higher or current timeframe, ensuring signals are filtered by larger market context.
Flexible Table Position:
You can set the live dashboard/summary anywhere on the chart for best visibility.
Refined Zone Visualization:
Liquidity and order blocks are visually highlighted, auto-tuning for your settings and always cleaning up to stay clutter-free.
Multi-Lingual & Beginner Accessible:
With Hindi and simple English support, descriptions and settings are accessible for a wide audience—anyone can start using powerful trading logic with zero language barrier.
Efficient Labels & Clear Reasoning:
Signal labels and reasons are shown/removed dynamically so your chart stays informative, not messy.
Every detail of this indicator is designed to make trading both simpler and smarter—helping you avoid the common pitfalls, learn real price action, stay in sync with the market’s true mood, and act with discipline for higher consistency and confidence.
This indicator makes professional-grade market analysis accessible to everyone. It’s your trusted assistant for making smarter, faster, and more profitable trading decisions—providing not just signals, but also the “why” behind every action. With auto-adaptive logic, clear visuals, and strong focus on real trading needs, it lets you focus on capturing the moves that matter—every single time.
Buscar en scripts para "sentiment"

COT-Index-NocTradingCOT Index Indicator
The COT Index Indicator is a powerful tool designed to visualize the Commitment of Traders (COT) data and offer insights into market sentiment. The COT Index is a measurement of the relative positioning of commercial traders versus non-commercial and retail traders in the futures market. It is widely used to identify potential market reversals by observing the extremes in trader positioning.
Customizable Timeframe: The indicator allows you to choose a custom time interval (in months) to visualize the COT data, making it flexible to fit different trading styles and strategies.
How to Use:
Visualize Market Sentiment: A COT Index near extremes (close to 0 or 100) can indicate potential turning points in the market, as it reflects extreme positioning of different market participant groups.
Adjust the Time Interval: The ability to adjust the time interval (in months) gives traders the flexibility to analyze the market over different periods, which can be useful in detecting longer-term trends or short-term shifts in sentiment.
Combine with Other Indicators: To enhance your analysis, combine the COT Index with your technical analysis.
This tool can serve as an invaluable addition to your trading strategy, providing a deeper understanding of the market dynamics and the positioning of major market participants.

Enhanced Daily Sentiment & Auction Area Trading StrategyDetermine Daily Sentiment (Anchor Chart - Daily TF):
Analyze Yesterday's Daily Candle: Look at the previous day's daily candlestick (high, low, open, close). This is the "most important information."
Establish Bias: If yesterday's candle was bullish (closed higher), the bias for today is generally long (approx. 80% of the time). If bearish, the bias is short.
Moving Average Context: Note if the daily price is above or below its short-term moving average (e.g., 21 or 50 MA). This should align with the candle's bias (e.g., bullish daily candle above its MA).
Pre-Market & Opening Analysis (Information Gathering):
Check for Gaps: Observe if the market is gapping up or down in the pre-market session relative to yesterday's close. This provides an early clue to current sentiment.
Consider Overall Sentiment: Briefly factor in relevant news or overarching market sentiment (e.g., data releases, overall market feeling from yields, gold etc.). Trading Window: Focus primarily on trading within the first hour of the U.S. market open, as this is when volatility is typically highest, which the strategy relies on.
Setup 5-Minute Chart for Execution (Trading TF - 5-min):
Apply Moving Average: Use the same short-term moving average (e.g., 21 or 50 MA) as on the daily chart.
Seek Alignment (Crucial): The 5-minute chart's trend and price action relative to its MA must align with the daily chart's bias and MA relationship.
If Daily bias is LONG (price above daily MA), the 5-minute chart should also show price establishing itself above its 5-min MA, ideally with a similar "45-degree angle" uptrend.
If Daily bias is SHORT (price below daily MA), the 5-minute chart should also show price establishing itself below its 5-min MA, with a similar downtrend. If there's no clear alignment between the daily and 5-minute chart structure/MA, do not trade.
Identify the "Auction Area" (Value/Congestion) on the 5-Minute Chart:
This is a recent area of congestion, a small support/resistance flip, or where price has paused, consolidated, and is retesting, often near the 5-minute MA.
Uptrend (Long Bias): Look for a pullback (a small "V" shape dip) towards the 5-minute MA or a recent small resistance-turned-support area. This is the "auction retest" before a potential breakout higher.
Downtrend (Short Bias): Look for a pullback rally (an inverted "V" shape) towards the 5-minute MA or a recent small support-turned-resistance area.

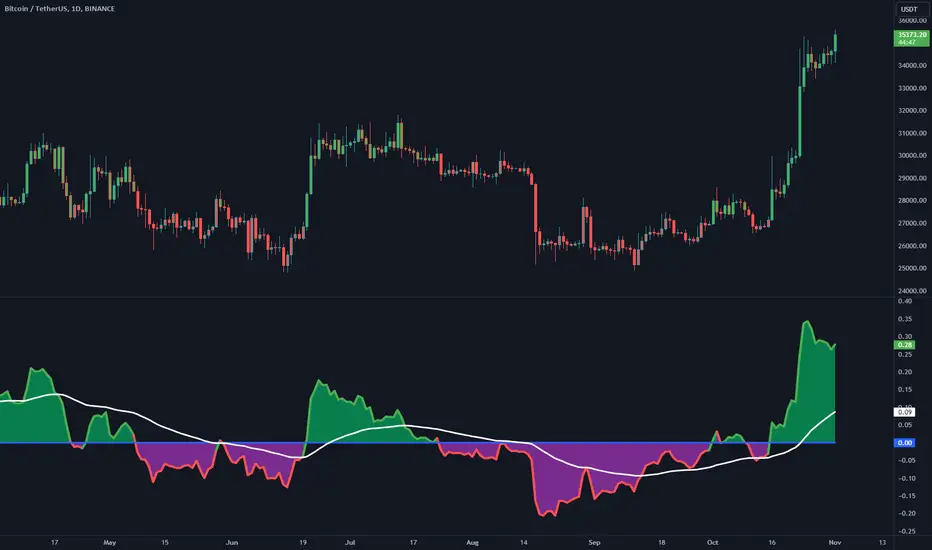
Bull Bear Power with Optional Normalization FunctionThis indicator is designed to provide traders with insights into market sentiment and potential trend reversals. This indicator enhances the traditional Bull Bear Power (BBP) by adding valuable visualizations and customization options to assist traders in making informed trading decisions.
Indicator Overview:
The NBBP indicator calculates Bull Bear Power, which measures the strength of bullish and bearish forces in the market. It does so by taking the difference between the high and the exponential moving average (EMA) of the closing price for a specified length. This raw BBP is represented on the chart as a line.
Key Features:
-- Zero Line : The NBBP indicator introduces a central reference line at zero. This line serves as a pivotal point for interpreting market sentiment. When the BBP line is above zero, it is colored green, indicating a predominance of bullish sentiment. Conversely, when the BBP line is below zero, it turns red, signaling a prevalence of bearish sentiment. This coloration helps traders quickly identify shifts in market sentiment.
-- OPTIONAL Normalization Function : One of the standout features of the NBBP indicator is its optional normalization function. When activated in the settings menu, this function scales the BBP values from -1 to +1. This means that BBP values are adjusted to fit within a standardized range, making it easier for traders to compare sentiment across different timeframes or assets. Normalization is particularly valuable for identifying extreme sentiment conditions and potential reversals.
-- Moving Average : To provide additional context and smooth out BBP fluctuations, the indicator includes an exponential moving average (EMA). The EMA of BBP is plotted on the chart as a white line. Traders can use this moving average to identify trends and potential trend reversals.
-- Fill Between Lines : The indicator visually enhances the BBP by filling the area between the BBP line and the zero line with a translucent color. This fill helps traders visualize the strength and duration of bullish or bearish sentiment.
Interpretation:
-- BBP Line : Traders can assess the raw BBP line for shifts in sentiment. When the line crosses above zero, it may suggest a shift from bearish to bullish sentiment, potentially indicating a buying opportunity. Conversely, when the line crosses below zero, it may signal a shift from bullish to bearish sentiment, suggesting a potential selling opportunity.
-- Normalization Function : The optional normalization function allows traders to gauge sentiment on a standardized scale. Values above 0 indicate bullish sentiment, while values below 0 suggest bearish sentiment. The closer the values are to their polar ends (-1 or +1), the stronger the sentiment.
-- Moving Average : The EMA of BBP helps identify trends. When BBP crosses above the EMA, it may indicate a strengthening bullish trend, while a crossover below the EMA may suggest a bearish trend.
Customization:
The NBBP indicator provides traders with flexibility through customizable settings. Users can adjust the BBP length, EMA length, and choose to activate or deactivate the normalization function based on their trading preferences and strategy.
Limitations:
The NBBP indicator is most effective when used in conjunction with other technical analysis tools and market context. Traders should consider multiple factors when making trading decisions.
Normalization function results may vary depending on the chosen length and market conditions. If the desired result is not achieved through default settings, try changing timeframes or toggling on/off the normalization function. Users should exercise caution and combine it with other indicators and analysis techniques.
In conclusion, the NBBP indicator is a versatile tool that empowers traders to assess market sentiment, identify potential reversals, and follow trends. Its intuitive visualizations, normalization function, and customizable settings make it a valuable addition to any trader's toolkit.
Uptrick: TimeFrame Trends: Performance & Sentiment Indicator### **Uptrick: TimeFrame Trends: Performance & Sentiment Indicator (TFT) - In-Depth Explanation**
#### **Overview**
The **Uptrick: TimeFrame Trends: Performance & Sentiment Indicator (TFT)** is a sophisticated trading tool designed to provide traders with a comprehensive view of market trends across multiple timeframes, combined with a sentiment gauge through the Relative Strength Index (RSI). This indicator offers a unique blend of performance analysis, sentiment evaluation, and visual signal generation, making it an invaluable resource for traders who seek to understand both the macro and micro trends within a financial instrument.
#### **Purpose**
The primary purpose of the TFT indicator is to empower traders with the ability to assess the performance of an asset over various timeframes while simultaneously gauging market sentiment through the RSI. By analyzing price changes over periods ranging from one week to one year, and complementing this with sentiment signals, TFT enables traders to make informed decisions based on a well-rounded analysis of historical price performance and current market conditions.
#### **Key Components and Features**
1. **Multi-Timeframe Performance Analysis:**
- **Performance Lookback Periods:**
- The TFT indicator calculates the percentage price change over several predefined timeframes: 7 days (1 week), 14 days (2 weeks), 30 days (1 month), 180 days (6 months), and 365 days (1 year). These timeframes provide a layered view of how an asset has performed over short, medium, and long-term periods.
- **Percentage Change Calculation:**
- The indicator computes the percentage change for each timeframe by comparing the current closing price to the closing price at the start of each period. This gives traders insight into the strength and direction of the trend over different periods, helping them identify consistent trends or potential reversals.
2. **Sentiment Analysis Using RSI:**
- **Relative Strength Index (RSI):**
- RSI is a widely-used momentum oscillator that measures the speed and change of price movements. It oscillates between 0 and 100 and is typically used to identify overbought or oversold conditions. In TFT, the RSI is calculated using a 14-period lookback, which is standard for most RSI implementations.
- **RSI Smoothing with EMA:**
- To refine the RSI signal and reduce noise, TFT applies a 10-period Exponential Moving Average (EMA) to the RSI values. This smoothed RSI is then used to generate buy, sell, and neutral signals based on its position relative to the 50 level:
- **Buy Signal:** Triggered when the smoothed RSI crosses above 50, indicating bullish sentiment.
- **Sell Signal:** Triggered when the smoothed RSI crosses below 50, indicating bearish sentiment.
- **Neutral Signal:** Triggered when the smoothed RSI equals 50, suggesting indecision or a balanced market.
3. **Visual Signal Generation:**
- **Signal Plots:**
- TFT provides clear visual cues directly on the price chart by plotting shapes at the points where buy, sell, or neutral signals are generated. These shapes are color-coded (green for buy, red for sell, yellow for neutral) and are positioned below or above the price bars for easy identification.
- **First Occurrence Trigger:**
- To avoid clutter and focus on significant market shifts, TFT only triggers the first occurrence of each signal type. This feature helps traders concentrate on the most relevant signals without being overwhelmed by repeated alerts.
4. **Customizable Performance & Sentiment Table:**
- **Table Display:**
- The TFT indicator includes a customizable table that displays the calculated percentage changes for each timeframe. This table is positioned on the chart according to user preference (top-left, top-right, bottom-left, bottom-right) and provides a quick reference to the asset’s performance across multiple periods.
- **Dynamic Text Color:**
- To enhance readability and provide immediate visual feedback, the text color in the table changes based on the direction of the percentage change: green for positive (upward movement) and red for negative (downward movement). This color-coding helps traders quickly assess whether the asset is in an uptrend or downtrend for each period.
- **Customizable Font Size:**
- Traders can adjust the font size of the table to fit their chart layout and personal preferences, ensuring that the information is accessible without being intrusive.
5. **Flexibility and Customization:**
- **Lookback Period Customization:**
- While the default lookback periods are set for common trading intervals (7 days, 14 days, etc.), these can be adjusted to match different trading strategies or market conditions. This flexibility allows traders to tailor the indicator to focus on the timeframes most relevant to their analysis.
- **RSI and EMA Settings:**
- The length of the RSI calculation and the smoothing EMA can also be customized. This is particularly useful for traders who prefer shorter or longer periods for their momentum analysis, allowing them to fine-tune the sensitivity of the indicator.
- **Table Position and Appearance:**
- The table’s position on the chart, along with its font size and colors, is fully customizable. This ensures that the indicator can be integrated seamlessly into any chart setup without obstructing key price data.
#### **Use Cases and Applications**
1. **Trend Identification and Confirmation:**
- **Short-Term Traders:**
- Traders focused on short-term movements can use the 7-day and 14-day performance metrics to identify recent trends and momentum shifts. The RSI signals provide additional confirmation, helping traders enter or exit positions based on the latest market sentiment.
- **Swing Traders:**
- For those holding positions over days to weeks, the 30-day and 180-day performance data are particularly useful. These metrics highlight medium-term trends, and when combined with RSI signals, they provide a robust framework for swing trading strategies.
- **Long-Term Investors:**
- Long-term investors can benefit from the 1-year performance data to gauge the overall health and direction of an asset. The indicator’s ability to track performance across different periods helps in identifying long-term trends and potential reversal points.
2. **Sentiment Analysis and Market Timing:**
- **Market Sentiment Tracking:**
- By using RSI in conjunction with performance metrics, TFT provides a clear picture of market sentiment. Traders can use this information to time their entries and exits more effectively, aligning their trades with periods of strong bullish or bearish sentiment.
- **Avoiding False Signals:**
- The smoothing of RSI helps reduce noise and avoid false signals that are common in volatile markets. This makes the TFT indicator a reliable tool for identifying true market trends and avoiding whipsaws that can lead to losses.
3. **Comprehensive Market Analysis:**
- **Multi-Timeframe Analysis:**
- TFT’s ability to analyze multiple timeframes simultaneously makes it an excellent tool for comprehensive market analysis. Traders can compare short-term and long-term performance to understand the broader market context, making it easier to align their trading strategies with the overall trend.
- **Performance Benchmarking:**
- The percentage change metrics provide a clear benchmark for an asset’s performance over time. This information can be used to compare the asset against broader market indices or other assets, helping traders make more informed decisions about where to allocate their capital.
4. **Custom Strategy Development:**
- **Tailoring to Specific Markets:**
- TFT can be customized to suit different markets, whether it’s stocks, forex, commodities, or cryptocurrencies. For instance, traders in volatile markets may opt for shorter lookback periods and more sensitive RSI settings, while those in stable markets may prefer longer periods for a smoother analysis.
- **Integrating with Other Indicators:**
- TFT can be used alongside other technical indicators to create a more comprehensive trading strategy. For example, combining TFT with moving averages, Bollinger Bands, or MACD can provide additional layers of confirmation and reduce the likelihood of false signals.
#### **Best Practices for Using TFT**
- **Regularly Adjust Lookback Periods:**
- Depending on the market conditions and the asset being traded, it’s important to regularly review and adjust the lookback periods for the performance metrics. This ensures that the indicator remains relevant and responsive to current market trends.
- **Combine with Volume Analysis:**
- While TFT provides a solid foundation for trend and sentiment analysis, combining it with volume indicators can further enhance its effectiveness. Volume can confirm the strength of a trend or signal potential reversals when divergences occur.
- **Use RSI with Other Momentum Indicators:**
- Although RSI is a powerful tool on its own, using it alongside other momentum indicators like Stochastic Oscillator or MACD can provide additional confirmation and help refine entry and exit points.
- **Customize Table Settings for Clarity:**
- Ensure that the performance table is positioned and sized appropriately on the chart. It should be easily readable without obstructing important price data. Adjust the text size and colors as needed to maintain clarity.
- **Monitor Multiple Timeframes:**
- Utilize the multi-timeframe analysis feature of TFT to monitor trends across different periods. This helps in identifying the dominant trend and avoiding trades that go against the broader market direction.
#### **Conclusion**
The **Uptrick: TimeFrame Trends: Performance & Sentiment Indicator (TFT)** is a comprehensive and versatile tool that combines the power of multi-timeframe performance analysis with sentiment gauging through RSI. Its ability to customize and adapt to various trading strategies and markets makes it a valuable asset for traders at all levels. By offering a clear visual representation of trends and market sentiment, TFT empowers traders to make more informed and confident trading decisions, whether they are focusing on short-term price movements or long-term investment opportunities. With its deep integration of performance metrics and sentiment analysis, TFT stands out as a must-have indicator for any trader looking to gain a holistic understanding of market dynamics.

Money Flow Profile [LuxAlgo]The Money Flow Profile is a charting tool that measures the traded volume or the money flow at all price levels on the market over a specified time period and highlights the relationship between the price of a given asset and the willingness of traders to either buy or sell it, allowing traders to reveal dominant and/or significant price levels and to analyze the trading activity of a particular user-selected range.
This tool combines a volume/money flow profile, a sentiment profile, and price levels, where the right side of the profile highlights the distribution of the traded activity/money flow at different price levels, the left side of the profile highlights the market sentiment at those price levels, and in the middle the price levels.
🔶 USAGE
A volume/money flow profile is an advanced charting tool that displays the traded volume/money flow at different price levels over a specific period. It helps traders visualize where the majority of trading activity/money flow has occurred.
A sentiment profile is a difference between buy and sell volume/money flow aiming to highlight the sentiment/dominance at specific price levels.
Each row of the profile presents figures on volume and money flow specific to price levels.
High volume/money flow nodes indicate areas of high activity and are likely to act as support or resistance in the future. They attract price and try to hold it there. Conversely, low-volume nodes are areas with low trading activity, that are less subject to get revisited by the price. The market often bounces right over these levels, not staying for long. The "Profile Heatmap" option of the script helps to better emphasize the trading activity within each areas.
By measuring the traded activity at each price level the script presents an ability to highlight the consolidation zones, in other words, highlights accumulation and distribution zones. When the price moves toward one end of the consolidation and volume pick up, it can foreshadow a potential breakout.
Level of Significance, Point of Control, Highest Sentiment Zone, and Profile Price levels are some of the other profile-related options available with the script.
🔶 SETTINGS
The script takes into account user-defined parameters and plots the profiles, where detailed usage for each user-defined input parameter in indicator settings is provided with the related input's tooltip.
🔹 Profile Generic Settings
Lookback Length / Fixed Range: Sets the lookback length.
Profile Source: Sets the profile source, Volume, or Money Flow.
🔹 Profile Presentation Settings
Volume/Money Flow Profile: Toggles the visibility of the Volume/Money Flow Profile.
High Traded Nodes: Threshold and Color option for high traded nodes.
Average Traded Nodes: Color option for average traded nodes.
Low Traded Nodes: Threshold and Color option for low traded nodes.
🔹 Sentiment Profile Settings
Sentiment Profile: Toggles the visibility of the Sentiment Profile.
Sentiment Polarity Method: Sets the method used to calculate the up/down volume/money flow.
Bullish Nodes: Color option for Bullish Nodes.
Bearish Nodes: Color option for Bearish Nodes.
🔹 Profile Heatmap Settings
Profile Heatmap: Toggles the visibility of the profile heatmap.
Heatmap Source: Sets the source of the profile heatmap, Volume/Money Flow Profile, or Sentiment Profile.
Heatmap Transparency: Control the transparency of the profile heatmap.
🔹 Other Presentation Settings
Level of Significance: Toggles the visibility of the level of significance line/zone.
Consolidation Zones: Toggles the visibility of the consolidation zones.
Consolidation Threshold, Color: Sets the threshold value and zone color.
Highest Sentiment Zone: Toggles the visibility of the highest bullish or bearish sentiment zone.
Profile Price Levels, Color, Size: Toggles the visibility of the profile price levels, and sets the color and the size of the level labels.
Profile Range Background Fill: Toggles the visibility of the profiles range.
🔹 Other Settings
Number of Rows: Specify how many rows each profile histogram will have.
Profile Width %: Alters the width of the rows in the histogram, relative to the profile length
Profile Text Size: Alters the size of the text. Setting to Auto will keep the text within the box limits.
Profile Horizontal Offset: Enables to move profile in the horizontal axis.
🔶 RELATED SCRIPTS
Liquidity-Sentiment-Profile
Swing-Volume-Profiles
For more and other conceptual scripts you are kindly invited to visit LuxAlgo-Scripts .

Dskyz Options Flow Flux (OFF) - FuturesDskyz Options Flow Flux (OFF) - Futures
*This is a repost due to moderator intervention on use of ™ in my scripts. I'm in the process of getting this rectified. This was originally posted around mid-night CDT.
🧠 The Dskyz Options Flow Flux (OFF) - Futures indicator is a game changer for futures traders looking to tap into institutional activity with limited resources. Designed for TradingView this tool simulates options flow data (call/put volume and open interest) for futures contracts like MNQ MES NQ and ES giving u actionable insights through volume spike detection volatility adjustments and stunning visuals like aurora flux bands and round number levels. Whether u’re a beginner learning the ropes or a pro hunting for an edge this indicator delivers real time market sentiment and key price levels to boost ur trading game
Key Features
⚡ Simulated Options Flow: Breaks down call/put volume and open interest using market momentum and volatility
📈 Spike Detection: Spots big moves in volume and open interest with customizable thresholds
🧠 Volatility Filter: Adapts to market conditions using ATR for smarter spike detection
✨ Aurora Flux Bands: Glows with market sentiment showing u bullish or bearish vibes at a glance
🎯 Round Number Levels: Marks key psychological levels where big players might step in
📊 Interactive Dashboard: Real time metrics like sentiment score and volatility factor right on ur chart
🚨 Alerts: Get notified of bullish or bearish spikes so u never miss a move
How It Works
🧠 This indicator is built to make complex options flow analysis simple even with the constraints of Pine Script. Here’s the step by step:
Simulated Volume Data (Dynamic Split):
Pulls daily volume for ur chosen futures contract (MNQ1! MES1! NQ1! ES1!)
Splits it into call and put volume based on momentum (ta.mom) and volatility (ATR vs its 20 period average)
Estimates open interest (OI) for calls and puts (1.15x for calls 1.1x for puts)
Formula: callRatio = 0.5 + (momentum / close) * 10 + (volatility - 1) * 0.1 capped between 0.3 and 0.7
Why It Matters: Mimics how big players might split their trades giving u a peek into institutional sentiment
Spike Detection:
Compares current volume/OI to short term (lookbackShort) and long term (lookbackLong) averages
Flags spikes when volume/OI exceeds the average by ur set threshold (spikeThreshold for regular highConfidenceThreshold for strong)
Adjusts for volatility so u’re not fooled by choppy markets
Output: optionsSignal (2 for strong bullish -2 for strong bearish 1 for bullish -1 for bearish 0 for neutral)
Why It Matters: Pinpoints where big money might be stepping in
Volatility Filter:
Uses ATR (10 periods) and its 20 period average to calculate a volatility factor (volFactor = ATR / avgAtr)
Scales spike thresholds based on market conditions (volAdjustedThreshold = spikeThreshold * max(1 volFactor * volFilter))
Why It Matters: Keeps ur signals reliable whether the market is calm or wild
Sentiment Score:
Calculates a call/put ratio (callVolume / putVolume) and adjusts for volatility
Converts it to a 0 to 100 score (higher = bullish lower = bearish)
Formula: sentimentScore = min(max((volAdjustedSentiment - 1) * 50 0) 100)
Why It Matters: Gives u a quick read on market bias
Round Number Detection:
Finds the nearest round number (e.g. 100 for MNQ1! 50 for MES1!)
Checks for volume spikes (volume > 3 period SMA * spikeThreshold) and if price is close (within ATR * atrMultiplier)
Updates the top activity level every 15 minutes when significant activity is detected
Why It Matters: Highlights psychological levels where price often reacts
Visuals and Dashboard:
Combines aurora flux bands glow effects round number lines and a dashboard to make insights pop (see Visual Elements below)
Plots triangles for call/put spikes (green/red for strong lime/orange for regular)
Sets up alerts for key market moves
Why It Matters: Makes complex data easy to read at a glance
Inputs and Customization
⚙️ Beginners can tweak these settings to match their trading style while pros can dig deeper for precision:
Futures Symbol (symbol): Pick ur contract (MNQ1! MES1! NQ1! ES1!). Default: MNQ1!
Short Lookback (lookbackShort): Days for short term averages. Smaller = more sensitive. Range: 1+. Default: 5
Long Lookback (lookbackLong): Days for long term averages. Range: 5+. Default: 10
Spike Threshold (spikeThreshold): How big a spike needs to be (e.g. 1.1 = 10% above average). Range: 1.0+. Default: 1.1
High Confidence Threshold (highConfidenceThreshold): For strong spikes (e.g. 3.0 = 3x average). Range: 2.0+. Default: 3.0
Volatility Filter (volFilter): Adjusts for market volatility (e.g. 1.2 = 20% stricter in volatile markets). Range: 1.0+. Default: 1.2
Aurora Flux Transparency (glowOpacity): Controls band transparency (0 = solid 100 = invisible). Range: 0 to 100. Default: 65
Show Show OFF Dashboard (showDashboard): Toggles the dashboard with key metrics. Default: true
Show Nearest Round Number (showRoundNumbers): Displays round number levels. Default: true
ATR Multiplier for Proximity (atrMultiplier): How close price needs to be to a round number (e.g. 1.5 = within 1.5x ATR). Range: 0.5+. Default: 1.5
Functions and Logic
🧠 Here’s the techy stuff pros will love:
Simulated Volume Data : Splits daily volume into call/put volume and OI using momentum and volatility
Volatility Filter: Scales thresholds with volFactor = atr / avgAtr for adaptive detection
Spike Detection: Flags spikes and assigns optionsSignal (2, -2, 1, -1, 0) for sentiment
Sentiment Score: Converts call/put ratio into a 0-100 score for quick bias reads
Round Number Detection: Identifies key levels and significant activity for trading zones
Dashboard Display: Updates real time metrics like sentiment score and volatility factor
Visual Elements
✨ These visuals make data come alive:
Gradient Background: Green (bullish) red (bearish) or yellow (neutral/choppy) at 95% transparency to show trend
Aurora Flux Bands: Stepped bands (linewidth 3) around a 14 period EMA ± ATR * 1.8. Colors shift with sentiment (green red lime orange gray) with glow effects at 85% transparency
Round Number Visualization: Stepped lines (linewidth 2) at key levels (solid if active dashed if not) with labels (black background white text size.normal)
Visual Signals: Triangles above/below bars for spikes (size.small for strong size.tiny for regular)
Dashboard: Bottom left table (2 columns 10 rows) with a black background (29% transparency) gray border and metrics:
⚡ Round Number Activity: “Detected” or “None”
📈 Trend: “Bullish” “Bearish” or “Neutral” (colored green/red/gray)
🧠 ATR: Current 10 period ATR
📊 ATR Avg: 20 period SMA of ATR
📉 Volume Spike: “YES” (green) or “NO” (red)
📋 Call/Put Ratio: Current ratio
✨ Flux Signal: “Strong Bullish” “Strong Bearish” “Bullish” “Bearish” or “Neutral” (colored green/red/gray)
⚙️ Volatility Factor: Current volFactor
📈 Sentiment Score: 0-100 score
Usage and Strategy Recommendations
🎯 For Beginners: Use high confidence spikes (green/red triangles) for easy entries. Check the dashboard for a quick market read (sentiment score above 60 = bullish below 40 = bearish). Watch round number levels for support/resistance
💡 For Pros: Combine flux signals with round number activity for high probability setups. Adjust lookbackShort/lookbackLong for trending vs choppy markets. Use volFactor for position sizing (higher = smaller positions)

High Low Index SPY Top 40Modification from original code for "High Low Index" by © LonesomeTheBlue
- Made modification specifically for Top 40 AMEX:SPY holdings
- Added Market sentiment histogram (Total count green vs red), and SMA line for it
- Added arrows for peaks and dips on High Low Index and Market Sentiment MA
Idea behind this indicator is that SPY should follow the overall sentiment of its top holdings. I believe this bring great value to SPY traders.
Enjoy~!

$TICK & TICKQ Sentiment IndicatorThe USI:TICK & USI:TICKQ Sentiment Indicator is a versatile tool for traders analyzing the NYSE Tick Index ( USI:TICK ) or Nasdaq Tick Index ( USI:TICKQ ) to gauge market sentiment. It provides clear visual signals, a customizable moving average, and statistical insights to identify bullish and bearish conditions in real-time.
Key Features:
Sentiment Signals: Green triangle (▲) labels at a user-defined level (default: +1200) when the Tick closes above zero, and red triangle (▼) labels (default: -1200) when below zero, indicating bullish or bearish sentiment.
Adjustable Moving Average: Plots a customizable moving average (SMA, EMA, WMA, VWMA, SMMA, HullMA) with user-defined length (default: 14) to smooth Tick data and highlight trends.
Close Statistics: Displays the percentage of positive and negative Tick closes over a user-specified lookback period (default: 100) in a customizable table (position and font size adjustable).
Threshold Lines: Includes reference lines at +800/-800 (gold) and +1000/-1000 (red) to mark key Tick levels, plus a zero line (gray, dashed) for context.
Customizable Display: Adjust symbol sizes (tiny, small, normal, large, huge), table position (top-right, top-left, etc.), and table font size for a tailored chart experience.
How to Use:
Apply the indicator to a USI:TICK or USI:TICKQ chart (e.g., TVC:TICK, TVC:TICKQ) on an intraday timeframe (e.g., 1-minute, 5-minute).
In the settings:
Set the TICK Symbol to your broker’s NYSE Tick ( USI:TICK ) or Nasdaq Tick ( USI:TICKQ ) symbol.
Adjust Top Level and Bottom Level (default: +1200/-1200) to position sentiment signals at chart edges.
Set Moving Average Length and Type to suit your analysis.
Configure Lookback Period for close percentage calculations.
Customize Dot Size , Table Position , and Table Font Size for optimal visibility.
Monitor green/red triangles for sentiment, the moving average for trends, and the table for statistical insights.
Notes:
This indicator is designed for both USI:TICK (NYSE Tick) and USI:TICKQ (Nasdaq Tick, NQ Tick), allowing analysis of either market’s breadth.
Ensure your chart’s timeframe supports USI:TICK or USI:TICKQ data.
Adjust Top Level / Bottom Level if symbols don’t appear at chart edges due to scaling.
Labels may stack with frequent signals; contact the developer for customization to limit frequency.
No symbol appears if the Tick closes at 0; a neutral marker can be added upon request.
Ideal For:
Day traders and scalpers using USI:TICK or USI:TICKQ to gauge market breadth.
Analysts seeking customizable visualizations and statistical insights for Tick data.
Created by northfieldwhale.

Request█ OVERVIEW
This library is a tool for Pine Script™ programmers that consolidates access to a wide range of lesser-known data feeds available on TradingView, including metrics from the FRED database, FINRA short sale volume, open interest, and COT data. The functions in this library simplify requests for these data feeds, making them easier to retrieve and use in custom scripts.
█ CONCEPTS
Federal Reserve Economic Data (FRED)
FRED (Federal Reserve Economic Data) is a comprehensive online database curated by the Federal Reserve Bank of St. Louis. It provides free access to extensive economic and financial data from U.S. and international sources. FRED includes numerous economic indicators such as GDP, inflation, employment, and interest rates. Additionally, it provides financial market data, regional statistics, and international metrics such as exchange rates and trade balances.
Sourced from reputable organizations, including U.S. government agencies, international institutions, and other public and private entities, FRED enables users to analyze over 825,000 time series, download their data in various formats, and integrate their information into analytical tools and programming workflows.
On TradingView, FRED data is available from ticker identifiers with the "FRED:" prefix. Users can search for FRED symbols in the "Symbol Search" window, and Pine scripts can retrieve data for these symbols via `request.*()` function calls.
FINRA Short Sale Volume
FINRA (the Financial Industry Regulatory Authority) is a non-governmental organization that supervises and regulates U.S. broker-dealers and securities professionals. Its primary aim is to protect investors and ensure integrity and transparency in financial markets.
FINRA's Short Sale Volume data provides detailed information about daily short-selling activity across U.S. equity markets. This data tracks the volume of short sales reported to FINRA's trade reporting facilities (TRFs), including shares sold on FINRA-regulated Alternative Trading Systems (ATSs) and over-the-counter (OTC) markets, offering transparent access to short-selling information not typically available from exchanges. This data helps market participants, researchers, and regulators monitor trends in short-selling and gain insights into bearish sentiment, hedging strategies, and potential market manipulation. Investors often use this data alongside other metrics to assess stock performance, liquidity, and overall trading activity.
It is important to note that FINRA's Short Sale Volume data does not consolidate short sale information from public exchanges and excludes trading activity that is not publicly disseminated.
TradingView provides ticker identifiers for requesting Short Sale Volume data with the format "FINRA:_SHORT_VOLUME", where "" is a supported U.S. equities symbol (e.g., "AAPL").
Open Interest (OI)
Open interest is a cornerstone indicator of market activity and sentiment in derivatives markets such as options or futures. In contrast to volume, which measures the number of contracts opened or closed within a period, OI measures the number of outstanding contracts that are not yet settled. This distinction makes OI a more robust indicator of how money flows through derivatives, offering meaningful insights into liquidity, market interest, and trends. Many traders and investors analyze OI alongside volume and price action to gain an enhanced perspective on market dynamics and reinforce trading decisions.
TradingView offers many ticker identifiers for requesting OI data with the format "_OI", where "" represents a derivative instrument's ticker ID (e.g., "COMEX:GC1!").
Commitment of Traders (COT)
Commitment of Traders data provides an informative weekly breakdown of the aggregate positions held by various market participants, including commercial hedgers, non-commercial speculators, and small traders, in the U.S. derivative markets. Tallied and managed by the Commodity Futures Trading Commission (CFTC) , these reports provide traders and analysts with detailed insight into an asset's open interest and help them assess the actions of various market players. COT data is valuable for gaining a deeper understanding of market dynamics, sentiment, trends, and liquidity, which helps traders develop informed trading strategies.
TradingView has numerous ticker identifiers that provide access to time series containing data for various COT metrics. To learn about COT ticker IDs and how they work, see our LibraryCOT publication.
█ USING THE LIBRARY
Common function characteristics
• This library's functions construct ticker IDs with valid formats based on their specified parameters, then use them as the `symbol` argument in request.security() to retrieve data from the specified context.
• Most of these functions automatically select the timeframe of a data request because the data feeds are not available for all timeframes.
• All the functions have two overloads. The first overload of each function uses values with the "simple" qualifier to define the requested context, meaning the context does not change after the first script execution. The second accepts "series" values, meaning it can request data from different contexts across executions.
• The `gaps` parameter in most of these functions specifies whether the returned data is `na` when a new value is unavailable for request. By default, its value is `false`, meaning the call returns the last retrieved data when no new data is available.
• The `repaint` parameter in applicable functions determines whether the request can fetch the latest unconfirmed values from a higher timeframe on realtime bars, which might repaint after the script restarts. If `false`, the function only returns confirmed higher-timeframe values to avoid repainting. The default value is `true`.
`fred()`
The `fred()` function retrieves the most recent value of a specified series from the Federal Reserve Economic Data (FRED) database. With this function, programmers can easily fetch macroeconomic indicators, such as GDP and unemployment rates, and use them directly in their scripts.
How it works
The function's `fredCode` parameter accepts a "string" representing the unique identifier of a specific FRED series. Examples include "GDP" for the "Gross Domestic Product" series and "UNRATE" for the "Unemployment Rate" series. Over 825,000 codes are available. To access codes for available series, search the FRED website .
The function adds the "FRED:" prefix to the specified `fredCode` to construct a valid FRED ticker ID (e.g., "FRED:GDP"), which it uses in request.security() to retrieve the series data.
Example Usage
This line of code requests the latest value from the Gross Domestic Product series and assigns the returned value to a `gdpValue` variable:
float gdpValue = fred("GDP")
`finraShortSaleVolume()`
The `finraShortSaleVolume()` function retrieves EOD data from a FINRA Short Sale Volume series. Programmers can call this function to retrieve short-selling information for equities listed on supported exchanges, namely NASDAQ, NYSE, and NYSE ARCA.
How it works
The `symbol` parameter determines which symbol's short sale volume information is retrieved by the function. If the value is na , the function requests short sale volume data for the chart's symbol. The argument can be the name of the symbol from a supported exchange (e.g., "AAPL") or a ticker ID with an exchange prefix ("NASDAQ:AAPL"). If the `symbol` contains an exchange prefix, it must be one of the following: "NASDAQ", "NYSE", "AMEX", or "BATS".
The function constructs a ticker ID in the format "FINRA:ticker_SHORT_VOLUME", where "ticker" is the symbol name without the exchange prefix (e.g., "AAPL"). It then uses the ticker ID in request.security() to retrieve the available data.
Example Usage
This line of code retrieves short sale volume for the chart's symbol and assigns the result to a `shortVolume` variable:
float shortVolume = finraShortSaleVolume(syminfo.tickerid)
This example requests short sale volume for the "NASDAQ:AAPL" symbol, irrespective of the current chart:
float shortVolume = finraShortSaleVolume("NASDAQ:AAPL")
`openInterestFutures()` and `openInterestCrypto()`
The `openInterestFutures()` function retrieves EOD open interest (OI) data for futures contracts. The `openInterestCrypto()` function provides more granular OI data for cryptocurrency contracts.
How they work
The `openInterestFutures()` function retrieves EOD closing OI information. Its design is focused primarily on retrieving OI data for futures, as only EOD OI data is available for these instruments. If the chart uses an intraday timeframe, the function requests data from the "1D" timeframe. Otherwise, it uses the chart's timeframe.
The `openInterestCrypto()` function retrieves opening, high, low, and closing OI data for a cryptocurrency contract on a specified timeframe. Unlike `openInterest()`, this function can also retrieve granular data from intraday timeframes.
Both functions contain a `symbol` parameter that determines the symbol for which the calls request OI data. The functions construct a valid OI ticker ID from the chosen symbol by appending "_OI" to the end (e.g., "CME:ES1!_OI").
The `openInterestFutures()` function requests and returns a two-element tuple containing the futures instrument's EOD closing OI and a "bool" condition indicating whether OI is rising.
The `openInterestCrypto()` function requests and returns a five-element tuple containing the cryptocurrency contract's opening, high, low, and closing OI, and a "bool" condition indicating whether OI is rising.
Example usage
This code line calls `openInterest()` to retrieve EOD OI and the OI rising condition for a futures symbol on the chart, assigning the values to two variables in a tuple:
= openInterestFutures(syminfo.tickerid)
This line retrieves the EOD OI data for "CME:ES1!", irrespective of the current chart's symbol:
= openInterestFutures("CME:ES1!")
This example uses `openInterestCrypto()` to retrieve OHLC OI data and the OI rising condition for a cryptocurrency contract on the chart, sampled at the chart's timeframe. It assigns the returned values to five variables in a tuple:
= openInterestCrypto(syminfo.tickerid, timeframe.period)
This call retrieves OI OHLC and rising information for "BINANCE:BTCUSDT.P" on the "1D" timeframe:
= openInterestCrypto("BINANCE:BTCUSDT.P", "1D")
`commitmentOfTraders()`
The `commitmentOfTraders()` function retrieves data from the Commitment of Traders (COT) reports published by the Commodity Futures Trading Commission (CFTC). This function significantly simplifies the COT request process, making it easier for programmers to access and utilize the available data.
How It Works
This function's parameters determine different parts of a valid ticker ID for retrieving COT data, offering a streamlined alternative to constructing complex COT ticker IDs manually. The `metricName`, `metricDirection`, and `includeOptions` parameters are required. They specify the name of the reported metric, the direction, and whether it includes information from options contracts.
The function also includes several optional parameters. The `CFTCCode` parameter allows programmers to request data for a specific report code. If unspecified, the function requests data based on the chart symbol's root prefix, base currency, or quoted currency, depending on the `mode` argument. The call can specify the report type ("Legacy", "Disaggregated", or "Financial") and metric type ("All", "Old", or "Other") with the `typeCOT` and `metricType` parameters.
Explore the CFTC website to find valid report codes for specific assets. To find detailed information about the metrics included in the reports and their meanings, see the CFTC's Explanatory Notes .
View the function's documentation below for detailed explanations of its parameters. For in-depth information about COT ticker IDs and more advanced functionality, refer to our previously published COT library .
Available metrics
Different COT report types provide different metrics . The tables below list all available metrics for each type and their applicable directions:
+------------------------------+------------------------+
| Legacy (COT) Metric Names | Directions |
+------------------------------+------------------------+
| Open Interest | No direction |
| Noncommercial Positions | Long, Short, Spreading |
| Commercial Positions | Long, Short |
| Total Reportable Positions | Long, Short |
| Nonreportable Positions | Long, Short |
| Traders Total | No direction |
| Traders Noncommercial | Long, Short, Spreading |
| Traders Commercial | Long, Short |
| Traders Total Reportable | Long, Short |
| Concentration Gross LT 4 TDR | Long, Short |
| Concentration Gross LT 8 TDR | Long, Short |
| Concentration Net LT 4 TDR | Long, Short |
| Concentration Net LT 8 TDR | Long, Short |
+------------------------------+------------------------+
+-----------------------------------+------------------------+
| Disaggregated (COT2) Metric Names | Directions |
+-----------------------------------+------------------------+
| Open Interest | No Direction |
| Producer Merchant Positions | Long, Short |
| Swap Positions | Long, Short, Spreading |
| Managed Money Positions | Long, Short, Spreading |
| Other Reportable Positions | Long, Short, Spreading |
| Total Reportable Positions | Long, Short |
| Nonreportable Positions | Long, Short |
| Traders Total | No Direction |
| Traders Producer Merchant | Long, Short |
| Traders Swap | Long, Short, Spreading |
| Traders Managed Money | Long, Short, Spreading |
| Traders Other Reportable | Long, Short, Spreading |
| Traders Total Reportable | Long, Short |
| Concentration Gross LE 4 TDR | Long, Short |
| Concentration Gross LE 8 TDR | Long, Short |
| Concentration Net LE 4 TDR | Long, Short |
| Concentration Net LE 8 TDR | Long, Short |
+-----------------------------------+------------------------+
+-------------------------------+------------------------+
| Financial (COT3) Metric Names | Directions |
+-------------------------------+------------------------+
| Open Interest | No Direction |
| Dealer Positions | Long, Short, Spreading |
| Asset Manager Positions | Long, Short, Spreading |
| Leveraged Funds Positions | Long, Short, Spreading |
| Other Reportable Positions | Long, Short, Spreading |
| Total Reportable Positions | Long, Short |
| Nonreportable Positions | Long, Short |
| Traders Total | No Direction |
| Traders Dealer | Long, Short, Spreading |
| Traders Asset Manager | Long, Short, Spreading |
| Traders Leveraged Funds | Long, Short, Spreading |
| Traders Other Reportable | Long, Short, Spreading |
| Traders Total Reportable | Long, Short |
| Concentration Gross LE 4 TDR | Long, Short |
| Concentration Gross LE 8 TDR | Long, Short |
| Concentration Net LE 4 TDR | Long, Short |
| Concentration Net LE 8 TDR | Long, Short |
+-------------------------------+------------------------+
Example usage
This code line retrieves "Noncommercial Positions (Long)" data, without options information, from the "Legacy" report for the chart symbol's root, base currency, or quote currency:
float nonCommercialLong = commitmentOfTraders("Noncommercial Positions", "Long", false)
This example retrieves "Managed Money Positions (Short)" data, with options included, from the "Disaggregated" report:
float disaggregatedData = commitmentOfTraders("Managed Money Positions", "Short", true, "", "Disaggregated")
█ NOTES
• This library uses dynamic requests , allowing dynamic ("series") arguments for the parameters defining the context (ticker ID, timeframe, etc.) of a `request.*()` function call. With this feature, a single `request.*()` call instance can flexibly retrieve data from different feeds across historical executions. Additionally, scripts can use such calls in the local scopes of loops, conditional structures, and even exported library functions, as demonstrated in this script. All scripts coded in Pine Script™ v6 have dynamic requests enabled by default. To learn more about the behaviors and limitations of this feature, see the Dynamic requests section of the Pine Script™ User Manual.
• The library's example code offers a simple demonstration of the exported functions. The script retrieves available data using the function specified by the "Series type" input. The code requests a FRED series or COT (Legacy), FINRA Short Sale Volume, or Open Interest series for the chart's symbol with specific parameters, then plots the retrieved data as a step-line with diamond markers.
Look first. Then leap.
█ EXPORTED FUNCTIONS
This library exports the following functions:
fred(fredCode, gaps)
Requests a value from a specified Federal Reserve Economic Data (FRED) series. FRED is a comprehensive source that hosts numerous U.S. economic datasets. To explore available FRED datasets and codes, search for specific categories or keywords at fred.stlouisfed.org Calls to this function count toward a script's `request.*()` call limit.
Parameters:
fredCode (series string) : The unique identifier of the FRED series. The function uses the value to create a valid ticker ID for retrieving FRED data in the format `"FRED:fredCode"`. For example, `"GDP"` refers to the "Gross Domestic Product" series ("FRED:GDP"), and `"GFDEBTN"` refers to the "Federal Debt: Total Public Debt" series ("FRED:GFDEBTN").
gaps (simple bool) : Optional. If `true`, the function returns a non-na value only when a new value is available from the requested context. If `false`, the function returns the latest retrieved value when new data is unavailable. The default is `false`.
Returns: (float) The value from the requested FRED series.
finraShortSaleVolume(symbol, gaps, repaint)
Requests FINRA daily short sale volume data for a specified symbol from one of the following exchanges: NASDAQ, NYSE, NYSE ARCA. If the chart uses an intraday timeframe, the function requests data from the "1D" timeframe. Otherwise, it uses the chart's timeframe. Calls to this function count toward a script's `request.*()` call limit.
Parameters:
symbol (series string) : The symbol for which to request short sale volume data. If the specified value contains an exchange prefix, it must be one of the following: "NASDAQ", "NYSE", "AMEX", "BATS".
gaps (simple bool) : Optional. If `true`, the function returns a non-na value only when a new value is available from the requested context. If `false`, the function returns the latest retrieved value when new data is unavailable. The default is `false`.
repaint (simple bool) : Optional. If `true` and the chart's timeframe is intraday, the value requested on realtime bars may change its time offset after the script restarts its executions. If `false`, the function returns the last confirmed period's values to avoid repainting. The default is `true`.
Returns: (float) The short sale volume for the specified symbol or the chart's symbol.
openInterestFutures(symbol, gaps, repaint)
Requests EOD open interest (OI) and OI rising information for a valid futures symbol. If the chart uses an intraday timeframe, the function requests data from the "1D" timeframe. Otherwise, it uses the chart's timeframe. Calls to this function count toward a script's `request.*()` call limit.
Parameters:
symbol (series string) : The symbol for which to request open interest data.
gaps (simple bool) : Optional. If `true`, the function returns non-na values only when new values are available from the requested context. If `false`, the function returns the latest retrieved values when new data is unavailable. The default is `false`.
repaint (simple bool) : Optional. If `true` and the chart's timeframe is intraday, the value requested on realtime bars may change its time offset after the script restarts its executions. If `false`, the function returns the last confirmed period's values to avoid repainting. The default is `true`.
Returns: ( ) A tuple containing the following values:
- The closing OI value for the symbol.
- `true` if the closing OI is above the previous period's value, `false` otherwise.
openInterestCrypto(symbol, timeframe, gaps, repaint)
Requests opening, high, low, and closing open interest (OI) data and OI rising information for a valid cryptocurrency contract on a specified timeframe. Calls to this function count toward a script's `request.*()` call limit.
Parameters:
symbol (series string) : The symbol for which to request open interest data.
timeframe (series string) : The timeframe of the data request. If the timeframe is lower than the chart's timeframe, it causes a runtime error.
gaps (simple bool) : Optional. If `true`, the function returns non-na values only when new values are available from the requested context. If `false`, the function returns the latest retrieved values when new data is unavailable. The default is `false`.
repaint (simple bool) : Optional. If `true` and the `timeframe` represents a higher timeframe, the function returns unconfirmed values from the timeframe on realtime bars, which repaint when the script restarts its executions. If `false`, it returns only confirmed higher-timeframe values to avoid repainting. The default is `true`.
Returns: ( ) A tuple containing the following values:
- The opening, high, low, and closing OI values for the symbol, respectively.
- `true` if the closing OI is above the previous period's value, `false` otherwise.
commitmentOfTraders(metricName, metricDirection, includeOptions, CFTCCode, typeCOT, mode, metricType)
Requests Commitment of Traders (COT) data with specified parameters. This function provides a simplified way to access CFTC COT data available on TradingView. Calls to this function count toward a script's `request.*()` call limit. For more advanced tools and detailed information about COT data, see TradingView's LibraryCOT library.
Parameters:
metricName (series string) : One of the valid metric names listed in the library's documentation and source code.
metricDirection (series string) : Metric direction. Possible values are: "Long", "Short", "Spreading", and "No direction". Consult the library's documentation or code to see which direction values apply to the specified metric.
includeOptions (series bool) : If `true`, the COT symbol includes options information. Otherwise, it does not.
CFTCCode (series string) : Optional. The CFTC code for the asset. For example, wheat futures (root "ZW") have the code "001602". If one is not specified, the function will attempt to get a valid code for the chart symbol's root, base currency, or main currency.
typeCOT (series string) : Optional. The type of report to request. Possible values are: "Legacy", "Disaggregated", "Financial". The default is "Legacy".
mode (series string) : Optional. Specifies the information the function extracts from a symbol. Possible modes are:
- "Root": The function extracts the futures symbol's root prefix information (e.g., "ES" for "ESH2020").
- "Base currency": The function extracts the first currency from a currency pair (e.g., "EUR" for "EURUSD").
- "Currency": The function extracts the currency of the symbol's quoted values (e.g., "JPY" for "TSE:9984" or "USDJPY").
- "Auto": The function tries the first three modes (Root -> Base currency -> Currency) until it finds a match.
The default is "Auto". If the specified mode is not available for the symbol, it causes a runtime error.
metricType (series string) : Optional. The metric type. Possible values are: "All", "Old", "Other". The default is "All".
Returns: (float) The specified Commitment of Traders data series. If no data is available, it causes a runtime error.

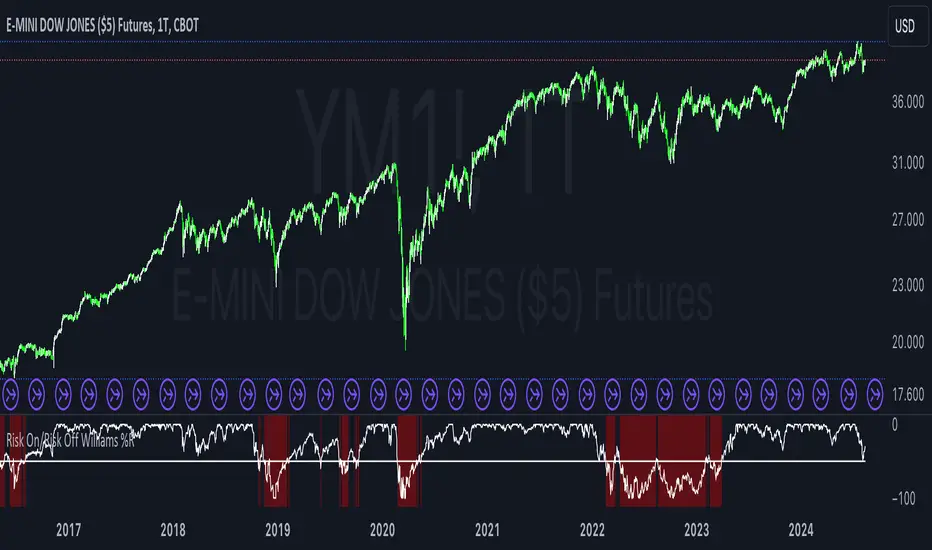
Risk On/Risk Off Williams %RThe Risk On/Risk Off Williams %R indicator is a technical analysis tool designed to gauge market sentiment by comparing the performance of risk-on and risk-off assets. This indicator combines the Williams %R, a momentum oscillator, with a composite index derived from various financial assets to determine the prevailing market risk sentiment.
Components:
Risk-On Assets: These are typically more volatile and are expected to perform well during bullish market conditions. The indicator uses the following risk-on assets:
SPY (S&P 500 ETF)
QQQ (Nasdaq-100 ETF)
HYG (High-Yield Corporate Bond ETF)
XLF (Financial Select Sector SPDR Fund)
XLK (Technology Select Sector SPDR Fund)
Risk-Off Assets: These are generally considered safer investments and are expected to outperform during bearish market conditions. The indicator includes:
TLT (iShares 20+ Year Treasury Bond ETF)
GLD (SPDR Gold Trust)
DXY (U.S. Dollar Index)
IEF (iShares 7-10 Year Treasury Bond ETF)
XLU (Utilities Select Sector SPDR Fund)
Calculation:
Risk-On Index: The average closing price of the risk-on assets.
Risk-Off Index: The average closing price of the risk-off assets.
The composite index is computed as:
Composite Index=Risk On Index−Risk Off Index
Composite Index=Risk On Index−Risk Off Index
Williams %R: This momentum oscillator measures the current price relative to the high-low range over a specified period. It is calculated as:
\text{Williams %R} = \frac{\text{Highest High} - \text{Composite Index}}{\text{Highest High} - \text{Lowest Low}} \times -100
where "Highest High" and "Lowest Low" are the highest and lowest values of the composite index over the lookback period.
Usage:
Williams %R: A momentum oscillator that ranges from -100 to 0. Values above -50 suggest bullish conditions, while values below -50 indicate bearish conditions.
Background Color: The background color of the chart changes based on the Williams %R relative to a predefined threshold level:
Green background: When Williams %R is above the threshold level, indicating a bullish sentiment.
Red background: When Williams %R is below the threshold level, indicating a bearish sentiment.
Purpose:
The indicator is designed to provide a visual representation of market sentiment by comparing the performance of risk-on versus risk-off assets. It helps traders and investors understand whether the market is leaning towards higher risk (risk-on) or safety (risk-off) based on the relative performance of these asset classes. By incorporating the Williams %R, the indicator adds a momentum-based dimension to this analysis, allowing for better decision-making in response to shifting market conditions.
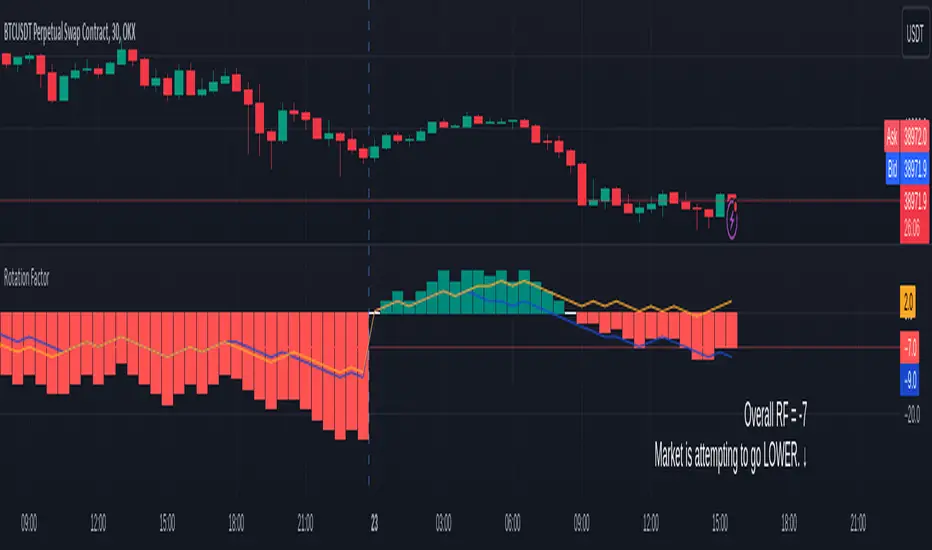
Rotation Factor for TPO and OHLC (Plot)The Rotation Factor objectively measures attempted market direction(or market sentiment) for a given period. It records the cumulative directional attempts of auction rotations within a given period, thus, helping traders determine which way the market is trying to go and which market participant is exerting greater control or influence.
Theory
The premise is that a greater number of bars auctioning higher contrasted to bars auctioning lower indicates that buyers are exerting greater control over price within the given period(usually daily). In this case, the market is attempting to go higher (Market is Bullish). The same is true for a greater number of bars auctioning lower than higher, which, in this case, indicates that the sellers are exerting greater control over price within the given period and that the market is attempting to go lower (Market is Bearish).
Calculation
Each bar is individually measured in relation to the immediate previous bar, and calculations are reset at the beginning of each period.
For every bar, two variables are utilised: One for the highs and another for the lows. During bar start, these variables are initiated at 0.
As the period progresses, these variables are set accordingly: If the high of the current bar is higher than that of the previous bar, then the bar's highs variable is assigned a "+1". If the opposite is true, it is given a "-1". Finally, if both bar highs are equal, it is, instead, assigned a "0". The same is true for the lows: if the low of the current bar is higher than that of the previous low, then the bar's lows variable is assigned a "+1". Similarly, the opposite is given a "-1", while equal lows causes it to be assigned a "0". All highs and lows are then summed together resulting to a total, which becomes the Rotational Factor.
Presentation
Furthermore, this Rotation Factor Indicator is presented as a plot, which, unlike its classic variation, shows you how the rotation factor is developing. It also includes lines indicating the Top Rotation Factor and the Bottom Rotation Factor individually, the better to observe the developing auction.
Link to the Classic Variation:
Features
1. Customisable Tick Size/Granularity : The calculation tick size/ granularity is customisable which can be accessed through the indicator settings.
2. Customisable Labels and Lines : The colour and sizes used by the labels and lines are customisable the better for accessibility.
3. Period Separator : A separator is rendered to represent period borders (start and end). If separators are already present on your chart, you can remove them from the indicator settings.
4. Individual Top Rotation Factor and Bottom Rotation Factor plots : These two parts which becomes of the Rotation Factor are also presented individually, on their own plots, the better to observe the developing auction.
Works for both split Market Profile(TPO) charts and regular OHLC bars/candle charts
The Rotation Factor is usually used with a Split Market Profile (TPO). However, if no such tool is available, you will still be able to benefit from the Rotation Factor as the price ranges of Split Market Profiles and OHLC bars/candles are one and the same. In such cases, it is recommended that you set your chart to use a 30 minute timeframe and the indicator's period to "daily" to simulate a Split Market Profile.
Note :
The Rotation Factor is, to quote, "by no means not an all-conclusive indication of future market direction.". It only helps determine which way the market is trying to go by objectively measuring the market's directional attempts.
Momentum Index [BigBeluga]The Momentum Index is an innovative indicator designed to measure the momentum of price action by analyzing the distribution of positive and negative momentum values over a defined period. By incorporating delta-based calculations and smoothing techniques, it provides traders with a clear and actionable representation of market momentum dynamics.
🔵 Key Features:
Delta-Based Momentum Analysis:
Calculates the momentum of price by comparing its current state to its value from a defined number of bars back.
Inside a loop, it evaluates whether momentum values are above or below zero, producing a delta value that reflects the net momentum direction and intensity.
Double EMA Smoothing:
Smooths the raw delta-based momentum values with a double EMA filter, reducing noise and providing a clearer trend signal.
tmi(len) =>
sum = 0.0
sum1 = 0.0
above = 0.0
below = 0.0
src_ = src - src
for i = 0 to len
sum := sum + (src_ > nz(src_ ) ? 1 : -1)
sum1 := sum1 + (sum > 0 ? 1 : -1)
sum1 := emaEma(sum1, 10)
for i = 1 to len
above := above + (sum1 > 0 ? 1 : 0)
below := below + (sum1 > 0 ? 0 : 1)
Directional Momentum Signals:
Generates momentum shift signals and displays them on both the oscillator and the main chart:
- △ Aqua Triangles: Represent upward momentum shifts.
- ▽ Red Triangles: Represent downward momentum shifts.
Dynamic Gradient Display:
Highlights momentum zones with gradient fills:
- Aqua shades for positive momentum (above zero).
- Red shades for negative momentum (below zero).
Dashboard Display:
A dashboard summarizing the count of momentum values above and below zero for the defined period (Sentiment Length e.g. 100), helping traders assess market sentiment at a glance.
🔵 How It Works:
The indicator takes price momentum as its source and evaluates the number of momentum values above and below zero within a defined period.
The delta calculation aggregates this information, providing a net representation of the prevailing market momentum.
A double EMA filter is applied to the delta values, smoothing the momentum line and enhancing signal clarity.
Momentum shifts are highlighted with visual signals on the oscillator and price chart, while the gradient display provides a visual representation of intensity.
🔵 Use Cases:
Momentum Tracking: Identify whether market momentum is predominantly bullish or bearish.
Signal Confirmation: Use chart-based signals to confirm potential trend reversals or continuation.
Analyze Market Strength: Leverage the dashboard to quickly assess the distribution of momentum over the chosen period.
Overbought/Oversold Conditions: Utilize gradient zones to detect areas of momentum extremes and possible price exhaustion.
Momentum Index offers a refined approach to analyzing momentum dynamics, combining delta-based calculations with smoothing techniques and intuitive visuals, making it an essential tool for traders looking to anticipate market movements effectively.

Market Sentiment - Historic Movement & Pending Orders The "Market Sentiment Osc" is a custom trading indicator designed to assess market sentiment based on bid-ask and tick-based data. This oscillator aggregates data from two key sources:
It measures the balance between market upticks, market downticks, cumulative bids and cumulative asks. By doing this we are attempting to guage sentiment by combining the actions that have happened in the past as well as the pending actions the market is willing to make.
The indicator combines these two components to form a composite oscillator that highlights shifts in market sentiment. When the composite value is positive, it suggests a bullish trend, while a negative value indicates bearish sentiment.
The Hoodie Market Trend is plotted as a histogram, with color coding:
Green: Bullish momentum (positive values).
Red: Bearish momentum (negative values).
Additionally, the user can toggle the histogram visibility with the provided input option.
This oscillator can be applied across various timeframes and stock symbols without allowing for symbol customization, making it a simple yet effective tool for market trend analysis. The zero line (purple) serves as a reference point to gauge whether the market is in a bullish or bearish phase.

Dynamic Ticks Oscillator Model (DTOM)The Dynamic Ticks Oscillator Model (DTOM) is a systematic trading approach grounded in momentum and volatility analysis, designed to exploit behavioral inefficiencies in the equity markets. It focuses on the NYSE Down Ticks, a metric reflecting the cumulative number of stocks trading at a lower price than their previous trade. As a proxy for market sentiment and selling pressure, this indicator is particularly useful in identifying shifts in investor behavior during periods of heightened uncertainty or volatility (Jegadeesh & Titman, 1993).
Theoretical Basis
The DTOM builds on established principles of momentum and mean reversion in financial markets. Momentum strategies, which seek to capitalize on the persistence of price trends, have been shown to deliver significant returns in various asset classes (Carhart, 1997). However, these strategies are also susceptible to periods of drawdown due to sudden reversals. By incorporating volatility as a dynamic component, DTOM adapts to changing market conditions, addressing one of the primary challenges of traditional momentum models (Barroso & Santa-Clara, 2015).
Sentiment and Volatility as Core Drivers
The NYSE Down Ticks serve as a proxy for short-term negative sentiment. Sudden increases in Down Ticks often signal panic-driven selling, creating potential opportunities for mean reversion. Behavioral finance studies suggest that investor overreaction to negative news can lead to temporary mispricings, which systematic strategies can exploit (De Bondt & Thaler, 1985). By incorporating a rate-of-change (ROC) oscillator into the model, DTOM tracks the momentum of Down Ticks over a specified lookback period, identifying periods of extreme sentiment.
In addition, the strategy dynamically adjusts entry and exit thresholds based on recent volatility. Research indicates that incorporating volatility into momentum strategies can enhance risk-adjusted returns by improving adaptability to market conditions (Moskowitz, Ooi, & Pedersen, 2012). DTOM uses standard deviations of the ROC as a measure of volatility, allowing thresholds to contract during calm markets and expand during turbulent ones. This approach helps mitigate false signals and aligns with findings that volatility scaling can improve strategy robustness (Barroso & Santa-Clara, 2015).
Practical Implications
The DTOM framework is particularly well-suited for systematic traders seeking to exploit behavioral inefficiencies while maintaining adaptability to varying market environments. By leveraging sentiment metrics such as the NYSE Down Ticks and combining them with a volatility-adjusted momentum oscillator, the strategy addresses key limitations of traditional trend-following models, such as their lagging nature and susceptibility to reversals in volatile conditions.
References
• Barroso, P., & Santa-Clara, P. (2015). Momentum Has Its Moments. Journal of Financial Economics, 116(1), 111–120.
• Carhart, M. M. (1997). On Persistence in Mutual Fund Performance. The Journal of Finance, 52(1), 57–82.
• De Bondt, W. F., & Thaler, R. (1985). Does the Stock Market Overreact? The Journal of Finance, 40(3), 793–805.
• Jegadeesh, N., & Titman, S. (1993). Returns to Buying Winners and Selling Losers: Implications for Stock Market Efficiency. The Journal of Finance, 48(1), 65–91.
• Moskowitz, T. J., Ooi, Y. H., & Pedersen, L. H. (2012). Time Series Momentum. Journal of Financial Economics, 104(2), 228–250.

Moving Average Pullback Signals [UAlgo]The "Moving Average Pullback Signals " indicator is designed to identify potential trend continuation or reversal points based on moving average (MA) pullback patterns. This tool combines multiple types of moving averages, customized trend validation parameters, and candlestick wick patterns to provide reliable buy and sell signals. By leveraging several advanced MA methods (such as TEMA, DEMA, ZLSMA, and McGinley-D), this script can adapt to different market conditions, providing traders with flexibility and more precise trend-based entries and exits. The addition of a gradient color-coded moving average line and wick validation logic enables traders to visualize market sentiment and trend strength dynamically.
🔶 Key Features
Multiple Moving Average (MA) Calculation Methods: This indicator offers various MA calculation types, including SMA, EMA, DEMA, TEMA, ZLSMA, and McGinley-D, allowing traders to select the MA that best fits their strategy.
Trend Validation and Pattern Recognition: The indicator includes a customizable trend validation length, ensuring that the trend is consistent before buy/sell signals are generated. The "Trend Pattern Mode" setting provides flexibility between "No Trend in Progress," "Trend Continuation," and "Both," tailoring signals to the trader’s preferred style.
Wick Validation Logic: To enhance the accuracy of entries, this indicator identifies specific wick patterns for bullish or bearish pullbacks, which signal potential trend continuation or reversal. Wick length and validation factor are adjustable to suit various market conditions and timeframes.
Gradient Color-coded MA Line: This feature provides a quick visual cue for trend strength, with color changes reflecting relative highs and lows of the MA, enhancing market sentiment interpretation.
Alerts for Buy and Sell Signals: Alerts are triggered when either a bullish or bearish pullback is detected, allowing traders to receive instant notifications without continuously monitoring the chart.
Visual Labels for Reversal Points: The indicator plots labels ("R") at potential reversal points, with color-coded labels for bullish (green) and bearish (red) pullbacks, highlighting pullback opportunities that align with the trend or reversal potential.
🔶 Disclaimer
Use with Caution: This indicator is provided for educational and informational purposes only and should not be considered as financial advice. Users should exercise caution and perform their own analysis before making trading decisions based on the indicator's signals.
Not Financial Advice: The information provided by this indicator does not constitute financial advice, and the creator (UAlgo) shall not be held responsible for any trading losses incurred as a result of using this indicator.
Backtesting Recommended: Traders are encouraged to backtest the indicator thoroughly on historical data before using it in live trading to assess its performance and suitability for their trading strategies.
Risk Management: Trading involves inherent risks, and users should implement proper risk management strategies, including but not limited to stop-loss orders and position sizing, to mitigate potential losses.
No Guarantees: The accuracy and reliability of the indicator's signals cannot be guaranteed, as they are based on historical price data and past performance may not be indicative of future results.

Volumetric Volatility Blocks [UAlgo]The Volumetric Volatility Blocks indicator is designed to identify significant volatility blocks based on price and volume data. It utilizes a combination of the Average True Range (ATR) and Simple Moving Average (SMA) to determine the volatility level and identify periods of heightened market activity. The indicator highlights these volatility blocks, providing traders with visual cues for potential trading opportunities. It differentiates between bullish and bearish volatility by analyzing price movement and volume, offering a nuanced view of market sentiment. This tool is particularly useful for traders looking to capitalize on periods of high volatility and momentum shifts.
🔶 Key Features
Volatility Measurement Length: Controls the period used to calculate the ATR.
Smooth Length of Volatility: Defines the period for the SMA used to smooth the ATR.
Multiplier of SMA: Sets the minimum threshold for the ATR to be considered a "high volatility" block.
Show Last X Volatility Blocks: Determines how many of the most recent volatility blocks are displayed on the chart.
Mitigation Method: Choose between "Close" or "Wick" price to filter volatility blocks based on price action. This helps avoid highlighting blocks broken by the chosen price level.
Volume Info: Displaying the volume associated with each block.
Up/Down Block Color: Sets the color for bullish and bearish volatility blocks.
🔶 Usage
The Volumetric Volatility Blocks indicator visually represents periods of high volatility with blocks on the chart. Green blocks indicate bullish volatility, while red blocks indicate bearish volatility.
Bullish Volatility Blocks: When the ATR surpasses the smoothed ATR multiplied by the set multiplier, and the price closes higher than it opened, a bullish block is formed. These blocks are generally used to identify potential buying opportunities as they indicate upward momentum.
Bearish Volatility Blocks: Conversely, bearish blocks form under the same conditions, but when the price closes lower than it opened. These blocks can signal potential selling opportunities as they highlight downward momentum.
Volume Information: Each block can display volume data, providing insight into the strength of the market movement. The percentage shown on the block indicates the relative volume contribution of that block, helping traders assess the significance of the volatility.
The volume percentages in the Volumetric Volatility Blocks indicator are calculated based on the total volume of the most recent volatility blocks. For each of the most recent volatility blocks, the percentage of the total volume is calculated by dividing the block's volume by the total volume:
🔶 Disclaimer
Use with Caution: This indicator is provided for educational and informational purposes only and should not be considered as financial advice. Users should exercise caution and perform their own analysis before making trading decisions based on the indicator's signals.
Not Financial Advice: The information provided by this indicator does not constitute financial advice, and the creator (UAlgo) shall not be held responsible for any trading losses incurred as a result of using this indicator.
Backtesting Recommended: Traders are encouraged to backtest the indicator thoroughly on historical data before using it in live trading to assess its performance and suitability for their trading strategies.
Risk Management: Trading involves inherent risks, and users should implement proper risk management strategies, including but not limited to stop-loss orders and position sizing, to mitigate potential losses.
No Guarantees: The accuracy and reliability of the indicator's signals cannot be guaranteed, as they are based on historical price data and past performance may not be indicative of future results.

SuperTrend Polyfactor Oscillator [LuxAlgo]The SuperTrend Polyfactor Oscillator is an oscillator based on the popular SuperTrend indicator that aims to highlight information returned by a collection of SuperTrends with varying factors inputs.
A general consensus is calculated from all this information, returning an indication of the current market sentiment.
🔶 USAGE
Multiple elements are highlighted by the proposed oscillator. A mesh of bars is constructed from the difference between the price and a total of 20 SuperTrends with varying factors. Brighter colors of the mesh indicate a higher amount of aligned SuperTrends indications.
The factor input of the SuperTrends is determined by the user from the Starting Factor setting which determines the factor of the shorter-term SuperTrend, and the Increment settings which control the step between each factor inputs.
Using higher values for these settings will return information for longer-term term price variations.
🔹 Consensus
From the collection of SuperTrends, a consensus is obtained. It is calculated as the median of all the differences between the price and the collection of SuperTrends.
This consensus is highlighted in the script by a blue and orange line, with a blue color indicating an overall bullish market, and orange indicating a bearish market.
Both elements can be used together to highlight retracements within a trend. If we see various red bars while the general consensus is bullish, we can interpret it as the presence of a retracement.
🔹 StDev Area
The indicator includes an area constructed from the standard deviation of all the differences between the price and the collection of SuperTrends.
This area can be useful to see if the market is overall trending or ranging, with a consensus over the area indicative of a trending market.
🔹 Normalization
Users can decide to normalize the results and constrain them within a specific range, this can allow obtaining a lower degree of variations of the indicator outputs. Two methods are proposed "Absolute Sum", and "Max-Min".
The "Absolute Sum" method will divide any output returned by the indicator by the absolute sum of all the differences between the price and SuperTrends. This will constrain all the indicator elements in a (1, -1) scale.
The "Max-Min" method will apply min-max normalization to the indicator outputs (with the exception of the stdev area). This will constrain all the indicator elements in a (0, 1) scale.
🔶 SETTINGS
Length: ATR Length of all calculated SuperTrends.
Starting Factor: Factor input of the shorter-term SuperTrend.
Increment: Step value between all SuperTrends factors.
Normalize: Normalization method used to rescale the indicator output.
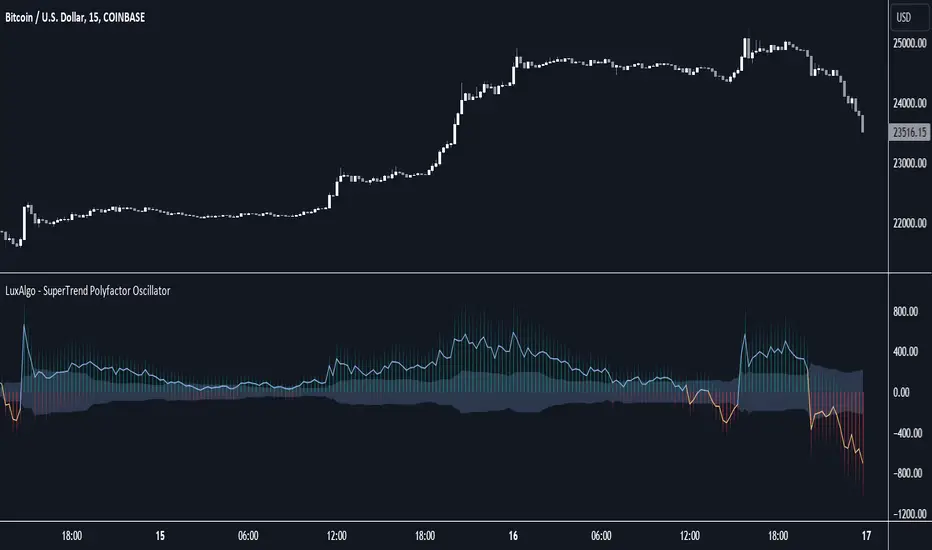
Put to Call Ratio CorrelationHello!
Excited to share this with the community!
This is actually a very simple indicator but actually usurpingly helpful, especially for those who trade indices such as SPX, IWM, QQQ, etc.
Before I get into the indicator itself, let me explain to you its development.
I have been interested in the use of option data to detect sentiment and potential reversals in the market. However, I found option data on its own is full of noise. Its very difficult if not impossible for a trader to make their own subjective assessment about how option data is reflecting market sentiment.
Generally speaking, put to call ratios generally range between 0.8 to 1.1 on average. Unless there is a dramatic pump in calls or puts causing an aggressive spike up to over this range, or fall below this range, its really difficult to make the subjective assessment about what is happening.
So what I thought about trying to do was, instead of looking directly at put to call ratio, why not see what happens when you perform a correlation analysis of the PTC ratio to the underlying stock.
So I tried this in pinescript, pulling for Tradingview's ticker PCC (Total Equity Put to Call Ratio) and using the ta.correlation function against whichever ticker I was looking at.
I played around with this idea a bit, pulled the data into excel and from this I found something interesting. When there is a very significant negative or positive correlation between PTC ratio and price movement, we see a reversal impending. In fact, a significant negative or positive correlation (defined as a R value of 0.8 or higher or -0.8 or lower) corresponded to a stock reversal about 92% of the time when data was pulled on a 5 minute timeframe on SPY.
But wait, what is a correlation?
If you are not already familiar, a correlation is simply a statistical relationship. It is defined with a Pearson R correlation value which ranges from 0 (no correlation) to 1 (significant positive correlation) and 0 to -1 (significant negative correlation).
So what does positive vs negative mean?
A significant positive correlation means the correlation is moving the same as the underlying. In the case of this indicator, if there is a significant positive correlation could mean the stock price is climbing at the same time as the PTC ratio.
Inversely, it could mean the stock price is falling as well as the PTC ratio.
A significant negative correlation means the correlation is moving in the opposite direction. So in this case, if the stock price is climbing and the PTC ratio is falling proportionately, we would see a significant negative correlation.
So how does this work in real life?
To answer this, let's get into the actual indicator!
In the image above, you will see the arrow pointing to an area of significant POSITIVE correlation.
The indicator will paint the bars on the actual chart purple (customizable of course) to signify this is an area of significant correlation.
So, in the above example this means that the PTC ratio is increase proportionately to the increase in the stock price in the SAME direction (Puts are going up proportionately to the stock price). Thus, we can make the assumption that the underlying sentiment is overwhelmingly BEARISH. Why? Because option trading activity is significantly proportionate to stock movement, meaning that there is consensus among the options being traded and the movement of the market itself.
And in the above example we will see, the stock does indeed end up selling:
In this case, IWM fell roughly 1 point from where there was bearish consensus in the market.
Let's use this same trading day and same example to show the inverse:
You will see a little bit later, a significant NEGATIVE correlation developed.
In this case identified, the stock wise RISING and the PTC ratio was FALLING.
This means that Puts were not being bought up as much as calls and the sentiment had shifted to bullish .
And from that point, IWM ended up going up an additional 0.75 points from where there was a significant INVERSE correlation.
So you can see that it is helpful for identifying reversals. But what is also can be used for is identifying areas of LOW conviction. Meaning, areas where there really is no relationship between option activity and stock movement. Let's take spy on the 1 hour timeframe for this example:
You can see in the above example there really is no consensus in the option trading activity with the overarching sentiment. The price action is choppy and so too is option trading activity. Option traders are not pushing too far in one direction or the other. We can also see the lack of conviction in the option trading activity by looking at the correlation SMA (the white line).
When a ticker is experiencing volatile and good movement up and down, the SMA will generally trade to the top of the correlation range (roughly + 1.0) and then make a move down to the bottom (roughly - 1.0), see the example below:
When the SMA is not moving much and accumulating around the centerline, it generally means a lot of indecision.
Additional Indicator Information:
As I have said, the indicator is very simple. It pulls the data from the ticker PCC and runs a correlation assessment against whichever ticker you are on.
PCC pulls averaged data from all equities within the market and is not limited to a single equity. As such, its helpful to use this with indices such as SPY, IWM and QQQ, but I have had success with using it on individual tickers such as NVDA and AMD.
The correlation length is defaulted to 14. You can modify it if you wish, but I do recommend leaving it at this as the default and the testing I have done with this have all been on the 14 correlation length.
You can chose to smooth the SMA over whichever length of period you wish as well.
When the indicator is approaching a significant negative or positive relationship, you will see the indicator flash red in the upper or lower band to signify the relationship. As well, the chart will change the bar colour to purple:
Everything else is pretty straight forward.
Let me know your questions/comments or suggestions around the indicator and its applications.
As always, no indicator is meant to provide a single, reliable strategy to your trading regimen and no indicator or group of indicators should be relied on solely. Be sure to do your own analysis and assessments of the stock prior to taking any trades.
Safe trades everyone!

RSI Trend Veracity (RSI TV)The RSI only plots itself between a high and a low value. It does not show its bullish/bearish sentiment.
The RSI TV shows the sentiment and helps anticipate the RSI trend but not the price trend.
When the Trend Veracity Line is in green, there is bullish sentiment. When it is in red, there is bearish sentiment.
The closer the lines get to their extremities, the more the current trend of the RSI is exhausted.
It works quite well even in choppy markets. See notes in the picture for more details.

NAS100 Component Sentiment Scanner# NAS100 Component Sentiment Scanner
## 🎯 Overview
The NAS100 Component Sentiment Scanner analyzes the top-weighted stocks in the NASDAQ-100 index to provide real-time bullish/bearish sentiment signals that can help predict NAS100 price movements. This indicator combines multiple technical analysis methods to give traders a comprehensive view of underlying market sentiment.
## 📊 How It Works
The indicator calculates sentiment scores for major NASDAQ-100 components (AAPL, MSFT, NVDA, GOOGL, AMZN, META, TSLA, AVGO, COST, NFLX) using:
- **RSI Analysis**: Identifies overbought/oversold conditions
- **Moving Average Trends**: Compares fast vs slow MA positioning
- **Volume Confirmation**: Validates moves with volume thresholds
- **Price Momentum**: Analyzes recent price direction
- **Market Cap Weighting**: Uses actual NASDAQ-100 weightings for accuracy
## 🚀 Key Features
### Real-Time Sentiment Analysis
- Weighted composite score based on individual stock analysis
- Color-coded sentiment line (Green = Bullish, Red = Bearish)
- Dynamic background coloring for strong signals
### Interactive Data Table
- Shows individual stock scores and signals
- Bullish/Bearish stock count summary
- Customizable position and size
### Smart Signal System
- **Bullish Signals**: Green triangle up when sentiment crosses threshold
- **Bearish Signals**: Red triangle down when sentiment falls below threshold
- **Alert Conditions**: Automatic notifications for signal changes
## ⚙️ Customization Options
### Technical Analysis Settings
- **RSI Period**: Adjust lookback period (default: 14)
- **RSI Levels**: Set overbought/oversold thresholds
- **Moving Averages**: Configure fast/slow MA periods
- **Volume Threshold**: Set volume confirmation multiplier
### Signal Thresholds
- **Bullish/Bearish Levels**: Customize trigger points
- **Strong Signal Levels**: Set extreme sentiment thresholds
- Fine-tune sensitivity to market conditions
### Display Options
- **Toggle Table**: Show/hide sentiment data table
- **Table Position**: 6 position options (Top/Bottom/Middle + Left/Right)
- **Table Size**: Choose from Tiny, Small, Normal, or Large
- **Background Colors**: Enable/disable signal backgrounds
- **Signal Arrows**: Show/hide buy/sell indicators
### Stock Selection
- **Individual Control**: Enable/disable any of the 10 major stocks
- **Dynamic Weighting**: Automatically adjusts calculations based on selected stocks
- **Flexible Analysis**: Focus on specific sectors or market leaders
## 📈 How to Use
### 1. Basic Setup
1. Add the indicator to your NAS100 chart
2. Default settings work well for most traders
3. Observe the sentiment line and signals
### 2. Signal Interpretation
- **Score > 30**: Bullish bias for NAS100
- **Score > 50**: Strong bullish signal
- **Score -30 to 30**: Neutral/consolidation
- **Score < -30**: Bearish bias for NAS100
- **Score < -50**: Strong bearish signal
### 3. Trading Strategies
**Trend Following:**
- Buy NAS100 when bullish signals appear
- Sell/short when bearish signals trigger
- Use background colors for quick visual confirmation
**Divergence Trading:**
- Watch for sentiment/price divergences
- Strong sentiment with weak NAS100 price = potential breakout
- Weak sentiment with strong NAS100 price = potential reversal
**Consensus Trading:**
- Monitor bullish/bearish stock counts in table
- 8+ stocks aligned = strong directional bias
- Mixed signals = wait for clearer consensus
### 4. Advanced Usage
- Combine with your existing NAS100 trading strategy
- Use multiple timeframes for confirmation
- Adjust thresholds based on market volatility
- Focus on specific stocks by disabling others
## 🔔 Alert Setup
The indicator includes built-in alert conditions:
1. Go to TradingView Alerts
2. Select "NAS100 Component Sentiment Scanner"
3. Choose from available alert types:
- NAS100 Bullish Signal
- NAS100 Bearish Signal
- Strong Bullish Consensus
- Strong Bearish Consensus
## 💡 Pro Tips
### Optimization
- **High Volatility**: Increase signal thresholds (±40, ±60)
- **Low Volatility**: Decrease thresholds (±20, ±40)
- **Day Trading**: Use smaller table, focus on real-time signals
- **Swing Trading**: Enable background colors, larger thresholds
### Best Practices
- Don't use as a standalone system - combine with price action
- Check individual stock table for context
- Monitor during market open for most reliable signals
- Consider earnings seasons for individual stock impacts
### Market Conditions
- **Trending Markets**: Higher accuracy, use with trend following
- **Ranging Markets**: Watch for false signals, increase thresholds
- **News Events**: Individual stock news can skew sentiment temporarily
## 🎨 Visual Guide
- **Green Line Above Zero**: Bullish sentiment building
- **Red Line Below Zero**: Bearish sentiment building
- **Background Color Changes**: Strong signal confirmation
- **Triangle Arrows**: Entry/exit signal points
- **Table Colors**: Quick sentiment overview
## ⚠️ Important Notes
- This indicator analyzes component stocks, not NAS100 directly
- Market cap weightings approximate real NASDAQ-100 weightings
- Sentiment can change rapidly during volatile periods
- Always use proper risk management
- Combine with other technical analysis tools
## 🔧 Troubleshooting
- **No signals**: Check if thresholds are too extreme
- **Too many signals**: Increase threshold sensitivity
- **Table not showing**: Ensure "Show Sentiment Table" is enabled
- **Missing stocks**: Verify individual stock toggles in settings
---
**Suitable for**: Day traders, swing traders, NAS100 specialists, index traders
**Best Timeframes**: 5min, 15min, 1H, 4H
**Market Sessions**: US market hours for highest accuracy

Overheat Oscillator with DivergenceIndicator Description
The Overheat Oscillator with Divergence is an advanced technical indicator designed for the TradingView platform, assisting traders in identifying potential market reversal points by analyzing price momentum and volume, as well as detecting divergences. The indicator combines trend strength assessment with signal smoothing to provide clear indications of market overheat or oversold conditions. An optional divergence detection feature allows for the identification of discrepancies between price movement and the oscillator's value, which may signal upcoming trend changes.
The indicator is displayed in a separate panel below the price chart and offers visual cues through a color gradient, horizontal reference lines, and a dynamic market sentiment table. Users can customize numerous parameters, such as calculation periods, sentiment thresholds, line colors, and visualization styles, making the indicator a versatile tool for various trading strategies.
How the Indicator Works
The indicator is based on the following key components:
Oscillator Calculations
The indicator analyzes price candles, assigning a score based on their nature. A bullish candle (when the closing price is higher than the opening price) receives a score of +1.0, while a bearish candle (when the closing price is lower than the opening price) receives a score of -1.0. This scoring reflects the strength of price movement over a given period.
The score is modified by a volume multiplier (default: 2.0) if the candle's volume exceeds the volume's simple moving average (SMA, default: calculated over 20 candles). This ensures that candles with higher volume have a greater impact on the oscillator's value, better capturing significant market movements driven by increased trading activity. For example, a bullish candle with high volume may receive a score of +2.0 instead of +1.0, amplifying the bullish signal.
The scores are summed over a specified number of candles (default: 20), normalized to a 0–100 range, and then smoothed using a simple moving average (SMA, default: 5 periods) to reduce noise and improve signal clarity.
Color Gradient
The oscillator's values are visualized using a color gradient that changes based on the oscillator's level:
Green: Market cooldown (values below the Gradient Min threshold).
Yellow: Neutral sentiment (values between Gradient Min and Gradient Yellow).
Orange: Elevated activity (values between Gradient Yellow and Gradient Orange).
Red: Market overheat (values above Gradient Orange).
The color gradient is applied as the background in the oscillator panel, facilitating quick assessment of market sentiment.
Reference Levels
The indicator displays customizable horizontal lines for key thresholds (e.g., Overheat Threshold, Oversold Threshold, Gradient Min, Yellow, Orange, Max). These lines are visible only at the height of the last few oscillator candles, preventing chart clutter and helping users focus on current values.
Users can also define three custom horizontal lines with selectable styles (solid, dotted, dashed) and colors. These lines serve as auxiliary tools, e.g., for marking personal support/resistance levels, but do not affect the oscillator's signals or background colors.
Market Sentiment
The indicator displays sentiment labels in a table located in the top-right corner of the panel, dynamically updating based on the oscillator's value:
Cooled: Values below Gradient Yellow (default: 35).
Neutral: Values between Gradient Yellow and Gradient Orange (default: 60).
Excited: Values between Gradient Orange and Overheat Threshold (default: 70).
Overheated: Values above Overheat Threshold (default: 70).
The Overheat Threshold and Oversold Threshold are critical for displaying the "Overheated" and "Cooled" labels in the sentiment table, enabling users to quickly identify extreme market conditions. The labels update when key thresholds are crossed, and their colors match the oscillator's gradient.
Divergence Detection
The indicator offers optional detection of regular bullish and bearish divergences:
Bullish Divergence: Occurs when the price forms a lower low, but the oscillator forms a higher low, suggesting a weakening downtrend.
Bearish Divergence: Occurs when the price forms a higher high, but the oscillator forms a lower high, suggesting a weakening uptrend.
Divergences are marked on the chart with labels ("Bull" for bullish, "Bear" for bearish) and lines indicating pivot points. They are calculated with a delay equal to the Lookback Right setting (default: 5 candles), meaning signals appear after pivot confirmation in the specified lookback period. The indicator also generates alerts for users when a divergence is detected.
Indicator Settings
Main Settings (SETTINGS)
Period Length: Specifies the number of candles used for oscillator calculations (default: 20).
Volume SMA Period: The period for the volume's simple moving average (default: 20).
Volume Multiplier: Multiplier applied to candle scores when volume exceeds the average (default: 2.0).
SMA Length: The period for smoothing the oscillator with a simple moving average (default: 5).
Thresholds (THRESHOLDS)
Overheat Threshold: Level indicating market overheat (default: 70). This value determines when the sentiment table displays the "Overheated" label, signaling a potential peak in an uptrend.
Oversold Threshold: Level indicating market cooldown (default: 30). This value determines when the sentiment table displays the "Cooled" label, signaling a potential bottom in a downtrend.
Gradient Min (Green): Lower threshold for the green gradient (default: 20).
Gradient Yellow Threshold: Threshold for the yellow gradient (default: 35).
Gradient Orange Threshold: Threshold for the orange gradient (default: 60).
Gradient Max (Red): Upper threshold for the red gradient (default: 70).
Visualization (VISUALIZATION)
Signal Line Color: Color of the oscillator line (default: dark red, RGB(5, 0, 0)).
Show Reference Lines: Enables/disables the display of threshold lines (default: enabled).
Divergence Settings (DIVERGENCE SETTINGS)
Calculate Divergence: Enables/disables divergence detection (default: disabled).
Lookback Right: Number of candles back for pivot analysis (default: 5).
Lookback Left: Number of candles to the left for pivot analysis (default: 5).
Line Style (STYLE)
Custom Line 1, 2, 3 Value: Levels for custom horizontal lines (default: 70, 50, 30).
Custom Line 1, 2, 3 Color: Colors for custom lines (default: black, RGB(0, 0, 0)).
Custom Line 1, 2, 3 Style: Line styles (solid, dotted, dashed; default: dashed, dotted, dashed).
How to Use the Indicator
Adding to the Chart
Add the indicator to your TradingView chart by searching for "Overheat Oscillator with Divergence."
Configure the settings according to your trading strategy.
Signal Interpretation
Overheated: Values above the Overheat Threshold (default: 70) in the sentiment table may indicate a potential uptrend peak.
Cooled: Values below the Oversold Threshold (default: 30) in the sentiment table may suggest a potential downtrend bottom.
Divergences:
Bullish: Look for "Bull" labels on the chart, indicating potential upward reversals (calculated with a Lookback Right delay).
Bearish: Look for "Bear" labels, indicating potential downward reversals (calculated with a Lookback Right delay).
Customization
Experiment with settings such as period length, volume multiplier, or gradient thresholds to tailor the indicator to your trading style (e.g., scalping, medium-term trading).
Usage Examples
Scalping: Set a shorter period (e.g., Period Length = 10, SMA Length = 3) and monitor rapid sentiment changes and divergences on lower timeframes (e.g., 5-minute charts).
Medium-Term Trading: Use default settings or increase Period Length (e.g., 30) and SMA Length (e.g., 7) for more stable signals on hourly or daily charts.
Reversal Detection: Enable divergence detection and observe "Bull" or "Bear" labels in conjunction with overheat/cooled levels in the sentiment table.
Notes
The indicator performs best when used in conjunction with other technical analysis tools, such as support/resistance lines, moving averages, or Fibonacci levels.
Divergences may serve as early signals but do not always guarantee immediate trend reversals—confirmation with other indicators is recommended.
Test different settings on historical data to find the optimal configuration for your chosen market and timeframe.

Universal Sentiment Oscillator with Trade RecommendationsUniversal Sentiment Oscillator & Strategy Guide
Summary
This all-in-one indicator is designed to be a comprehensive co-pilot for your trading journey. It moves beyond simple buy/sell signals by analyzing the underlying market sentiment and providing a dynamic, risk-assessed guide of potential trading strategies. Whether you're a novice learning the ropes or an expert seeking confirmation, this tool provides a structured framework for making smarter, more informed decisions in stocks, options, and futures.
How It Works
The core of the indicator is the Sentiment Oscillator, which calculates a score from -5 (Extremely Bearish) to +5 (Extremely Bullish) on every bar. This isn't just a single measurement; it's a weighted aggregate of several key technical conditions:
Trend Analysis: Price position relative to the 20, 50, and 200 EMAs.
Momentum Analysis: The current RSI value.
Hybrid Analysis: The state of the MACD and its signal line.
These factors are intelligently combined and normalized to produce a single, intuitive sentiment score, giving you an at-a-glance understanding of the market's pulse.
Core Features
Dynamic Trade Recommendation Table:
The informational heart of the indicator. This on-chart table provides a list of potential trades perfectly aligned with the current sentiment score.
Risk-Ranked Strategies:
All suggested trades are logically ordered by risk, helping you quickly identify strategies that match your comfort level.
Adjusted Trade Suggestions:
The indicator analyzes sentiment momentum (the score vs. its signal line) to provide proactive, forward-looking trade ideas based on where the market might be heading next.
Customizable Trading Styles:
Tell the indicator if you are a Conservative, Neutral, or Aggressive trader, and the "Adjusted Trade Suggestion" will automatically tailor its recommendations to your personal risk preference.
Context-Aware Futures Mode:
When viewing a futures contract, enable this mode to switch all recommendations from stock/options to futures-specific actions (e.g., "Cautious Long," "Monitor Range").
Predictive Sentiment Cone:
Visualize the potential short-term path of sentiment based on current momentum, helping you anticipate future conditions.
Fully Customizable:
Every parameter—from EMA lengths to trade filters—can be adjusted, allowing you to fine-tune the indicator to your exact specifications.
How to Use This Indicator
This tool is flexible and can be integrated into many trading systems. Here is a powerful, professional approach:
Top-Down Analysis (for Swing or Position Trading):
Establish the Trend: Start on the higher timeframes (Monthly, Weekly, Daily). Use the oscillator's color and score to define the dominant, long-term market sentiment. You only want to look for trades that align with this macro trend.
Refine the Entry: Drop down to the medium timeframes (4-Hour, 1-Hour). Wait for the sentiment on these charts to come into alignment with the higher-timeframe trend. This pullback or consolidation is your "zone of interest."
Pinpoint the Execution: Move to a lower timeframe (e.g., 15-Minute). Use the Adjusted Trade Suggestion and Sentiment Momentum to find a precise entry as momentum begins to shift back in the direction of the primary trend. You can set alerts on the oscillator's zero-line for early warnings of a sentiment shift.
As a Confirmation Tool: If you have an existing trade idea, use the indicator to validate it. Does the sentiment score align with your bullish or bearish thesis? Does the momentum confirm that now is a good time to enter?
As an Idea Generation Tool: Unsure what to trade? Browse different assets and let the indicator's "Primary Trades" and "Adjusted Trade Suggestion" present you with a list of risk-assessed ideas that you can then investigate further.
Disclaimer: This is an analysis tool and should not be considered financial advice. All forms of trading involve substantial risk. You should not trade with money you cannot afford to lose. Always perform your own due diligence and use this indicator as one component of a complete trading plan.
