Adjustable Vertical LinesThe script provides an indicator which will plot lines - 15 min, 30 min and 60 min. You can customize the time intervals and go to as low as one minute, but I found the 15-minute and 30-minute intervals works best for me when trying to find setups, and the lower time-frame intervals, is just pointless to use if you're not scalping on the seconds timeframe.
You can customize inputs for the line style. Line thickness, colour, etc.
I've seen this work using the OBR theory and applying it to the one-minute candle then looking for other confluences like order blocks, or breakers, FVGs, BOS/CHoC for further confirmation for scalping. It's important to backtest though and see for yourself.
Thanks for the boost.
Buscar en scripts para "scalping"

Candle Count RSI📈 Candle Count RSI — A Dual-Perspective Momentum Engine
The Candle Count RSI is a custom-built momentum oscillator that expands on the classic Relative Strength Index (RSI) by introducing a directional-only variant that tracks the frequency of bullish or bearish closes, rather than price magnitude. It gives traders a second lens through which to evaluate momentum, trend conviction, and subtle divergences—often invisible to traditional price-based RSI.
💡 What Makes It Unique?
While the standard RSI is sensitive to the size of price changes, the Candle Count RSI is magnitude-blind. It counts candle closes above/below open over a lookback period, generating a purer signal of directional consistency. To enhance signal fidelity, it includes a streak amplifier, dynamically weighting extended runs of green or red candles to reflect intensity of market bias—without introducing artificial price sensitivity.
This dual-RSI approach allows for:
- Divergence detection between directional bias and price magnitude.
- Smoother trend confirmation in choppy markets.
- Cleaner visual cues using dynamic glow and background logic.
📐 How Standard RSI Actually Works (Not What You Think)
RSI doesn’t just check if price went up or down over a span—it checks each individual candle and tracks whether it closed higher or lower than the one before. Here's how it works under the hood:
1.) For each bar, it calculates the change from the previous close.
2.) It separates those changes into gains (upward moves) and losses (downward moves).
3.) Then it computes a smoothed average of those gains and losses (usually using an RMA).
4.) It calculates the Relative Strength (RS) as:
RS = AvgGain / AvgLoss
5.) Finally, it plugs that into the RSI formula:
RSI = 100 - (100 / (1 + RS))
⚖️ What Does the 50 Line Mean?
- The RSI scale runs from 0 to 100, but 50 is the true neutral zone:
- RSI > 50 means average gains outweigh average losses over the period.
- RSI < 50 means losses dominate.
- RSI ≈ 50? The market is balanced—momentum is indecisive, no clear trend bias.
- This makes 50 a powerful midline for trend filters, directional bias tools, and divergence detection—especially when paired with alternative RSI logic like Candle Count RSI.
🔧 Inputs and Customization
- Everything is fully modular and customizable:
🧠 Core Settings
- RSI Length: Used for both the standard RSI and Candle Count RSI.
📉 Standard RSI
- Classic RSI calculation based on price changes.
- Optional WMA smoothing to reduce noise.
- Glow effect toggle with custom intensity.
🕯 Candle Count RSI
- Computes RSI using only the count of up/down candles.
- Optional smoothing for stability.
- Amplifies streaks (e.g., multiple consecutive bullish candles increase strength).
- Glow effect toggle with adjustable strength.
🎇 Glow Visuals
- Background glow (subpane and/or main chart).
- Fades based on RSI distance from the 50 midpoint.
- Independent color settings for bull and bear bias.
🧬 Divergence Zones
- Detects when Candle RSI and Standard RSI diverge.
- Highlights:
- Bullish Divergence: Candle RSI > 50, Standard RSI < threshold.
- Bearish Divergence: Candle RSI < 50, Standard RSI > threshold.
- Background fill optionally shown in subpane and/or main chart.
📊 Directional Histogram
- MACD-style histogram showing the difference between the two RSI lines.
- Color-coded based on directional agreement:
- Both rising → green.
- Both falling → red.
- Conflict → yellow.
🧠 Under the Hood — How It Works
🔹 Standard RSI
- Classic ta.rsi() applied to close prices, optionally WMA-smoothed.
🔹 Candle Count RSI (CCR)
- Counts how many candles closed up/down over the period.
- Computes a magnitude-free RSI from these counts.
- Applies a streak-based multiplier to exaggerate trend strength during consecutive green/red runs.
- Optionally smoothed with WMA to create a clean signal line.
- This makes CCR ideal for detecting true directional bias without being faked out by volatile price spikes.
🔹 Divergence Logic
- When Candle RSI and Standard RSI disagree strongly across defined thresholds, background fills highlight early signs of momentum decay or hidden accumulation/distribution.
🔹 Glow Logic
- Glow zones are controlled by a master toggle and drawn with dynamic transparency:
- Further from 50 = stronger conviction = darker glow.
- Shows up in subpane and/or main chart depending on user preference.
📷 Suggested Use Case / Visual Setup
- Use in conjunction with your primary price action system.
- Watch for divergences between the Candle Count RSI and Standard RSI for early trend reversals.
- Use glow bias zones on the main chart to get subconscious directional cues during fast scalping.
- Histogram helps you confirm when both RSI variants agree—useful during strong trending conditions.
🛠️ Tip for Traders
- This tool isn’t trying to “predict” price. It’s designed to visualize hidden market psychology—when buyers are showing up with consistent pressure, or when momentum has a disconnect between conviction and magnitude. Use this to filter entries, spot weak rallies, or sense when a trend is about to break down.
⚠️ WARNING
- Not for use with Heikin Ashi, Renko, etc.).
🧠 Summary
Candle Count RSI is not just another mashup—it's a precision-built, dual-perspective oscillator that captures directional conviction using real candle behavior. Whether you're scalping intraday or swing trading momentum, this script helps clarify trend integrity and exposes hidden weaknesses with elegance and clarity.
—
🛠️ Built by: Sherlock_MacGyver
Feel free to share feedback or reach out if you'd like to collaborate on custom features.

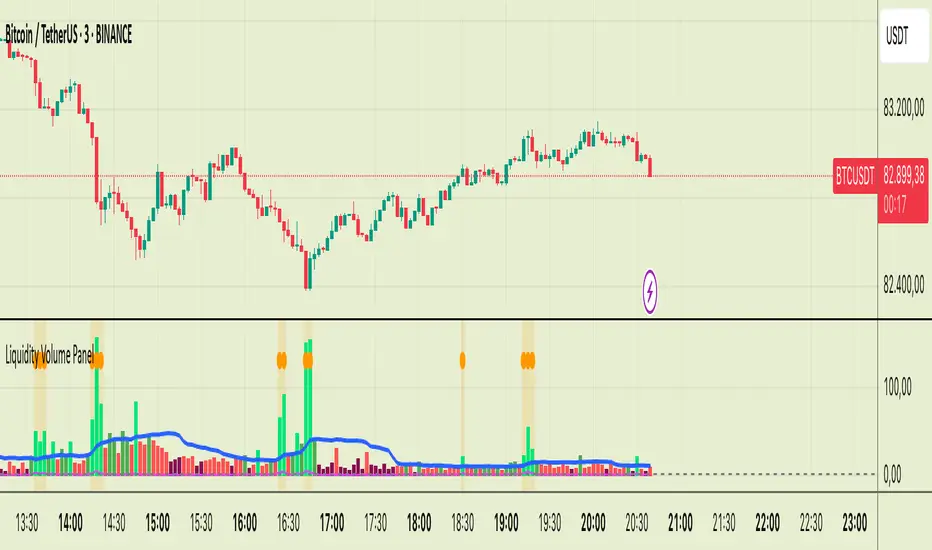
Liquidity Volume Panel Liquidity Volume Panel – Precision Tool for Scalpers & Intraday Traders
This panel is designed to help traders quickly identify volume-driven moves, liquidity events, and fair-value zones. It combines classic volume analysis with enhanced tools like RVOL and VWAP deviation bands, making it ideal for scalping, momentum trading, and intraday strategies.
🔍 Included Features:
✅ Relative Volume (RVOL) Indicator
Displays current volume in relation to its 20-period average – excellent for spotting low-activity zones or high-pressure breakouts.
✅ Dynamic Volume Coloring & Spike Detection
Color-coded volume logic highlights normal, strong, and extremely high volume, with visual markers for volume spikes (>200% of average).
✅ VWAP with ±1σ & ±2σ Bands
Industry-standard deviation bands show overbought/oversold conditions and dynamic support/resistance based on volume-weighted pricing.
✅ Background Highlighting
Subtle orange background alerts you when volume surges beyond extreme levels – making liquidity clusters instantly recognizable.
Usage:
Use this panel as a decision-making tool for entries, reversals, or breakouts – especially in fast-moving markets.
Best used on lower timeframes for precision scalping.
Pivot S/R with Volatility Filter## *📌 Indicator Purpose*
This indicator identifies *key support/resistance levels* using pivot points while also:
✅ Detecting *high-volume liquidity traps* (stop hunts)
✅ Filtering insignificant pivots via *ATR (Average True Range) volatility*
✅ Tracking *test counts and breakouts* to measure level strength
---
## *⚙ SETTINGS – Detailed Breakdown*
### *1️⃣ ◆ General Settings*
#### *🔹 Pivot Length*
- *Purpose:* Determines how many bars to analyze when identifying pivots.
- *Usage:*
- *Low values (5-20):* More pivots, better for scalping.
- *High values (50-200):* Fewer but stronger levels for swing trading.
- *Example:*
- Pivot Length = 50 → Only the most significant highs/lows over 50 bars are marked.
#### *🔹 Test Threshold (Max Test Count)*
- *Purpose:* Sets how many times a level can be tested before being invalidated.
- *Example:*
- Test Threshold = 3 → After 3 tests, the level is ignored (likely to break).
#### *🔹 Zone Range*
- *Purpose:* Creates a price buffer around pivots (±0.001 by default).
- *Why?* Markets often respect "zones" rather than exact prices.
---
### *2️⃣ ◆ Volatility Filter (ATR)*
#### *🔹 ATR Period*
- *Purpose:* Smoothing period for Average True Range calculation.
- *Default:* 14 (standard for volatility measurement).
#### *🔹 ATR Multiplier (Min Move)*
- *Purpose:* Requires pivots to show *meaningful price movement*.
- *Formula:* Min Move = ATR × Multiplier
- *Example:*
- ATR = 10 pips, Multiplier = 1.5 → Only pivots with *15+ pip swings* are valid.
#### *🔹 Show ATR Filter Info*
- Displays current ATR and minimum move requirements on the chart.
---
### *3️⃣ ◆ Volume Analysis*
#### *🔹 Volume Change Threshold (%)*
- *Purpose:* Filters for *unusual volume spikes* (institutional activity).
- *Example:*
- Threshold = 1.2 → Requires *120% of average volume* to confirm signals.
#### *🔹 Volume MA Period*
- *Purpose:* Lookback period for "normal" volume calculation.
---
### *4️⃣ ◆ Wick Analysis*
#### *🔹 Wick Length Threshold (Ratio)*
- *Purpose:* Ensures rejection candles have *long wicks* (strong reversals).
- *Formula:* Wick Ratio = (Upper Wick + Lower Wick) / Candle Range
- *Example:*
- Threshold = 0.6 → 60% of the candle must be wicks.
#### *🔹 Min Wick Size (ATR %)*
- *Purpose:* Filters out small wicks in volatile markets.
- *Example:*
- ATR = 20 pips, MinWickSize = 1% → Wicks under *0.2 pips* are ignored.
---
### *5️⃣ ◆ Display Settings*
- *Show Zones:* Toggles support/resistance shaded areas.
- *Show Traps:* Highlights liquidity traps (▲/▼ symbols).
- *Show Tests:* Displays how many times levels were tested.
- *Zone Transparency:* Adjusts opacity of zones.
---
## *🎯 Practical Use Cases*
### *1️⃣ Liquidity Trap Detection*
- *Scenario:* Price spikes *above resistance* then reverses sharply.
- *Requirements:*
- Long wick (Wick Ratio > 0.6)
- High volume (Volume > Threshold)
- *Outcome:* *Short Trap* signal (▼) appears.
### *2️⃣ Strong Support Level*
- *Scenario:* Price bounces *3 times* from the same level.
- *Indicator Action:*
- Labels the level with test count (3/5 = 3 tests out of max 5).
- Turns *red* if broken (Break Count > 0).
Deep Dive: How This Indicator Works*
This indicator combines *four professional trading concepts* into one powerful tool:
1. *Classic Pivot Point Theory*
- Identifies swing highs/lows where price previously reversed
- Unlike basic pivot indicators, ours uses *confirmed pivots only* (filtered by ATR)
2. *Volume-Weighted Validation*
- Requires unusual trading volume to confirm levels
- Filters out "phantom" levels with low participation
3. *ATR Volatility Filtering*
- Eliminates insignificant price swings in choppy markets
- Ensures only meaningful levels are plotted
4. *Liquidity Trap Detection*
- Spots institutional stop hunts where markets fake out traders
- Uses wick analysis + volume spikes for high-probability signals
---
## *📊 Parameter Encyclopedia (Expanded)*
### *1️⃣ Pivot Engine Settings*
#### *Pivot Length (50)*
- *What It Does:*
Determines how many bars to analyze when searching for swing highs/lows.
- *Professional Adjustment Guide:*
| Trading Style | Recommended Value | Why? |
|--------------|------------------|------|
| Scalping | 10-20 | Captures short-term levels |
| Day Trading | 30-50 | Balanced approach |
| Swing Trading| 50-200 | Focuses on major levels |
- *Real Market Example:*
On NASDAQ 5-minute chart:
- Length=20: Identifies levels holding for ~2 hours
- Length=50: Finds levels respected for entire trading day
#### *Test Threshold (5)*
- *Advanced Insight:*
Institutions often test levels 3-5 times before breaking them. This setting mimics the "probe and push" strategy used by smart money.
- *Psychology Behind It:*
Retail traders typically give up after 2-3 tests, while institutions keep testing until stops are run.
---
### *2️⃣ Volatility Filter System*
#### *ATR Multiplier (1.0)*
- *Professional Formula:*
Minimum Valid Swing = ATR(14) × Multiplier
- *Market-Specific Recommendations:*
| Market Type | Optimal Multiplier |
|------------------|--------------------|
| Forex Majors | 0.8-1.2 |
| Crypto (BTC/ETH) | 1.5-2.5 |
| SP500 Stocks | 1.0-1.5 |
- *Why It Matters:*
In EUR/USD (ATR=10 pips):
- Multiplier=1.0 → Requires 10 pip swings
- Multiplier=1.5 → Requires 15 pip swings (fewer but higher quality levels)
---
### *3️⃣ Volume Confirmation System*
#### *Volume Threshold (1.2)*
- *Institutional Benchmark:*
- 1.2x = Moderate institutional interest
- 1.5x+ = Strong smart money activity
- *Volume Spike Case Study:*
*Before Apple Earnings:*
- Normal volume: 2M shares
- Spike threshold (1.2): 2.4M shares
- Actual volume: 3.1M shares → STRONG confirmation
---
### *4️⃣ Liquidity Trap Detection*
#### *Wick Analysis System*
- *Two-Filter Verification:*
1. *Wick Ratio (0.6):*
- Ensures majority of candle shows rejection
- Formula: (UpperWick + LowerWick) / Total Range > 0.6
2. *Min Wick Size (1% ATR):*
- Prevents false signals in flat markets
- Example: ATR=20 pips → Min wick=0.2 pips
- *Trap Identification Flowchart:*
Price Enters Zone →
Spikes Beyond Level →
Shows Long Wick →
Volume > Threshold →
TRAP CONFIRMED
---
## *💡 Master-Level Usage Techniques*
### *Institutional Order Flow Analysis*
1. *Step 1:* Identify pivot levels with ≥3 tests
2. *Step 2:* Watch for volume contraction near levels
3. *Step 3:* Enter when trap signal appears with:
- Wick > 2×ATR
- Volume > 1.5× average
### *Multi-Timeframe Confirmation*
1. *Higher TF:* Find weekly/monthly pivots
2. *Lower TF:* Use this indicator for precise entries
3. *Example:*
- Weekly pivot at $180
- 4H shows liquidity trap → High-probability reversal
---
## *⚠ Critical Mistakes to Avoid*
1. *Using Default Settings Everywhere*
- Crude oil needs higher ATR multiplier than bonds
2. *Ignoring Trap Context*
- Traps work best at:
- All-time highs/lows
- Major psychological numbers (00/50 levels)
3. *Overlooking Cumulative Volume*
- Check if volume is building over multiple tests

Standard Deviation SMA RSI | mad_tiger_slayerOverview of the Script
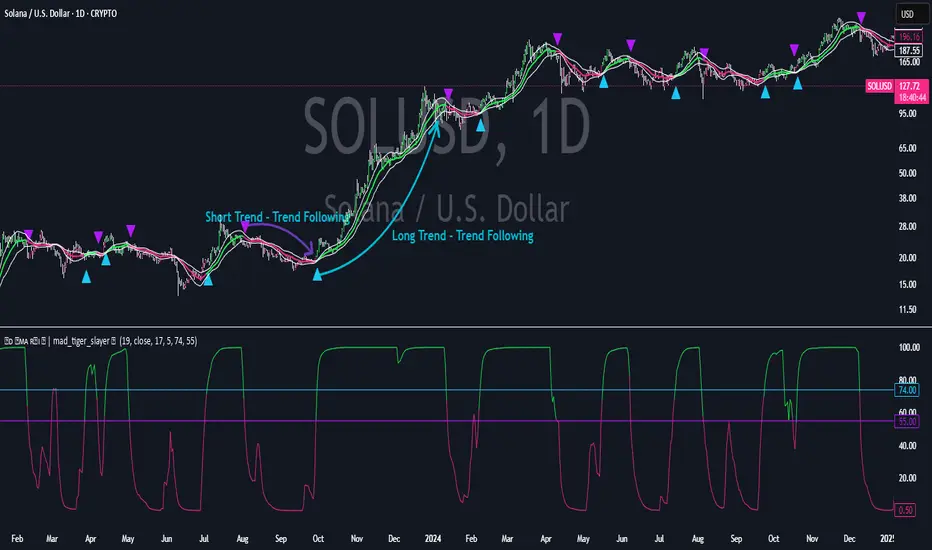
The Standard Deviation SMA RSI is a custom TradingView indicator that enhances the Relative Strength Index (RSI) by incorporating a Simple Moving Average (SMA) and Standard Deviation bands . This approach smooths RSI calculations while factoring in volatility to provide clearer trend signals . Additionally, the indicator includes overbought and oversold thresholds, trend-coded RSI signals , and dynamic volatility bands for improved market analysis. This indicator is designed for swing traders and long-term investors looking to capture high-probability trend shifts.
How Do Traders Use the Standard Deviation SMA RSI?
In the provided chart image, the indicator is displayed on a price chart. Each visual component serves a distinct function in identifying trend conditions and volatility levels .
INTENDED USES
⚠️ NOT INTENDED FOR SCALPING
With the smoothing nature of the SMA-based RSI , this indicator is not designed for low-timeframe scalping. It works best on timeframes above 1-hour , with optimal performance in 12-hour, daily, and higher timeframes.
📈 TREND-FOLLOWING & MEAN REVERSION
The Standard Deviation SMA RSI functions as both a trend-following and mean-reverting indicator:
Trend-Following: Identifies strong, sustained trends using RSI signals and SMA confirmation.
Mean Reversion: Detects overbought/oversold conditions based on standard deviation bands and RSI thresholds .
A VISUAL REPRESENTATION OF INTENDED USES
RSI Line (Green/Pink/Gray): The RSI line dynamically changes color based on trend conditions .
Green RSI → Strong uptrend, RSI above the uptrend threshold.
Pink RSI → Downtrend, RSI below the downtrend threshold.
Gray RSI → Neutral state or consolidation.
If the SMA of RSI is above Long Threshold , the market is in a bullish trend.
If it’s below Short Threshold, bearish conditions prevail.
Threshold Lines (Teal/Purple):
Green Line → Long Entry Threshold
Red Line → Short Entry Threshold
Standard Deviation Bands:
Upper Band → Measures bullish volatility expansion
Lower Band → Measures bearish volatility expansion
Colored Candles: Price candles adjust color based on RSI conditions , visually aligning price action with market trends.
Indicator's Primary Elements
Input Parameters
The script includes several configurable settings, allowing users to tailor the indicator to different market environments:
RSI Length: Controls the number of periods for RSI calculations.
SMA Length: Defines the period for the SMA applied to RSI , creating a smoothed trend line.
Standard Deviation Period: Determines the length for volatility calculations.
Overbought and Oversold Levels:
Can be adjusted to customize sensitivity.
Standard Deviation SMA RSI Calculation
The SMA-based RSI smooths fluctuations while the standard deviation bands measure price volatility.
Upper and Lower Bands: Calculated by adding/subtracting standard deviation to/from the SMA-based RSI.
Trend Signal Calculation:
RSI is compared to uptrend and downtrend thresholds to determine buy/sell conditions.
Long and Short Conditions
Buy and sell conditions are determined by RSI relative to key thresholds :
Bullish Signal: RSI above long threshold & SMA confirms trend .
Bearish Signal: RSI below short threshold & SMA confirms downtrend .
Reversals: RSI entering overbought/oversold areas suggests possible trend reversals.
Conclusion
The Standard Deviation SMA RSI is a powerful trend-following and mean-reverting tool , offering enhanced insights into RSI movements, volatility, and market strength . By combining SMA smoothing, standard deviation bands, and dynamic thresholds , traders can better identify trend confirmations, reversals, and overextended conditions .
✅ Customizable settings allow traders to optimize sensitivity.
✅ Works best on high timeframes (12H, Daily, Weekly).
✅ Ideal for swing traders and long-term investors.
CVD Oscillator - Short Term SwiftEdgeOverview
The CVD Oscillator - Short Term is a technical indicator designed to assist traders in identifying short-term buying and selling pressure in the market. It calculates the Cumulative Volume Delta (CVD) to measure the net volume difference between buying and selling activity, displayed as an oscillator in a separate panel. This indicator is tailored for short-term trading strategies, such as scalping or day trading, on low timeframes (e.g., 1-minute, 5-minute, or 15-minute charts).
How It Works
Cumulative Volume Delta (CVD): The indicator calculates CVD by assigning volume to buyers (when close > open) or sellers (when close < open). If close = open, the volume is neutral.
Short-Term Focus: The CVD is calculated over a user-defined lookback period (default: 10 candles), making it sensitive to recent market activity.
Normalization: The raw CVD is normalized by dividing it by the average volume (over a short period, default: 5 candles) and scaled to fit within a range of -100 to +100, creating an oscillator-like behavior.
Reset Options: Users can reset the CVD at specific intervals (e.g., every minute, 5 minutes, 15 minutes, or daily) to focus on intraday movements.
Live CVD Value: The raw (unnormalized) CVD value is displayed as a label on each candle for real-time monitoring.
Key Features
Customizable Lookback Period: Adjust the number of recent candles (default: 10) to calculate CVD, allowing for precise short-term analysis.
Flexible Reset Periods: Choose to reset the CVD every 1 minute, 5 minutes, 15 minutes, daily, or never, to suit your trading style.
Normalized Oscillator: The CVD is scaled between -100 and +100, making it easier to visualize short-term momentum.
Live CVD Labels: Displays the raw CVD value on each candle, with options to position the label above or below the oscillator line.
How to Use
Add to Chart: Apply the indicator to your chart on a low timeframe (e.g., 1m, 5m, or 15m) for short-term trading.
Interpret the Oscillator:
Above 0 (Green): Indicates buying pressure dominates.
Below 0 (Red): Indicates selling pressure dominates.
Near 0: Suggests neutral market conditions.
Monitor Live CVD: Use the raw CVD value (shown in the label) to assess the exact net volume difference over the lookback period.
Combine with Other Tools: Use the oscillator alongside price action, support/resistance levels, or other indicators to confirm trading decisions.
Adjust Settings:
CVD Lookback Period: Set to a small value (e.g., 5-20 candles) for scalping.
CVD Reset Period: Choose "1m" or "5m" for intraday resets to focus on very short-term trends.
Volume Average Length: Use a short length (e.g., 3-5) for faster responsiveness.
Scale Factor: Increase (e.g., 2.0-3.0) to amplify small changes in CVD.
Settings
CVD Reset Period: Defines when to reset the CVD calculation ("None", "D" for daily, "15m", "5m", "1m").
CVD Lookback Period (Candles): Number of recent candles to calculate CVD (default: 10).
Volume Average Length: Period for averaging volume to normalize CVD (default: 5).
CVD Scale Factor: Adjusts the sensitivity of the normalized CVD (default: 2.0).
CVD Label Position: Choose to display the raw CVD label above or below the oscillator line.
CVD Label Color: Customize the color of the CVD label (default: white).
Limitations
Not a Standalone Tool: This indicator should be used in conjunction with other technical analysis tools, as it does not guarantee profitable trades.
Volume Dependency: The accuracy of CVD relies on the quality of volume data provided by your broker or exchange.
Short-Term Focus: The indicator is optimized for low timeframes and may produce noise on higher timeframes unless adjusted.
No Predictive Claims: The CVD Oscillator reflects past and current market activity but does not predict future price movements.
Notes
This indicator is designed for informational purposes and does not constitute financial advice. Trading involves risk, and past performance is not indicative of future results.
Test the indicator on a demo account to understand its behavior before using it in live trading.
Feedback is welcome! If you have suggestions for improvements, feel free to share them in the comments.

Reversal rehersal v1This indicator was designed to identify potential market reversal zones using a combination of RSI thresholds (shooting range/falling range), candlestick patterns, and Fair Value Gaps (FVGs). By combining all these elements into one indicator, it allow for outputting high probability buy/sell signals for use by scalpers on low timeframes like 1-15 mins, for quick but small profits.
Note: that this has been mainly tested on DE40 index on the 1 min timeframe, and need to be adjusted to whichever timeframe and symbol you intend to use. Refer to the backtester feature for checking if this indicator may work for you.
The indicator use RSI ranges from two timeframes to highlight where momentum is building up. During these areas, it will look for certain candlestick patterns (Sweeps as the primary one) and check for existance of fair value gaps to further enhance the hitrate of the signal.
The logic for FVG detection was based on ©pmk07's work with MTF FVG tiny indicator. Several major changes was implemented though and incorporated into this indicator. Among these are:
Automatically adjustments of FVG boxes when mitigated partially and options to extend/cull boxes for performance and clarity.
Backtesting Table (Experimental):
This indicator also features an optional simplified table to review historical theoretical performance of signals, including win rate, profit/loss, and trade statistics. This does not take commision or slippage into consideration.
Usage Notes:
Setup:
1. Add the indicator to your chart.
2. Decide if you want to use Long or Short (or both).
3. If you're scalping on ie. 1 min time frame, make sure to set FVG's to higher timeframes (ie. 5, 15, 60).
4. Enable the 'Show backtest results' and adjust the 'Signals' og 'Take profit' and 'Stop loss' values until you are satisfied with the results.
Use:
1. Setup an alert based on either of the 'BullishShooting range' or 'BearishFalling range' alerts. This will draw your attention to watch for the possible setups.
2. Verify if there's a significant imbalance prior to the signal before taking the trade. Otherwise this may invalidate the setup.
3. Once a signal is shown on the graph (either Green arrow up for buys/Red arrow down for sells) - you should enter a trade with the given 'Take profit' and 'Stop loss' values.
4. (optional) Setup an alert for either the Strong/Weak signals. Which corresponds to when one of the arrows are printed.
Important: This is the way I use it myself, but use at own risk and remember to combine with other indicators for further confluence. Remember this is no crystal ball and I do not guarantee profitable results. The indicator merely show signals with high probability setups for scalping.

Flashtrader´s Statistical BandwidthsThe vast majority of traders exclusively concern
themselves with trend-following in all its facets. Scoring
points with trends on a regular basis is a difficult task
since prices do not constantly move in one direction
or another. In the case of the DAX future, for example,
only about 30 per cent of all trading days in a year are
trend days. And of these, there are x percent long ones
and x per cent short ones. Catching the very days when
prices rise or fall from the opening to the close is a major
challenge for a trader who also needs to have previously
recognised the corresponding direction.
However, there are also other ways of profit-taking
every day – for example, by using the mean reversion
strategy. The idea behind this is the fact that prices reach
a high and a low every day – but very rarely close at the
high or the low. This means that prices always move
away from these extreme points and the closing price is
somewhere in between. A profitable trading strategy can
be developed out of this.
But how can you know where the high and the low
will be tomorrow? Is it possible for you to know this in
advance? No – because no one can predict the future. Or
can they? At least it can be statistically determined how
high or low prices could go tomorrow. There is a high
degree of probability that one of the two possibilities
will materialise. It will then be necessary to act.
Calculation
Classic pivot points for the following day are calculated
from the high, low and closing price. But does it really
make sense to use such a mix? I don’t think so and
use a different calculation for this strategy. In a first step,
only the differences between the start and the high or low
are calculated on a daily basis. To avoid being dependent
on individual days and outliers, it is advisable to calculate,
in a second step, the average of these differences over
the past five days. Finally, this average will then be added
at the opening price of the current trading day for the
upper statistical bandwidth and subtracted for the lower
bandwidth.
upper bandwidth = oSTB (violet dashed line in the chart)
lower bandwidth = uSTB (violet dashedline in the chart)
The second interesting question is, if the previous day's high has been exceeded, how much further can the price rise from a mathematical/statistical point of view?
These calculated previous day highs expansions are shown as red dashed lines
Previous day's high expansion = VTHA
Previous day's low expansion = VTTA
For further orientation, the previous day's high (VTH) and the previous day's low (VTT) are shown in light blue dashed lines
And as a supplement, the previous day's close in the DAX Future at 10:00 p.m. VTSA in violet solid lines and the previous day's close in the cash register at 5:30 p.m. VTSN in yellow solid lines
Reaching the calculated extreme values does not mean that the trend has to change immediately, but there is at least temporary exhaustion potential with which you can earn a few points every day in the area of scalping.
Example for cheap entry long:
Example for cheap entry short:
Deutsch:
Die Masse der Trader beschäftigt sich ausschließlich mit Trendfolge in all ihren Facetten. Mit Trends regelmäßig zu punkten ist ein schwieriges Unterfangen, da die Kurse nicht ständig in die eine oder andere Richtung laufen. Beim DAX-Future zum Beispiel sind von allen Börsentagen im Jahr lediglich zirka 30 Prozent Trendtage. Davon sind dann auch noch x Prozent Long und x Prozent Short. Hier genau die Tage abzupassen, an denen die Kurse von Börsenbeginn bis zum Schluss steigen beziehungsweise fallen, ist eine große Herausforderung – wobei der Trader zuvor noch die entsprechende Richtung erkannt haben muss. Es gibt jedoch auch noch andere Methoden täglich Gewinne mitzunehmen, zum Beispiel mit der Mean-Reversion-Strategie (Mittelwertumkehr).
Hintergrund ist die Tatsache, dass die Kurse jeden Tag ein Hoch und ein Tief erreichen – aber sehr selten am Hoch oder am Tief schließen. Das bedeutet, dass die Preise sich immer wie der von diesen Extrempunkten wegbewegen und der Schlusskurs irgendwo dazwischen liegt. Hieraus lässt sich eine profitable Handelsstrategie entwickeln. Aber woher kannst Du wissen, wo morgen das Hoch und das Tief sein wird? Kannst Du das vorher schon wissen? Nein – denn niemand kann die Zukunft vorhersagen. Oder doch? Statistisch lässt sich zumindest bestimmen, wie hoch und wie tief die Kurse morgen steigen oder fallen könnten. Eine Seite wird mit sehr hoher Wahrscheinlichkeit ein treffen. Dann gilt es zu handeln.
Berechnung Klassischer Pivot-Punkte für den folgenden Tag werden aus Hoch, Tief und Schlusskurs berechnet. Aber ist es wirklich sinnvoll, einen solchen Mix zu verwenden? Ich finde das nicht und verwenden für diese Strategie eine andere Berechnung. Im ersten Schritt werden täglich die Differenzen nur vom Start bis zum Hoch beziehungsweise Tief errechnet. Um nicht von einzelnen Tagen und Ausreißern abhängig zu sein, empfiehlt es sich, in einem zweiten Schritt den Durchschnitt dieser Differenzen über die letzten fünf Tage zu errechnen. Zuletzt wird dann dieser Durchschnitt zum Eröffnungskurs des aktuellen Handelstages für die obere statistische Bandbreite addiert und für die untere Bandbreite subtrahiert.
Obere statistische Bandbreite = oSTB (violette gestrichelte Linie im Chart)
Untere statistische Bandbreite = uSTB (violette gestrichelte Linie im Chart)
Die zweite interessante Frage ist, wenn das Vortageshoch überschritten wurde, wie weit kann der Kurs dann noch steigen aus mathematisch/statistischer Sicht?
Diese berechneten Vortagesextremausdehnungen sind als rote gestrichelte Linien dargestellt
Vortageshochausdehnung = VTHA
Vortagestiefausdehnung = VTTA
Für die weitere Orientierung sind die Vortageshochs (VTH) und die Vortagestiefs (VTT) als hellblaue gestrichelte Linien abgebildet.
Als Ergänzung wird noch der Vortages Schluss im Dax Future um 22:00 Uhr VTSA mit einer violetten durchgezogenen Linie und der Kassamarktschluss um 17:30 Uhr mit einer gelben durchgezogenen Linie gezeigt.
Das Erreichen der berechneten Extremwerte bedeutet nicht, das der Trend sofort drehen muss, aber es sind zumindest temporäre Erschöpfungspotentiale mit denen sich im Bereich scalping täglich einige Punkte verdienen lassen.
Beispiel für günstigen Einstieg Long:
Beispiel für günstigen Einstieg Short:

RSI with Bollinger Bands Scalp Startegy (1min)
------------------------------------------------------------------------------
The "RSI with Bollinger Bands Scalp Strategy (1min)" is a highly effective tool designed for traders who engage in short-term scalping on the 1-minute chart. This indicator combines the strengths of the RSI (Relative Strength Index) and Bollinger Bands to generate precise buy signals, helping traders make quick and informed decisions in fast-moving markets.
How It Works:
RSI (Relative Strength Index):
The RSI is a widely-used momentum oscillator that measures the speed and change of price movements. It operates on a scale of 0 to 100 and helps identify overbought and oversold conditions in the market.
This strategy allows customization of the RSI's lower and upper bands (default settings: 30 for the lower band and 70 for the upper band) and the RSI length (default: 14).
Bollinger Bands:
Bollinger Bands consist of a central moving average (the basis) and two bands that represent standard deviations above and below the basis. These bands expand and contract based on market volatility.
In this strategy, the Bollinger Bands are used to identify potential buy and sell signals based on the price's relationship to the upper and lower bands.
Signal Generation:
Buy Signal: A buy signal is triggered when two conditions are met:
The RSI value falls below the specified lower band, indicating an oversold condition.
The price crosses below the lower Bollinger Band.
The buy signal is then issued on the first positive candle (where the closing price is greater than or equal to the opening price) after these conditions are met.
Sell Signal: In this version of the strategy, the sell signal is currently disabled to focus solely on generating and optimizing the buy signals for scalping.
Strategy Highlights:
This indicator is particularly effective for traders who focus on 1-minute charts and want to capitalize on rapid price movements.
The combination of RSI and Bollinger Bands ensures that buy signals are only generated during significant oversold conditions, helping to filter out false signals.
Customization:
Users can adjust the RSI length, Bollinger Bands length, and the standard deviation multiplier to better fit their specific trading style and the asset they are trading.
The moving average type for Bollinger Bands can be selected from various options, including SMA, EMA, SMMA, WMA, and VWMA, allowing further customization based on individual preferences.
Usage:
Use this indicator on a 1-minute chart to identify potential buy opportunities during short-term price dips.
Since the sell signals are disabled, this strategy is best used in conjunction with other indicators or strategies to manage exit points effectively.
This "RSI with Bollinger Bands Scalp Strategy (1min)" indicator is a valuable tool for traders looking to enhance their short-term trading performance by focusing on high-probability entry points in volatile market conditions.

OneThingToRuleThemAll [v1.4]This script was created because I wanted to be able to display a contextual chart of commonly used indicators for scalping and swing traders, with the ability to control the visual representation on the charts as their cross-overs, cross-unders, or changes of state happen in real time. Additionally, I wanted the ability to control how or when they are displayed. While looking through other community projects, I found they lacked the ability to full customize the output controls and values used for these indicators.
The script leverages standard RSI/MACD/VWAP/MVWAP/EMA calculations to help a trader visually make more informed decisions on entering or exiting a trade, depending on their understanding on what the indicators represent. Paired with a table directly on the chart, it allows a trader to quickly reference values to make more informed decisions without having to look away from the price action or look through multiple indicator outputs.
The main functionality of the indicator is controlled within the settings directly on the chart. There a user can enable the visual representations, or disable, and configure how they are displayed on the charts by altering their values or style types.
Users have the ability to enable/disable visual representations of:
The indicator chart
RSI Cross-over and RSI Reversals
MACD Uptrends and Downtrends
VWAP Cross-overs and Cross-unders
VWAP Line
MVWAP Cross-overs and Cross-unders
MVWAP Line
EMA Cross-overs and Cross-unders
EMA Line
Some traders like to use these visual indications as thresholds to enter or exit trades. Its best to find out which ones work the best with the security you are trying to trade. Personally, I use the table as a reference in conjunction with the RSI chart indicators to help me decide a logical trailing stop if I am scalping. Some users might like the track EMA200 crossovers, and have visual representations on the chart for when that happens. However, users may use the other indicators in other methods, and this script provides the ability to be able to configure those both visually and by value.
The pine script code is open source and itself is fairly straightforward, it is mostly written to provide the ultimate level of control the the user of the various indicators. Please reach out to me directly if you would like a further understanding of the code and an explanation on anything that may be unclear.
Enjoy :)
-dead1.

[Sniper] SuperTrend + SSL Hybrid + QQE MODHi. I’m DuDu95.
**********************************************************************************
This is the script for the series called "Sniper".
*** What is "Sniper" Series? ***
"Sniper" series is the project that I’m going to start.
In "Sniper" Series, I’m going to "snipe and shoot" the youtuber’s strategy: to find out whether the youtuber’s video about strategy is "true or false".
Specifically, I’m going to do the things below.
1. Implement "Youtuber’s strategy" into pinescript code.
2. Then I will "backtest" and prove whether "the strategy really works" in the specific ticker (e.g. BTCUSDT) for the specific timeframe (e.g. 5m).
3. Based on the backtest result, I will rate and judge whether the youtube video is "true" or "false", and then rate the validity, reliability, robustness, of the strategy. (like a lie detector)
*** What is the purpose of this series? ***
1. To notify whether the strategy really works for the people who watched the youtube video.
2. To find and build my own scalping / day trading strategy that really works.
**********************************************************************************
*** Strategy Description ***
This strategy is from " QQE MOD + supertrend + ssl hybrid" by korean youtuber "코인투데이".
"코인투데이" claimed that this strategy will make you a lot of money in any crypto ticker in 15 minute timeframe.
### Entry Logic
1. Long Entry Logic
- Super Trend Short -> Long
- close > SSL Hybrid baseline upper k
- QQE MOD should be blue
2. Short Entry Logic
- Super Trend Long -> Short
- close < SSL Hybrid baseline lower k
- QQE MOD should be red
### Exit Logic
1. Long Exit Logic
- Super Trend Long -> Short
2. Short Entry Logic
- Super Trend Short -> Long
### StopLoss
1. Can Choose Stop Loss Type: Percent, ATR, Previous Low / High.
2. Can Chosse inputs of each Stop Loss Type.
### Take Profit
1. Can set Risk Reward Ratio for Take Profit.
- To simplify backtest, I erased all other options except RR Ratio.
- You can add Take Profit Logic by adding options in the code.
2. Can set Take Profit Quantity.
### Risk Manangement
1. Can choose whether to use Risk Manangement Logic.
- This controls the Quantity of the Entry.
- e.g. If you want to take 3% risk per trade and stop loss price is 6% below the long entry price,
then 50% of your equity will be used for trade.
2. Can choose How much risk you would take per trade.
### Plot
1. Added Labels to check the data of entry / exit positions.
2. Changed and Added color different from the original one. (green: #02732A, red: #D92332, yellow: #F2E313)
3. SuperTrend and SSL Hybrid Baseline is by default drawn on the chart.
4. If you check EMA filter, EMA would be drawn on the chart.
5. Should add QQE MOD indicator manually if you want to see QQE MOD.
**********************************************************************************
*** Rating: True or False?
### Rating:
→ 3.5 / 5 (0 = Trash, 1 = Bad, 2 = Not Good, 3 = Good, 4 = Great, 5 = Excellent)
### True or False?
→ True but not a 'perfect true'.
→ It did made a small profit on 15 minute timeframe. But it made a profit so it's true.
→ It worked well in longer timeframe. I think super trend works well so I will work on this further.
### Better Option?
→ Use this for Day trading or Swing Trading, not for Scalping. (Bigger Timeframe)
→ Although the result was not good at 15 minute timeframe, it was quite profitable in 1h, 2h, 4h, 8h, 1d timeframe.
→ Crypto like BTC, ETH was ok.
→ The result was better when I use EMA filter.
### Robust?
→ Yes. Although result was super bad in 5m timeframe, backtest result was "consistently" profitable on longer timeframe (when timeframe was bigger than 15m, it was profitable).
→ Also, MDD was good under risk management option on.
**********************************************************************************
*** Conclusion?
→ I recommend you not to use this on short timeframe as the youtuber first mentioned.
→ In my opinion, I can use on longer timeframe like 2h or bigger with EMA filter, stoploss and risk management.

[VDB]TrendScalp-FractalBox-3EMAThere are many indicators with William’s Fractal and Alligator. As many use EMA’s it may be useful to define a 3-EMA ribbon and combining Fractal Levels/Box (filling background between top and bottom fractals) for trend scalping. I searched for this kind of indicator in community – some show fractals, some just levels, some with alligator etc. but couldn't find the one needed. Hence thought of this indicator which may be of interest to other users too.
Key Points:
EMA ribbon is created using 3 EMA’s 35/70/105. Users can change these as per their preference. This is used for trend identification – 1. Bullish bias if Price > EMA1 > EMA2 > EMA3. 2. Bearish bias if Price < EMA1 < EMA2 < EMA3.
Background is marked during crossing of EMA1 and EMA2 to alert possible trend change.
5-bar fractals are used to mark the Fractal levels and background between top and bottom fractals are filled to create a Fractal Box.
Fractal levels are marked only when the fractal formation is complete. Given offset is used this is lagging.
How to Use:
Sloping EMA ribbon is used for identifying the trend.
Fractal box break-out/ break-downs are used to trigger the trade with fractal high/low for entry/SL. Waiting for price contraction towards EMA ribbon resulting in smaller boxes is key to initiate trade. Avoid bigger boxes as SL’s will be big and price may move within. To draw the vertical lines of FractalBox change fractal level0 style to step-line.
This indicator combined with the cycle high/low (overbought/oversold) indicators such as CCI/Stochastic/RSI etc. can make it a good trend scalping setup while trading in the direction of momentum in higher timeframe.
This setup could be used for any timeframes. Do your back-testing before using it in live market.
This indicator was achieved by combing some fractal ideas from “Fractal and Alligator Alerts by JustUncleL”
DISCLAIMER : This indicator has been created for educational reference only and do not constitute investment advice. This indicator should not be relied upon as a substitute for extensive independent market research before making your actual trading decisions. Market data or any other content is subject to change at any time without notice. Liability for any loss or damage, including without limitation any loss of profit, which may arise directly or indirectly from use of this indicator is accountability of user using it.

Average Band by HarmanUsually, Moving Averages (Simple & Exponential) consider "close" of each candle to form a line for a particular period. In this indicator, we have considered all the parameters (Open, Close, Low & High) of each candle to form a Band or a wave which act as a zone to provide support & resistance. It works well on all the time frames. It perfectly works on lower time frames of 15 min & 5 min for intraday trades and even for scalping. There is a line that moves very near to candles known as "Candle Line" provide support & resistance to each individual candle and a leading line which moves ahead also acts as support & resistance and helps in determining trend direction.
How to use the indicator ?
Indicator consists of 3 components :
1) A Band or wave of 3 lines (upper, middle & lower line)
2) A "Candle Line" which moves along with the candles
3) A Leading line which moves ahead of the candles
Method 1 : When candles are being formed above the candle line (line near to candles) and it crosses the band or wave from below to upside, then long trade can be initiated. Similarly, When candles are being formed below the Candle line and it crosses the band or wave from upside then short trade can be initiated. Stop loss can be maintained below the band for Long trade and above the band for short trade. Candle line can be used to trail the stop loss.
Method 2: If candles moves above and below of the band very often and frequently and candle line is in the middle of candles then it is NO TRADING ZONE. If you still want to trade, then select a higher time frame and check the price movement. If there is a stability in the higher time frame, then take the trade in the higher timeframe with stable movement.
Method 3 : Candle line acts as "First line of Defence". In a uptrend, all the candles are formed above the candle line and in case of down trend, all the candles are formed below the candle line. When a newly formed candle cross the candle line then you can book profit. For Example : In uptrend , candles are being formed above the line, when a new candle started forming below the line and when the complete candle is formed below the line, profit can be booked. Vice-versa in case of downtrend.
Method 4: Direction of leading line, band and candle line helps in determining the trend. If all these three components are in upward direction, price trend is upward and if all these three components are in downward direction, then price trend is downward. When, leading line and band cross each other from opposite direction for consecutive 2-3 times, then price movement is sideways.
Method 5 : Thickness of band play an important role in determining price action. If band is narrow, it means small candles are being formed and no any huge price movement is observed in this period. When band started expanding, it signifies that big candles are begin to form and there is a more price movement than before. Similarly, If contraction of band started, it means that small candles are being formed and there is low price movement as compared to the price movement when Band was expanded. If Band is expanded (wider) and volumes are high, It means the Band will act as strong Support or Resistance than usual. In case, candles and candle line cross the expanded Band, you can enter the Long or Short trade.
Method 6: When the Band, leading line and candle line collides or meet at a single point, then it is either strong support or resistance.
Method 7 : Usage in Scalping : Select the shorter time frame of 1 min or 5 min. If the candles are crossing the band very frequently in 1 min, then select 5 min time frame or wait for few minutes for stability. Now, when candles started forming above the candle line and it crosses the band from below then take a long position and book profit after few candles above the band. Place stop loss below the Band. Similarly, when candles started forming below the candle line and it crosses the band from above, then enter into short trade and book profit after few candles. Place stop loss above the band in the case of short trade.
You can combine above methods to give a sharp edge to your trade and increase the probability of your winning in the trade.
Indicator Settings : Default period selected is 50 for both the Band and leading line. You can change the period to 26 or 100 or 200. Select the period and check the chart, if the indicator looks fine and smooth, then you can use your settings. For most of the time, default settings work perfectly.
Proudly Developed by :
Harmandeep Singh
Graduate in Computer Science with Physics & Mathematics
MBA in Business Marketing and Finance
Experienced Computer programmer & Software developer
Stock Market & Crypto Trader

[blackcat] L3 Bias ScalperLevel: 3
Background
Bias alone is a powerful tool for trading. I use SMA3, SMA10, SMA20, SMA30 to cover short and middle term of the trend for scalping. Multiple biases can be introduced for long and short entries.
Function
Use SMAs and biases for scalping with whale move alert (banker fund flow detection)
Key Signal
buy --> entry signal for long
strongbuy --> entry signal for long
add --> buy more or re-entry signal for long
reduce --> partial exit for long
exit --> complete exit for long
sell --> short entry signal
whalemove --> banker fund move detection
Pros and Cons
This script provides entry signal together with whale detection by bias algorithms, you can use whale move to predict next move of trend in large time frame. However, trading signal should be further filtered out for more precise entry signal.
Remarks
At beginning, I want to make it simple and it looks very complex at the end...
Readme
In real life, I am a prolific inventor. I have successfully applied for more than 60 international and regional patents in the past 12 years. But in the past two years or so, I have tried to transfer my creativity to the development of trading strategies. Tradingview is the ideal platform for me. I am selecting and contributing some of the hundreds of scripts to publish in Tradingview community. Welcome everyone to interact with me to discuss these interesting pine scripts.
The scripts posted are categorized into 5 levels according to my efforts or manhours put into these works.
Level 1 : interesting script snippets or distinctive improvement from classic indicators or strategy. Level 1 scripts can usually appear in more complex indicators as a function module or element.
Level 2 : composite indicator/strategy. By selecting or combining several independent or dependent functions or sub indicators in proper way, the composite script exhibits a resonance phenomenon which can filter out noise or fake trading signal to enhance trading confidence level.
Level 3 : comprehensive indicator/strategy. They are simple trading systems based on my strategies. They are commonly containing several or all of entry signal, close signal, stop loss, take profit, re-entry, risk management, and position sizing techniques. Even some interesting fundamental and mass psychological aspects are incorporated.
Level 4 : script snippets or functions that do not disclose source code. Interesting element that can reveal market laws and work as raw material for indicators and strategies. If you find Level 1~2 scripts are helpful, Level 4 is a private version that took me far more efforts to develop.
Level 5 : indicator/strategy that do not disclose source code. private version of Level 3 script with my accumulated script processing skills or a large number of custom functions. I had a private function library built in past two years. Level 5 scripts use many of them to achieve private trading strategy.
Camelback-IndikatorDer Camelback-Indikator stammt von Joe Ross. Er beinhaltet zwei einfache gleitende Durchschnitte mit 40 Perioden und einen exponentiellen gleitenden Durchschnitt mit 15 Perioden.
Sobald wir mit Preisbalken arbeiten, die vollständig unterhalb des MA40-Kanals liegen, versuchen wir einen Ausbruch durch das Tief des Balkens zu verkaufen, der das lokale Hoch macht. Mit dem lokalen Hoch ist das Hoch einer geringfügigen Korrektur außerhalb des MA40-Kanals gemeint.
Sobald wir mit Preisbalken arbeiten, die vollständig oberhalb des MA40-Kanals liegen, versuchen wir einen Ausbruch durch das Hoch des Balkens zu kaufen, der das lokale Tief macht. Mit dem lokalen Tief ist das Tief einer geringfügigen Korrektur außerhalb des Kanals gemeint.
Was wir hier tun, kann als Scalping bezeichnet werden. Das Skalieren des längerfristigen Charts mit kurzfristigen Handelstechniken ist eine großartige Möglichkeit, um die Art von Aktion zu handeln, die wir in diesen Charts sehen.
Der Camelback-Indikator kann auch zum scannen von Aktiemärkten benutzt werden.
Der Indikator beinhaltet neben der Camelback-Funktion außerdem noch einen einfachen gleitentenden Durchschnitt mit 200 Perioden, zwei einfache gleitentende Durchschnitte (im script short-term genannt) mit einstellbarer Periodendauer, einer davon angewendet auf Hochs, bei dem anderen kann die Anwendung der Quelle eingestellt werden. Bei beiden ist ein Offset einstellbar.
The Camelback indicator is from Joe Ross. It includes two simple moving averages with 40 periods and an exponential moving average with 15 periods.
Once we are working with price bars that are completely below the MA40 channel, we try to sell a breakout through the low of the bar which makes the local high. By the local high is meant the high of a minor correction outside of the MA40 channel.
Once we are working with price bars that are completely above the MA40 channel, we try to buy a breakout through the high of the bar which makes the local low. By the local low we mean the low of a minor correction outside the channel.
What we are doing here can be called scalping. Scaling the longer term chart with short term trading techniques is a great way to trade for the kind of action we see on these charts.
The Camelback indicator can also be used to scan stock markets.
In addition to the Camelback function, the indicator also includes a simple moving average with 200 periods, two simple moving averages (called short-term in the script) with adjustable period duration, one of which is applied to highs, the other can be used to set the source . An offset can be set for both.

Info de Vela 1m1-Minute Candle Info Dashboard (Real-Time)
Overview
This is a lightweight, real-time dashboard designed specifically for 1-minute (1m) scalping. It provides critical, non-lagging data about the current 1-minute candle, helping you make split-second decisions on stop-loss placement and risk assessment.The table updates on every tick without flickering or repainting.
Key Features (Real-Time Table)
The dashboard displays three key metrics about the current 1m candle:Time Remaining: A simple countdown timer showing the exact seconds remaining until the current candle closes (e.g., "00:34").Dist. to Extreme (Ticks): This is the core function for scalping. It calculates the distance (in ticks) from the current price to the furthest extreme of the candle (i.e., max(high - close, close - low)). This is ideal for traders who base their stop-loss on the current candle's range.Total Candle Range (Ticks): Displays the full high-to-low range of the current candle in ticks, giving you an instant read on volatility.
How to Use
This tool is designed to solve one problem: speed.Instead of manually measuring the distance for your stop-loss on every candle, you can instantly read the exact tick value from the table. This allows you to calculate your position size (lotage) much faster, which is essential in a fast-moving 1m environment.
REQUIREMENT:This indicator is designed to work ONLY on the 1-minute (1m) timeframe. It will display an error and show no data on any other chart.

Quantum Momentum FusionPurpose of the Indicator
"Quantum Momentum Fusion" aims to combine the strengths of RSI (Relative Strength Index) and Williams %R to create a hybrid momentum indicator tailored for volatile markets like crypto:
RSI: Measures the strength of price changes, great for understanding trend stability but can sometimes lag.
Williams %R: Assesses the position of the price relative to the highest and lowest levels over a period, offering faster responses but sensitive to noise.
Combination: By blending these two indicators with a weighted average (default 50%-50%), we achieve both speed and reliability.
Additionally, we use the indicator’s own SMA (Simple Moving Average) crossovers to filter out noise and generate more meaningful signals. The goal is to craft a simple yet effective tool, especially for short-term trading like scalping.
How Signals Are Generated
The indicator produces signals as follows:
Calculations:
RSI: Standard 14-period RSI based on closing prices.
Williams %R: Calculated over 14 periods using the highest high and lowest low, then normalized to a 0-100 scale.
Quantum Fusion: A weighted average of RSI and Williams %R (e.g., 50% RSI + 50% Williams %R).
Fusion SMA: 5-period Simple Moving Average of Quantum Fusion.
Signal Conditions:
Overbought Signal (Red Background):
Quantum Fusion crosses below Fusion SMA (indicating weakening momentum).
And Quantum Fusion is above 70 (in the overbought zone).
This is a sell signal.
Oversold Signal (Green Background):
Quantum Fusion crosses above Fusion SMA (indicating strengthening momentum).
And Quantum Fusion is below 30 (in the oversold zone).
This is a buy signal.
Filtering:
The background only changes color during crossovers, reducing “fake” signals.
The 70 and 30 thresholds ensure signals trigger only in extreme conditions.
On the chart:
Purple line: Quantum Fusion.
Yellow line: Fusion SMA.
Red background: Sell signal (overbought confirmation).
Green background: Buy signal (oversold confirmation).
Overall Assessment
This indicator can be a fast-reacting tool for scalping. However:
Volatility Warning: Sudden crypto pumps/dumps can disrupt signals.
Confirmation: Pair it with price action (candlestick patterns) or another indicator (e.g., volume) for validation.
Timeframe: Works best on 1-5 minute charts.
Suggested Settings for Long Timeframes
Here’s a practical configuration for, say, a 4-hour chart:
RSI Period: 20
Williams %R Period: 20
RSI Weight: 60%
Williams %R Weight: 40% (automatically calculated as 100 - RSI Weight)
SMA Period: 15
Overbought Level: 75
Oversold Level: 25

Bogdan Ciocoiu - Sniper EntryWhat is Sniper Entry
Sniper Entry is a set indicator that encapsulates a collection of pre-configured scripts using specific variables that enable users to extract signals by interpreting market behaviour quickly, suitable for 1-3min scalping. This instrument is a tool that acts as a confluence for traders to make decisions concerning current market conditions. This indicator does not apply solely to an asset.
What Sniper Entry is not
Sniper Entry is not interpreting fundamental analysis and will also not be providing out of box market signals. Instead, it will provide a collection of integrated and significantly improved open-source subscripts designed to help traders speculate on market trends. Traders must apply their strategies and configure Sniper Entry accordingly to maximise the script's output.
Originality and usefulness
The collection of subscripts encapsulated in this tool makes it unique in the Trading View ecosystem. This indicator enables traders to consider entry positions or exit positions by comparing similar algorithms at once.
Its usefulness also emerges from the unique configurations embedded in the indicator's settings, which are different from those of the original scripts.
This indicator's originality is also reflected in how its modules are integrated, including the integration of the settings.
Open-source reuse
I used the following open-source resources, which I simplified significantly and pre-configured for short term scalping. The source codes for the below are already in the public domain, including the following links listed below.
www.tradingview.com (open source)
(open source and generic algorithm)
www.tradingview.com (open source)
(open source)
(open source)
www.tradingview.com (generic MA algorithm and open source)
(generic VWAP algorithm and open source)

Table Logic ExtractorTable Logic Extractor v2.0
Advanced multi-timeframe analysis with intelligent trade recommendations!
Overview:
This sophisticated indicator provides comprehensive market analysis through multiple technical indicators and timeframes. It combines EMA analysis, RSI momentum, MACD signals, Bollinger Bands, volume analysis, divergence detection, and intelligent trade recommendations with support/resistance distance calculations and trading style detection.
Key Features:
✅ Multi-Indicator Analysis - EMA, RSI, MACD, Bollinger Bands, Volume, ATR
✅ Multi-Timeframe Analysis - M1, M5, M15, M30 trend comparison
✅ Divergence Detection - Bullish and bearish divergence with strength calculation
✅ Support/Resistance Analysis - Distance calculations with Fibonacci levels
✅ Trading Style Detection - Trend, Range, Breakout, Scalping identification
✅ Intelligent Trade Signals - Style-based trade recommendations with confidence levels
✅ Risk Management - Stop Loss and Take Profit calculations
✅ Comprehensive Table - Real-time analysis with 14 different metrics
How It Works:
The indicator uses advanced analysis:
• Multi-Timeframe - M1, M5, M15, M30 trend analysis
• Style Detection - Automatic trading style identification
• S/R Analysis - Fibonacci-based support/resistance levels
• Weighted Scoring - EMA (2.0), RSI (1.5), MACD (1.5), BB (1.0), Volume (1.0)
• Intelligent Signals - Style-based trade recommendations
Trading Style Detection:
• TREND TRADING - Strong trend + aligned timeframes (Green)
• RANGE TRADING - Low volatility + sideways movement (Yellow)
• BREAKOUT TRADING - High volume + near levels (Orange)
• SCALPING - High volatility + quick moves (Red)
Information Table (14 Metrics):
Real-time display showing:
• ATR volatility with signal (HIGH/MED/LOW/NORMAL VOL)
• Divergence status with strength percentage
• S/R Distance with Fibonacci levels
• Stop Loss (2.0:1 ratio) and Take Profit 1 (1.5:1 ratio)
• Multi-Timeframe analysis (M1, M5, M15, M30)
• Scalping signals with confidence levels
• Current trend with strength percentage
• Intelligent trade recommendations
Trade Recommendations:
• TREND BUY/SELL - All timeframes aligned (High confidence)
• SHORT-TERM BUY/SELL - M5 signal only (Medium confidence)
• SCALPING BUY/SELL - M5 vs higher timeframes (Low confidence)
• WAIT - No clear signal (No confidence)
Support/Resistance Analysis:
• Fibonacci Levels: 23.6%, 38.2%, 50% retracements
• Distance Categories: Very Near (Red), Near (Orange), Medium (Yellow), Far (Green)
• ATR-based distance measurement
• Real-time proximity alerts
Scalping Detection:
Specialized signals based on:
• High volatility (ATR ratio > 1.5)
• Quick price moves (fast momentum)
• Volume confirmation (high volume spikes)
• RSI extremes (oversold/overbought)
Settings:
• EMA - Fast (9), Slow (21), Trend (50)
• RSI - Length (14), Overbought (70), Oversold (30)
• MACD - Fast (12), Slow (26), Signal (9)
• Bollinger Bands - Length (20), Multiplier (2.0)
• ATR - Length (14) for volatility measurement
• Volume Threshold - 1.5x average volume
• Divergence - Lookback (3), Threshold (0.5)
Best Practices:
🎯 Adapt strategy to detected trading style
📊 Use multi-timeframe analysis for confirmation
⚡ Monitor S/R distances for entry timing
🛡️ Always use calculated Stop Loss levels
🔍 Watch for divergence signals
📈 Follow intelligent trade recommendations
Pro Tips:
• Table provides all essential information in one place
• Trading style detection helps adapt your strategy
• S/R distance shows proximity to key levels
• Confidence levels indicate signal reliability
• Multi-timeframe alignment increases success rate
• Scalping signals work best in high volatility
Alerts:
• Trend Change Alert - "Trend changed across timeframes"
• Divergence Alert - "Divergence detected"
• Scalping Alert - "Scalping opportunity"
• Trade Signal Alert - "Trade recommendation available"
Version 2.0 Improvements:
• Advanced multi-timeframe analysis (M1, M5, M15, M30)
• Intelligent trading style detection
• Comprehensive support/resistance analysis
• Professional trade recommendations with confidence levels
• Scalping detection with specialized signals
• Risk management with calculated SL/TP levels
• 14-metric comprehensive information table
Created with ❤️ for the trading community
This indicator is free to use for both commercial and non-commercial purposes.

Multi-Confluence Swing Hunter V1# Multi-Confluence Swing Hunter V1 - Complete Description
Overview
The Multi-Confluence Swing Hunter V1 is a sophisticated low timeframe scalping strategy specifically optimized for MSTR (MicroStrategy) trading. This strategy employs a comprehensive point-based scoring system that combines optimized technical indicators, price action analysis, and reversal pattern recognition to generate precise trading signals on lower timeframes.
Performance Highlight:
In backtesting on MSTR 5-minute charts, this strategy has demonstrated over 200% profit performance, showcasing its effectiveness in capturing rapid price movements and volatility patterns unique to MicroStrategy's trading behavior.
The strategy's parameters have been fine-tuned for MSTR's unique volatility characteristics, though they can be optimized for other high-volatility instruments as well.
## Key Innovation & Originality
This strategy introduces a unique **dual scoring system** approach:
- **Entry Scoring**: Identifies swing bottoms using 13+ different technical criteria
- **Exit Scoring**: Identifies swing tops using inverse criteria for optimal exit timing
Unlike traditional strategies that rely on simple indicator crossovers, this system quantifies market conditions through a weighted scoring mechanism, providing objective, data-driven entry and exit decisions.
## Technical Foundation
### Optimized Indicator Parameters
The strategy utilizes extensively backtested parameters specifically optimized for MSTR's volatility patterns:
**MACD Configuration (3,10,3)**:
- Fast EMA: 3 periods (vs standard 12)
- Slow EMA: 10 periods (vs standard 26)
- Signal Line: 3 periods (vs standard 9)
- **Rationale**: These faster parameters provide earlier signal detection while maintaining reliability, particularly effective for MSTR's rapid price movements and high-frequency volatility
**RSI Configuration (21-period)**:
- Length: 21 periods (vs standard 14)
- Oversold: 30 level
- Extreme Oversold: 25 level
- **Rationale**: The 21-period RSI reduces false signals while still capturing oversold conditions effectively in MSTR's volatile environment
**Parameter Adaptability**: While optimized for MSTR, these parameters can be adjusted for other high-volatility instruments. Faster-moving stocks may benefit from even shorter MACD periods, while less volatile assets might require longer periods for optimal performance.
### Scoring System Methodology
**Entry Score Components (Minimum 13 points required)**:
1. **RSI Signals** (max 5 points):
- RSI < 30: +2 points
- RSI < 25: +2 points
- RSI turning up: +1 point
2. **MACD Signals** (max 8 points):
- MACD below zero: +1 point
- MACD turning up: +2 points
- MACD histogram improving: +2 points
- MACD bullish divergence: +3 points
3. **Price Action** (max 4 points):
- Long lower wick (>50%): +2 points
- Small body (<30%): +1 point
- Bullish close: +1 point
4. **Pattern Recognition** (max 8 points):
- RSI bullish divergence: +4 points
- Quick recovery pattern: +2 points
- Reversal confirmation: +4 points
**Exit Score Components (Minimum 13 points required)**:
Uses inverse criteria to identify swing tops with similar weighting system.
## Risk Management Features
### Position Sizing & Risk Control
- **Single Position Strategy**: 100% equity allocation per trade
- **No Overlapping Positions**: Ensures focused risk management
- **Configurable Risk/Reward**: Default 5:1 ratio optimized for volatile assets
### Stop Loss & Take Profit Logic
- **Dynamic Stop Loss**: Based on recent swing lows with configurable buffer
- **Risk-Based Take Profit**: Calculated using risk/reward ratio
- **Clean Exit Logic**: Prevents conflicting signals
## Default Settings Optimization
### Key Parameters (Optimized for MSTR/Bitcoin-style volatility):
- **Minimum Entry Score**: 13 (ensures high-conviction entries)
- **Minimum Exit Score**: 13 (prevents premature exits)
- **Risk/Reward Ratio**: 5.0 (accounts for volatility)
- **Lower Wick Threshold**: 50% (identifies true hammer patterns)
- **Divergence Lookback**: 8 bars (optimal for swing timeframes)
### Why These Defaults Work for MSTR:
1. **Higher Score Thresholds**: MSTR's volatility requires more confirmation
2. **5:1 Risk/Reward**: Compensates for wider stops needed in volatile markets
3. **Faster MACD**: Captures momentum shifts quickly in fast-moving stocks
4. **21-period RSI**: Reduces noise while maintaining sensitivity
## Visual Features
### Score Display System
- **Green Labels**: Entry scores ≥10 points (below bars)
- **Red Labels**: Exit scores ≥10 points (above bars)
- **Large Triangles**: Actual trade entries/exits
- **Small Triangles**: Reversal pattern confirmations
### Chart Cleanliness
- Indicators plotted in separate panes (MACD, RSI)
- TP/SL levels shown only during active positions
- Clear trade markers distinguish signals from actual trades
## Backtesting Specifications
### Realistic Trading Conditions
- **Commission**: 0.1% per trade
- **Slippage**: 3 points
- **Initial Capital**: $1,000
- **Account Type**: Cash (no margin)
### Sample Size Considerations
- Strategy designed for 100+ trade sample sizes
- Recommended timeframes: 4H, 1D for swing trading
- Optimal for trending/volatile markets
## Strategy Limitations & Considerations
### Market Conditions
- **Best Performance**: Trending markets with clear swings
- **Reduced Effectiveness**: Highly choppy, sideways markets
- **Volatility Dependency**: Optimized for moderate to high volatility assets
### Risk Warnings
- **High Allocation**: 100% position sizing increases risk
- **No Diversification**: Single position strategy
- **Backtesting Limitation**: Past performance doesn't guarantee future results
## Usage Guidelines
### Recommended Assets & Timeframes
- **Primary Target**: MSTR (MicroStrategy) - 5min to 15min timeframes
- **Secondary Targets**: High-volatility stocks (TSLA, NVDA, COIN, etc.)
- **Crypto Markets**: Bitcoin, Ethereum (with parameter adjustments)
- **Timeframe Optimization**: 1min-15min for scalping, 30min-1H for swing scalping
### Timeframe Recommendations
- **Primary Scalping**: 5-minute and 15-minute charts
- **Active Monitoring**: 1-minute for precise entries
- **Swing Scalping**: 30-minute to 1-hour timeframes
- **Avoid**: Sub-1-minute (excessive noise) and above 4-hour (reduces scalping opportunities)
## Technical Requirements
- **Pine Script Version**: v6
- **Overlay**: Yes (plots on price chart)
- **Additional Panes**: MACD and RSI indicators
- **Real-time Compatibility**: Confirmed bar signals only
## Customization Options
All parameters are fully customizable through inputs:
- Indicator lengths and levels
- Scoring thresholds
- Risk management settings
- Visual display preferences
- Date range filtering
## Conclusion
This scalping strategy represents a comprehensive approach to low timeframe trading that combines multiple technical analysis methods into a cohesive, quantified system specifically optimized for MSTR's unique volatility characteristics. The optimized parameters and scoring methodology provide a systematic way to identify high-probability scalping setups while managing risk effectively in fast-moving markets.
The strategy's strength lies in its objective, multi-criteria approach that removes emotional decision-making from scalping while maintaining the flexibility to adapt to different instruments through parameter optimization. While designed for MSTR, the underlying methodology can be fine-tuned for other high-volatility assets across various markets.
**Important Disclaimer**: This strategy is designed for experienced scalpers and is optimized for MSTR trading. The high-frequency nature of scalping involves significant risk. Past performance does not guarantee future results. Always conduct your own analysis, consider your risk tolerance, and be aware of commission/slippage costs that can significantly impact scalping profitability.

Super IndicatorOverview of the Combined Indicator
This combined indicator leverages three major technical analysis tools:
Bollinger Bands
Linear Regression Channels
Scalping Strategy Indicators (RSI, MACD, SMA)
Each of these tools provides unique insights into market conditions, and their integration offers a comprehensive view of price movements, trends, and potential trading signals.
1. Bollinger Bands
Purpose:
Bollinger Bands are used to measure market volatility and identify overbought or oversold conditions.
Components:
Basis (Middle Band): Typically a 20-period Simple Moving Average (SMA).
Upper Band: Basis + (2 * Standard Deviation).
Lower Band: Basis - (2 * Standard Deviation).
Why They Complement:
Bollinger Bands expand and contract based on market volatility. When the bands are narrow, it indicates low volatility and potential for a significant move. Wide bands indicate high volatility. This helps traders gauge the strength of market moves and potential reversals.
2. Linear Regression Channels
Purpose:
Linear Regression Channels identify the overall trend direction and measure deviation from the mean price over a specific period.
Components:
Middle Line (Linear Regression Line): The line of best fit through the price data over a specified period.
Upper and Lower Lines: Channels created by adding/subtracting a multiple of the standard deviation or another deviation measure from the regression line.
Why They Complement:
Linear Regression Channels provide a clear visual representation of the trend direction and the range within which prices typically fluctuate. This can help traders identify trend continuations and reversals, making it easier to spot entry and exit points.
3. Scalping Strategy Indicators
Purpose:
The RSI, MACD, and SMA are used to generate short-term buy and sell signals, which are essential for scalping strategies aimed at capturing quick profits from small price movements.
Components:
RSI (Relative Strength Index): Measures the speed and change of price movements, typically over 14 periods. It helps identify overbought and oversold conditions.
MACD (Moving Average Convergence Divergence): Consists of the MACD line, Signal line, and histogram. It helps identify changes in the strength, direction, momentum, and duration of a trend.
SMA (Simple Moving Average): The average price over a specified period, used to smooth out price data and identify trends.
Why They Complement:
These indicators provide short-term signals that can confirm or refute the signals given by Bollinger Bands and Linear Regression Channels. For example, a buy signal might be more reliable if the price is near the lower Bollinger Band and the MACD crosses above its signal line.
How They Work Together
Scenario 1: Confirming Trend Continuations
Bollinger Bands: Price staying near the upper band suggests a strong uptrend.
Linear Regression Channels: Price staying above the middle line confirms the uptrend.
5-Minute Scalping Strategy: RSI not in overbought territory, and MACD showing bullish momentum confirms continuation.
Scenario 2: Identifying Reversals
Bollinger Bands: Price touching or moving outside the lower band suggests oversold conditions.
Linear Regression Channels: Price at the lower channel line indicates potential support.
5-Minute Scalping Strategy: RSI in oversold territory, and MACD showing a bullish crossover indicates a reversal.
Scenario 3: Volatility Breakouts
Bollinger Bands: Bands contracting indicates low volatility and potential breakout.
Linear Regression Channels: Price moving away from the middle line signals potential breakout direction.
Scalping Strategy: MACD and RSI confirming the breakout direction for entry.
Input Parameters:
Define settings for Bollinger Bands, Linear Regression Channels, and the scalping strategy.
Allow users to customize lengths, multipliers, and colors.
Bollinger Bands Calculation:
Calculate the basis (SMA) and standard deviation.
Derive the upper and lower bands from the basis and standard deviation.
Linear Regression Channel Calculation:
Compute the slope, average, and intercept of the linear regression line.
Calculate deviations to plot upper and lower channel lines.
5-Minute Scalping Strategy:
Calculate RSI, MACD, and SMA for short-term trend analysis.
Define buy and sell conditions based on these indicators.
Plotting and Alerts:
Plot Bollinger Bands and Linear Regression Channels on the chart.
Plot buy and sell signals with shapes.
Set alerts for key conditions like exiting the regression channel bounds and trend switches.
Conclusion
By combining Bollinger Bands, Linear Regression Channels, and a 5-minute scalping strategy, this indicator offers a robust tool for traders. Bollinger Bands provide volatility insights, Linear Regression Channels highlight trend direction and potential reversals, and the scalping strategy offers precise entry and exit points. Together, these tools can enhance a trader's ability to make informed decisions in various market conditions.
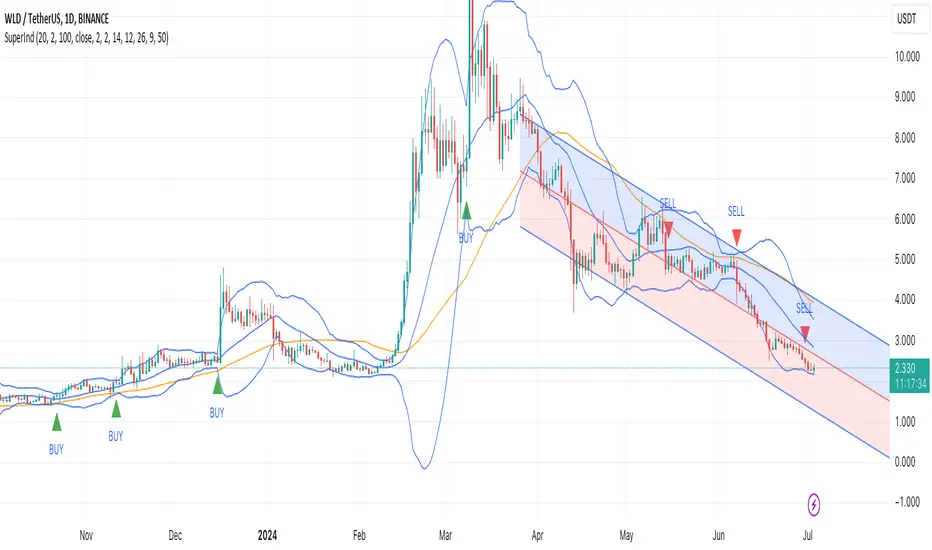
BB_MDL_V1Simple indicator that is based on the average line of the bollinger bands and the exponential average of 200 periods.
The customizable variable is bollinger bands length, currently the default is 35, you can tweak it to your liking and see how trend identification changes.
My recommendation is to work in 5-minute time frames in values such as SOL, FTM or MASK (cryptos)
This simple strategy can be combined with many others to gain more insight and get better market entries and exits.

BTC Pair Trading Scalper
The BTC Pair Trading Scalper is a comprehensive technical analysis indicator specifically designed for scalping Bitcoin on 15-minute timeframes. This indicator combines pair trading strategies with multiple technical indicators to identify high-probability entry and exit points for short-term trades.
═══════════════════════════════════════════════════════════════════════════
KEY FEATURES
✓ PAIR TRADING ANALYSIS
- Compares your BTC chart against a reference pair (default: BTCUSDT)
- Calculates real-time spread percentage between pairs
- Uses Z-Score statistical analysis for mean reversion opportunities
- Identifies divergence and correlation breakdowns
✓ MULTI-INDICATOR CONFLUENCE
- Fast EMA (9) and Slow EMA (21) for trend direction
- SMA (50) for overall trend confirmation
- RSI (14) with customizable overbought/oversold levels
- MACD for momentum analysis
- Bollinger Bands for volatility and price extremes
- ATR for volatility measurement
✓ VOLUME CONFIRMATION
- Volume moving average analysis
- Volume spike detection to validate signals
- Filters out false signals in low-volume conditions
✓ ADJUSTABLE SIGNAL SENSITIVITY
- HIGH: More frequent signals for active scalping (suitable for experienced traders)
- MEDIUM: Balanced approach with confirmed signals (recommended for most traders)
- LOW: Conservative signals with multiple confirmations (suitable for risk-averse traders)
✓ REAL-TIME DASHBOARD
Displays at-a-glance information:
- Current RSI level with color coding
- MACD trend direction
- Spread percentage between pairs
- Z-Score for mean reversion
- Volume status (High/Normal)
- Overall trend direction (UP/DOWN/NEUTRAL)
- Current ATR value for stop-loss sizing
✓ COMPREHENSIVE ALERT SYSTEM
- Buy signal alerts
- Sell signal alerts
- Spread threshold breach alerts
- Oversold condition alerts
- Overbought condition alerts
═══════════════════════════════════════════════════════════════════════════
HOW IT WORKS
SIGNAL GENERATION LOGIC
BUY SIGNALS are generated when:
- Fast EMA crosses above Slow EMA (bullish crossover)
- Price is in an uptrend (above 50 SMA)
- RSI shows bullish momentum
- MACD confirms upward momentum
- Volume spike confirms the move
- Sensitivity settings are met
SELL SIGNALS are generated when:
- Fast EMA crosses below Slow EMA (bearish crossover)
- Price is in a downtrend (below 50 SMA)
- RSI shows bearish momentum
- MACD confirms downward momentum
- Volume spike confirms the move
- Sensitivity settings are met
PAIR TRADING COMPONENT
The indicator monitors the spread between your chart and the pair symbol. When the spread deviates significantly (measured by Z-Score), it signals potential mean reversion opportunities:
- Z-Score < -1.5: Pairs have diverged, potential buy opportunity
- Z-Score > 1.5: Pairs have diverged, potential sell opportunity
═══════════════════════════════════════════════════════════════════════════
VISUAL ELEMENTS
ON-CHART DISPLAY:
- Blue line: Fast EMA (9) - Short-term trend
- Orange line: Slow EMA (21) - Medium-term trend
- Purple line: Trend SMA (50) - Long-term trend filter
- Gray bands: Bollinger Bands showing volatility
- Green "BUY" labels: Long entry signals
- Red "SELL" labels: Short entry signals
- Background tint: Green (uptrend) / Red (downtrend)
DASHBOARD (Top-Right):
Color-coded metrics for quick decision making:
- Red: Overbought/Warning conditions
- Green: Oversold/Bullish conditions
- Yellow: Neutral/Elevated conditions
- White: Normal conditions
═══════════════════════════════════════════════════════════════════════════
RECOMMENDED SETTINGS BY TRADING STYLE
AGGRESSIVE SCALPING (High Frequency)
- Signal Sensitivity: HIGH
- Timeframe: 15 minutes
- Expected trades: 5-10 per day
- Risk level: Higher
- Skill level: Advanced
BALANCED SCALPING (Recommended)
- Signal Sensitivity: MEDIUM
- Timeframe: 15 minutes
- Expected trades: 3-5 per day
- Risk level: Moderate
- Skill level: Intermediate
CONSERVATIVE SCALPING (Quality over Quantity)
- Signal Sensitivity: LOW
- Timeframe: 15 minutes
- Expected trades: 1-3 per day
- Risk level: Lower
- Skill level: Beginner to Intermediate
═══════════════════════════════════════════════════════════════════════════
BEST PRACTICES FOR SCALPING
1. RISK MANAGEMENT
- Use ATR value from dashboard to set stop-losses (1.5-2x ATR)
- Risk no more than 1-2% per trade
- Use proper position sizing
2. ENTRY STRATEGY
- Wait for volume spike confirmation
- Ensure trend alignment (dashboard shows clear UP/DOWN)
- Look for RSI confirmation (not in extreme zones for trend trades)
- Check Z-Score for pair divergence opportunities
3. EXIT STRATEGY
- Take profits at opposite signal or predetermined targets
- Use trailing stops to protect profits
- Exit if volume dries up or trend reverses
- Monitor spread returning to mean
4. MARKET CONDITIONS
- Works best in trending or ranging markets
- Less effective during major news events
- Avoid trading during extremely low volume periods
- Most active during major market sessions (NY, London, Asia)
5. PAIR SELECTION
- Use highly correlated BTC pairs (BTCUSDT, BTCUSD, BTCBUSD)
- Ensure both pairs have sufficient liquidity
- Monitor spread threshold to avoid excessive divergence
═══════════════════════════════════════════════════════════════════════════
CUSTOMIZATION OPTIONS
You can adjust all parameters to match your trading style:
PAIR TRADING
- Pair Symbol: Choose your reference BTC pair
- Spread Threshold: Set alert level for spread divergence
- Show Spread: Toggle spread display on/off
MOVING AVERAGES
- Fast EMA: Adjust for faster/slower signals
- Slow EMA: Adjust for trend confirmation
- Trend SMA: Change long-term trend filter
RSI
- RSI Length: Modify sensitivity
- Overbought/Oversold levels: Set your thresholds
MACD
- Fast/Slow/Signal lengths: Fine-tune momentum detection
BOLLINGER BANDS
- Length: Change volatility period
- Multiplier: Adjust band width
VOLUME
- Volume MA Length: Modify average period
- Volume Threshold: Set spike sensitivity
═══════════════════════════════════════════════════════════════════════════
ALERT SETUP
To receive notifications:
1. Click the "Alerts" button in TradingView
2. Select "BTC Pair Trading Scalper"
3. Choose alert type: Buy Signal, Sell Signal, Spread Alert, etc.
4. Set notification method (email, SMS, app notification)
5. Click "Create"
═══════════════════════════════════════════════════════════════════════════
IMPORTANT DISCLAIMERS
⚠ This indicator is a TOOL, not a trading system
⚠ No indicator is 100% accurate - always use proper risk management
⚠ Past performance does not guarantee future results
⚠ Scalping requires quick decision-making and emotional discipline
⚠ Always backtest and paper trade before using real capital
⚠ Consider transaction costs and slippage in your strategy
⚠ This is not financial advice - trade at your own risk
