RSI-Adaptive, GKYZ-Filtered DEMA [Loxx]RSI-Adaptive, GKYZ-Filtered DEMA is a Garman-Klass-Yang-Zhang Historical Volatility Filtered, RSI-Adaptive Double Exponential Moving Average. This is an experimental indicator. The way this is calculated is by turning RSI into an alpha value that is then injected into a DEMA function to output price. Price is then filtered using GKYZ Historical volatility. This process of creating an alpha out of RSI is only relevant to EMA-based moving averages that use an alpha value for it's calculation.
What is Garman-Klass-Yang-Zhang Historical Volatility?
Yang and Zhang derived an extension to the Garman Klass historical volatility estimator that allows for opening jumps. It assumes Brownian motion with zero drift. This is currently the preferred version of open-high-low-close volatility estimator for zero drift and has an efficiency of 8 times the classic close-to-close estimator. Note that when the drift is nonzero, but instead relative large to the volatility , this estimator will tend to overestimate the volatility . The Garman-Klass-Yang-Zhang Historical Volatility calculation is as follows:
GKYZHV = sqrt((Z/n) * sum((log(open(k)/close( k-1 )))^2 + (0.5*(log(high(k)/low(k)))^2) - (2*log(2) - 1)*(log(close(k)/open(2:end)))^2))
Included
Alerts
Signals
Loxx's Expanded Source Types
Bar coloring
Buscar en scripts para "rsi"

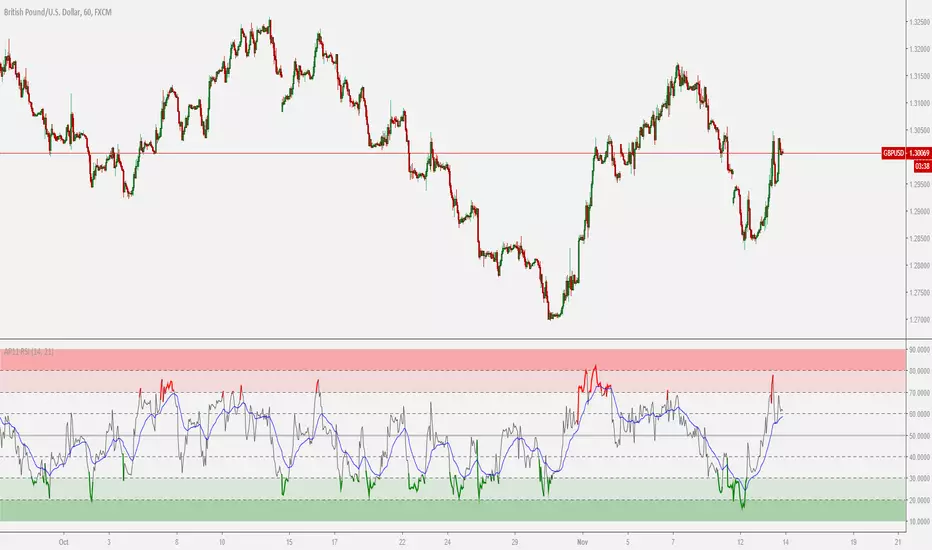
RSI with Bollinger Bands Binary system by Hashtag_binaryRSI with Bollinger Bands is binary options high/low trading system based on the volatility.
- Time frame 30min - 1H
- Expiry time 2 candles
- Markets: Forex currency pairs majors: EUR/USD, USD/CHF, GBP/USD, AUD/USD, NZD/USD, EUR/JPY, USD/JPY, AUD/JPY
Rules for RSI with Bollinger Bands Binary system
- Do not start before the economic news
- We wait for the price to eitherhit the lower bollinger band or the upper bollinger band and the moment this happens we take the trade immediatly.
Buy Put:
If the price touches the lower Bollinger band we and RSI is below the 30 we take a put.
Buy Call:
If the price touches the upper Bollinger band we and RSI is above the 70 we take a call.

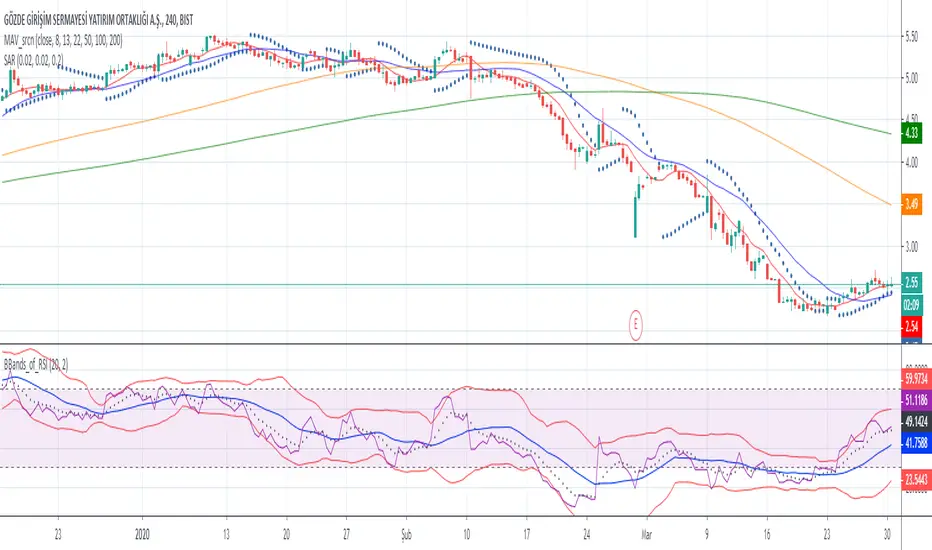
Bollinger Bands of RSIwith this script you can follow ema8 of RSI and also SMA20 of RSI with ∓ 2 standart deviation

RSI Reader DARK THEMERSI reader is an ADD-ON -184.95% of the indicator Market-Reader (available in TV too)
It will detect:
- bullish and bearish divergence
- bullish and bearish cycle on RSI
-When RSI is ready for an acceleration meaning that a significant bull or bear move can occur soon
It is also a RSI with less noise offering a more accurate analysis of the market without adding lag.
This Add-on -184.95% is Free for all user of the indicator Market-Reader.
This script will be continuously update
Access requires subscription (contact by MP 1.50% )

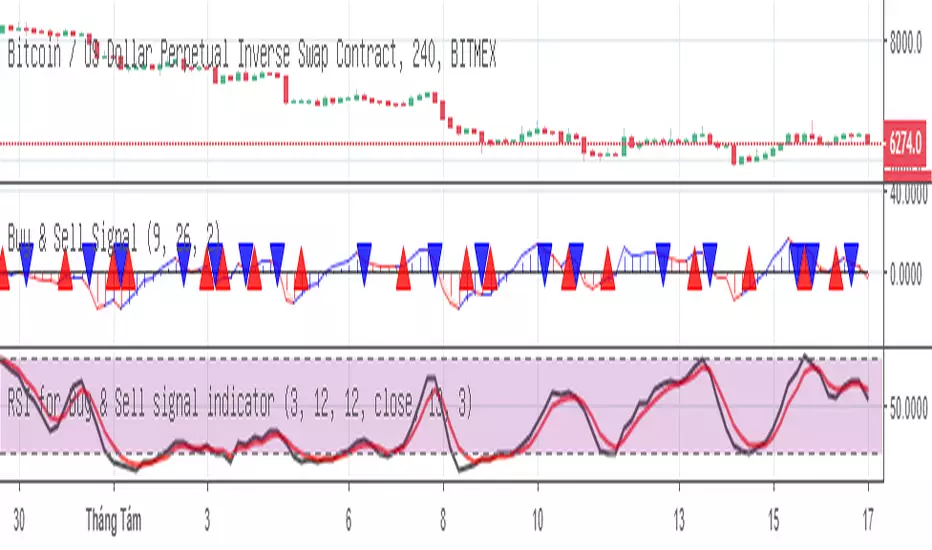
RSI for Buy & Sell signal indicatorRSI for Buy & Sell signal indicator
This indicator support for Buy & Sell signal indicator. Give advice for trader before make decision buy or sell. It was coded base on RSI source code + lengthStoch
Include 3 indicators in 1 set
1- Buy & Sell signal indicator
2- RSI for Buy & Sell signal indicator
3- MACD for Buy & Sell signal indicator
Feel free to inbox me for 3 days trial.
***************************************************************************************************************************************************
Gửi anh chị trader
Đây là chỉ báo điều kiện trong bộ chỉ báo gồm 3 chỉ báo tin hiệu mua và bán. Bộ chỉ báo này cung cấp những điều kiện cần và đủ trước khi vào lệnh về cơ bản chỉ là RSI nhưng được code riêng chỉ dành cho chỉ báo Buy & Sell signal indicator
Anh chị có nhu cầu vui lòng inbox test thử 3 ngày. Xin cảm ơn
RSI EMA TRENDRSI overbought and oversold are visible with red and green lines at the tip
Crossing of RSI and EMI is used to enter the trade for a quick scalp
Trend colours are used to see if the current market is bullish or bearish for a particular coin
look for the candle to close below EMA 5 (offset 2) on 15min chart, RSI below EMA (use trend color for confirmation)
look for the candle to close above EMA 5 (offset 2) on 15min chart, RSI above EMA (use trend color for confirmation)

RSI WMA Crossover Momentum w/ HighlightRSI WMA Crossover Momentum
This is a momentum indicator that tracks the RSI. Its principle is to use the WMA line to determine the trend of the RSI, and from the RSI, the price trend can be determined.

RSI WMA Crossover Momentum w/ Highlight by SfxinvestRSI WMA Crossover Momentum
This is a momentum indicator that tracks the RSI. Its principle is to use the WMA line to determine the trend of the RSI, and from the RSI, the price trend can be determined.

RSI + EMA Dynamic Zones + Volume + Divergence (with RSI 50 line)RSI + EMA Dynamic Zones + Volume + Divergence (with RSI 50 line)

RSI Divergence on 4-Hour with 1hr & 15min CorrectionRSI Divergence on 4-hr chart viewed on the hourly chart, watch hourly and 15min rsi levels interact with correction of the 4 hr rsi divergence.

RSI Divergence on Daily with 4hr & 1hr CorrectionRSI Divergence on Daily chart viewed in 4 hr timeframe to identifty 4 hr/1hr rsi corrections inside of the identified, Daily RSI level (source high)

RSI SMA ColorRSI 14 with SMA 21 Color. A momentum oscillator that measures the speed and change of price movements. It ranges from 0 to 100 and is typically used to identify overbought or oversold conditions in a market. An RSI above 70 may indicate that an asset is overbought, while an RSI below 30 may suggest it is oversold.

RSI with Divergence and Custom Bullish/Bearish RangesRSI indicator with bullish and bearish shaded ranges accounting for:
- tendency of RSI to peak lower than usual and drop lower than usual in bearish trends
- tendency of RSI to peak higher than usual and bottom out higher than usual in bullish trends

Averaged Stochastic RSI by TenozenSimplicity beats everything! Averaged Stochastic RSi is calculated using the 2 points of stochastic of the RSI, where the difference is by 2 (larger), and averaged out the stochastic's values. In result it is less noisy and more responsive towards the market's momentum.
I hope you guys find this indicator useful! So far this is the best indicator I ever had! And I also learned that simplicity is better than complex blurry/abstract problems. Ciao!

VWAP + 2 Moving Averages + RSI + Buy and SellIndicator: VWAP + 2 Moving Averages + RSI + Buy and Sell
Buy and Sell Arrows (Great for use alone or in conjunction with other scripts on the chart)
This indicator displays BUY (BUY) and SELL (SELL) arrows on the chart based on a combination of moving averages, VWAP and RSI. Arrows are a visual way to identify trading opportunities and can be useful for traders who want to follow a strategy based on these conditions.
The indicator uses two moving averages (20 and 50 periods) to identify upward crosses (buy) and downward crosses (sell). In addition, it takes into account VWAP (Volume Weighted Average Price) and RSI (Relative Strength Index) as additional filters to confirm buy and sell signals.
This script is great for use both independently and in conjunction with other indicators and strategies. You can combine it with other indicators and customize it to your preferences to create a more comprehensive trading strategy.
Please remember that this indicator is provided for educational purposes only and does not constitute financial advice. It is always recommended to carry out a thorough analysis before making any trading decisions.
Give this indicator a try and enjoy clear visualization of buy and sell arrows on your chart. Happy trading!

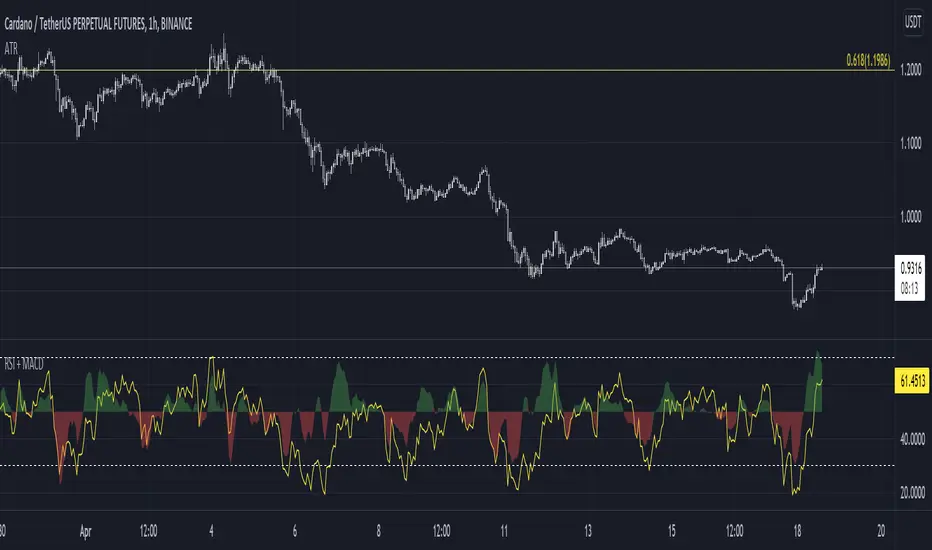
RSI + MACDRSI and MACD in one simplified indicator. Why? Because :
1. Save chart space, declutter, make decision making better, faster
2. MACD is not scaled to RSI range, now it is so you can have side by side comparison
Example how to use:
Enter on RSI oversold or overbought level, then exit on MACD crossover
See if there is an extra confluence to enter, hold or exit your trades, i.e oversold and falling macd is better than oversold and rising macd for short trades potentially.
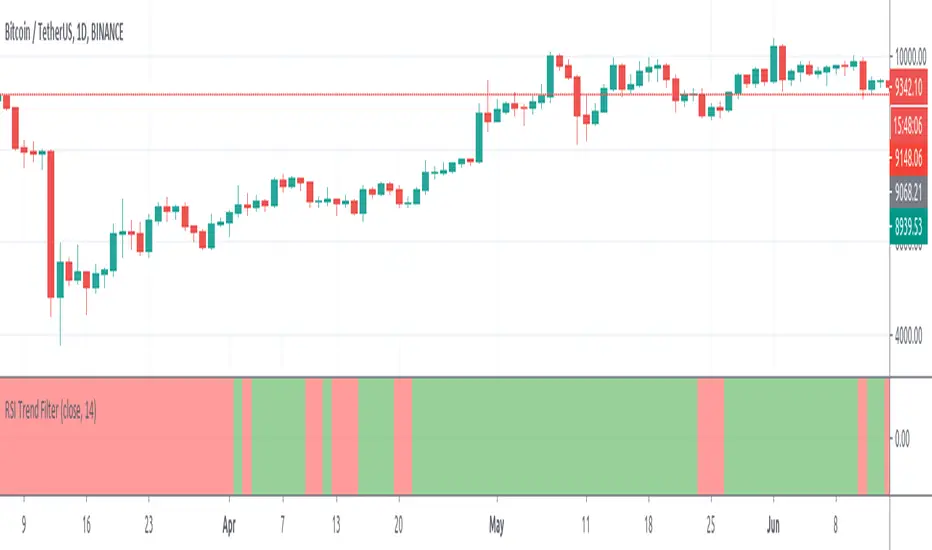
RSI Trend FilterRSI based basic trend filter. I don't used it in the NNFX structure but I wanted to test things.
Here RSI is not used as reversal indicator.
We check if RSI>50 or <50 and we use it as a trend confirmation indicator/filter.
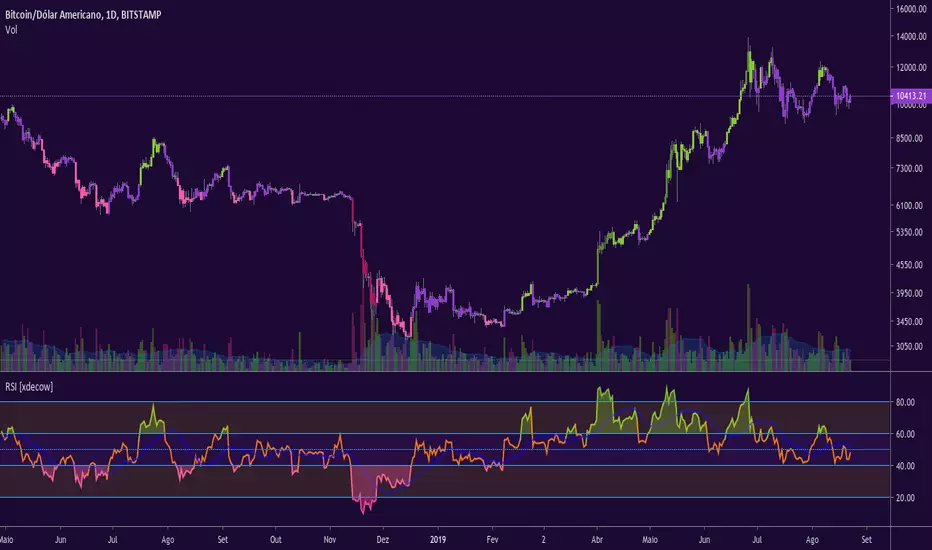
RSI [xdecow]RSI MTF
Options:
-MA
-RSI from another timeframe
-Uptrend/Downtrend zone
-barcolor based on RSI trend

TTM Apollo 11 RSIColor coded RSI to give a better indication of when to buy or sell based on the RSI level along with an included EMA signal to help describe the trend.