BTC BRD – Bullet-Proof Reversal DetectorThis indicator identifies true market reversals by analyzing raw price structure instead of traditional lagging indicators. It tracks how Bitcoin (and any crypto asset) naturally shifts direction by detecting confirmed swing points, followed by a structural break in the opposite direction. A bullish signal appears when price forms a higher low and then breaks above the previous structural high; a bearish signal forms when price creates a lower high followed by a break below the previous structural low.
Because it uses pure market structure, every signal reflects an actual change in trend direction, not a temporary pullback or indicator noise. This makes the tool highly reliable across all timeframes — from 1 minute scalping to multi-hour swing setups. The result is a clean, noise-free view of where the market truly reverses, giving traders clear confirmation points to plan entries, exits, or risk management.
Buscar en scripts para "reversal"

Time-Aware Reversal & ContinuationTime & Price 😉. Use this indicator to enhance your trading edge using a machine learning library aiding you predict reversals & continuations, automatically, stress free!

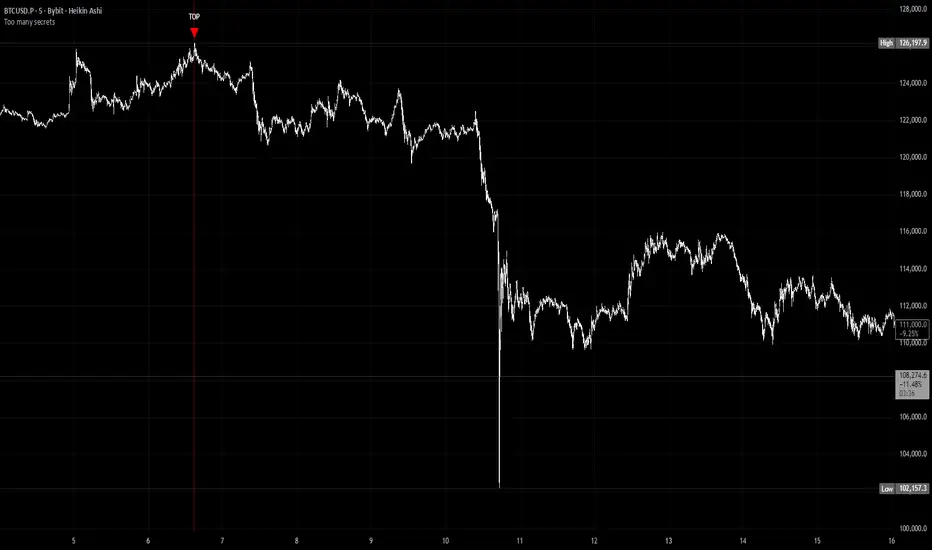
Too many secretsTOO MANY SECRETS - Extreme Condition Signal Detector
This indicator identifies extreme market conditions and provides clear TOP and BOTTOM signals when specific criteria are met. Designed for traders who want reliable entry points without the noise.
KEY FEATURES:
No Repaint - Once a signal prints, it's locked in and will not disappear or change
Smart Filtering - The Blackbox and other proprietary modules prevent signal spam, ensuring only high-quality setups trigger alerts
Customizable Alerts - Use as a multi-symbol screener across different timeframes
Visual Strike Lines - Optional vertical lines mark exact signal locations with adjustable transparency
Clean Interface - Minimal chart clutter with maximum information
CLASSIFIED METHODOLOGY:
The internal workings of this indicator, including the Blackbox module and other signal processing components, are intentionally classified. The specific calculations, timeframes, and confluence requirements remain undisclosed.
RECOMMENDED USAGE:
Best viewed on 5 minute charts
Configure alerts to monitor multiple symbols simultaneously
Adjustable Blackbox parameter allows fine-tuning for your trading style
IMPORTANT NOTES:
Bar Replay: Signals only appear on 5x or faster speeds during replay. In live trading, signals appear instantly in real-time.
This is highly experimental. Not financial advice - trade at your own risk.
WHAT YOU GET:
TOP signals (red triangles) for potential bearish reversals
BOTTOM signals (green triangles) for potential bullish reversals
Alert conditions for automated notifications
Splash screen with setup guidance (can be toggled off)
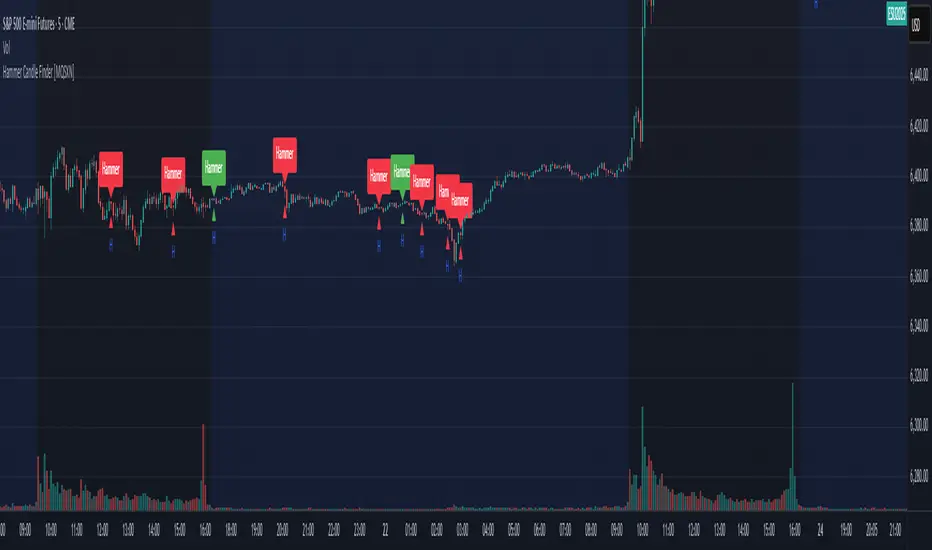
Hammer Candle Finder [MQSXN]This script automatically scans your chart for hammer candlestick patterns and highlights them with fully customizable labels and markers. Hammers are classic price action signals that can suggest potential reversals or exhaustion in the current trend.
How it works:
- Detects candles with a small body near the top of the range, a long lower wick, and minimal upper wick.
- Separates bullish hammers (green close above open) from bearish hammers (red close below open).
- You can choose to display either type—or both—depending on your trading style.
Customizable options:
- Adjustable detection sensitivity (body % of range, wick-to-body ratio, top wick allowance).
- Toggle to show/hide bullish or bearish signals.
- Custom text, colors, label style, and positioning for the markers.
- Option to anchor labels above bars automatically or offset them by a set number of ticks.
Usage:
This tool is designed for traders who want a clear, visual way to spot hammer candles in real time or during historical chart analysis. Combine it with your own support/resistance zones, volume analysis, or confirmation indicators to build complete strategies.
Note:
This indicator does not provide buy/sell signals on its own—it’s meant to assist with candlestick recognition. Always confirm with your broader trading plan and risk management rules.
Momentum Reversal StrategyBEST USE IN 15MIN TIME FRAME EURUSD / XAUSUD
1. Strategy Overview
This strategy hunts short-term momentum reversals at key levels during high-liquidity sessions.
Timeframes: 5-minute for entries; 15-minute for trend context
Sessions: London for EUR/USD & GBP/USD; New York for XAU/USD
Pairs: EUR/USD, GBP/USD, XAU/USD
Indicators (3 max):
EMA(20) and EMA(50) (close)
MACD (12, 26, 9) histogram
Optional: RSI(14) (for divergence filter)
2. Entry Rules
Trend Filter (15 min):
Long only if EMA20 > EMA50; short only if EMA20 < EMA50.
Price-Action Zone (5 min):
Identify recent swing high/low within past 20 bars.
Draw horizontal support (for longs) or resistance (for shorts).
Indicator Alignment (5 min):
MACD histogram crossing from negative to positive for longs, positive to negative for shorts.
Candle close beyond EMA20 in direction of trade.
Candle Confirmation:
Bullish engulfing or hammer at support for longs; bearish engulfing or shooting star at resistance for shorts.
Entry Execution:
Place market order on candle close that meets all above.
3. Exit Rules
Stop-Loss (SL):
Long: 1.5× ATR(14) below entry candle low.
Short: 1.5× ATR(14) above entry candle high.
Take-Profit (TP):
Set at 2× SL distance (RR 1:2).
Trailing SL:
After price moves 1× SL in profit, trail SL to breakeven.
Partial Booking:
Close 50% at 1× SL (50% of TP), move SL to entry.
Close remaining at full TP.
4. Trade Management
False Signal Filter: Skip trades when RSI(14) > 70 for longs or < 30 for shorts (avoids overbought/oversold extremes).
One Trade at a Time: No multiple positions on same pair.
Session Cutoff: Close any open trade 15 minutes before session end.
5. Risk Parameters
Risk per Trade: 1% of account equity.
Reward Target: ≥2% (1:2 RR) per trade.
Win-Rate Expectancy: ≥75% based on indicator confluence and price-action confirmation.

Williams Fractals Ultimate (Donchian Adjusted)Williams Fractals Ultimate (Donchian Adjusted)
Understanding Williams Fractals
Williams Fractals are a simple yet powerful tool used to identify potential turning points in the market. They highlight local highs (up fractals) and local lows (down fractals) based on a set period.
An up fractal appears when a price peak is higher than the surrounding prices.
A down fractal appears when a price low is lower than the surrounding prices.
Fractals help traders spot support and resistance levels, potential trend reversals, and price breakout zones.
Why Adjust Fractals with the Donchian Channel?
The standard Williams Fractals method identifies local highs and lows without considering broader market context. This script enhances fractal accuracy by integrating the Donchian Channel, which tracks the highest highs and lowest lows over a set period.
- The Donchian Baseline is calculated as the average of the highest high and lowest low over a selected period.
- Fractals are filtered based on this baseline:
Up Fractals are only shown if they are above the Donchian baseline.
Down Fractals are only shown if they are below the Donchian baseline.
This filtering method removes weak signals and ensures that only relevant fractals aligned with market structure are displayed.
Key Features of the Script
Customizable Fractal & Donchian Periods – Allows traders to fine-tune fractal sensitivity.
Donchian-Based Filtering – Reduces noise and highlights meaningful fractals.
Fractal ZigZag Line (Optional) – Helps visualize price swings more clearly.
Why Is This So Effective?
Stronger trend signals – Filtering with the Donchian baseline eliminates unreliable fractals.
Clearer price action – The optional ZigZag line visually connects significant highs and lows.
Easy trend identification – Helps traders confirm breakout zones and key price levels.
This script is a technical analysis tool and does not guarantee profitable trades. Always combine it with other indicators and risk management strategies before making trading decisions.

Wick Volume AlertThis indicator is intended to find a possible price reversal and is well suited for scalping in the smaller timeframes from 1 to 15min chart. It is important to use it in conjunction with other indicators such as order blocks or price levels.
The advantage over other Wick indicators is that volume is also taken into account.
Unfortunately, the markers on the chart do not work properly as they do not attach themselves when moving vertically. I would be happy if someone could fix the problem, as I am not a professional in Pine scripting.

Exponential Avg Body Size Green vs RedDescription :
This indicator calculates and plots the Exponential Moving Average (EMA) of green and red candlestick body sizes, allowing traders to easily visualize market momentum and sentiment shifts. The script includes the following features:
Customizable EMA Period: Users can set the number of candles to calculate the EMA through an input setting, with a default value of 21.
Separate Green and Red Candle Averages: Differentiates between bullish (green) and bearish (red) candlestick movements, plotting them as distinct lines.
Dynamic Range Control: Users can adjust the chart range (e.g., -50 to 50) for better visibility of the plotted lines.
Baseline for Reference: A horizontal baseline at 0 serves as a visual aid for easier interpretation.
Standalone Indicator Pane: The script is designed to display in a separate pane, preventing overlap with the price chart.
Use Case:
This indicator is ideal for traders seeking to analyze the relative strength of bullish versus bearish price movements over a specific period. The separation of green and red averages helps identify trends, potential reversals, or shifts in momentum.

VWAP Bands [UAlgo]The "VWAP Bands " indicator is designed to provide traders with valuable insights into market trends and potential support/resistance levels using Volume Weighted Average Price (VWAP) bands. This indicator integrates the core concepts of VWAP with additional trend analysis features, making it a versatile tool for both range trading and trend-following strategies.
The VWAP bands are plotted based on the standard deviation multipliers, creating upper and lower bands around the VWAP. These bands serve as dynamic support and resistance levels. When the price approaches these bands, traders can anticipate potential reversals or continuations of the current trend. Additionally, the indicator provides visual cues for trend strength and potential trend changes, helping traders make informed decisions in various market conditions.
🔶 Settings
Source (Data Source): The data source for VWAP calculations. The default setting is the typical price (HLC3), which is the average of the high, low, and close prices.
Length: The number of bars used in the VWAP calculation. This determines the lookback period for the indicator.
Standard Deviation Multiplier: The multiplier applied to the standard deviation to create the primary upper and lower VWAP bands. This setting controls the distance of the bands from the VWAP.
Secondary Standard Deviation Multiplier: The multiplier applied to the standard deviation to create the secondary upper and lower VWAP bands, providing additional levels of support and resistance.
Display Trend: A toggle to enable or disable the display of the trend analysis feature. When enabled, the indicator highlights trend strength and potential trend changes.
Display Trend Crossovers: A toggle to enable or disable the display of trend crossover signals. When enabled, the indicator plots shapes to indicate where trend switches are likely occurring.
🔶 Calculations
The calculations behind the "VWAP Bands " indicator begin with determining the Volume Weighted Average Price (VWAP), which provides a comprehensive view of the average price of an asset, weighted by trading volume. This gives a more accurate representation of the asset's true average price over a specified period.
The first step in this process involves summing the trading volume over a chosen period, typically represented by the length parameter. Simultaneously, the product of the price (usually an average of the high, low, and close prices) and the trading volume is calculated and summed. By dividing this cumulative price-volume product by the total volume, we obtain the VWAP value. This VWAP serves as the central anchor around which the price action oscillates.
To enhance the utility of VWAP, we introduce standard deviation calculations. Standard deviation measures the extent of price dispersion from the VWAP, providing insight into price volatility. By calculating the variance (which involves the squared deviations of price) and then taking its square root, we derive the standard deviation. This helps in understanding how far prices typically stray from the VWAP.
With the VWAP and standard deviation in hand, we then establish upper and lower bands by adding and subtracting multiples of the standard deviation from the VWAP. These bands act as dynamic support and resistance levels, adapting to changes in market volatility. The primary bands, set by the first standard deviation multiplier, are augmented by secondary bands defined by a larger multiplier, offering additional layers of potential support and resistance.
It also integrates trend analysis, highlighting areas where the price action suggests a strong or weak trend. This is achieved by overlaying colored zones above and below the bands, indicating the strength and direction of the trend. When the price crosses these bands, it signals potential trend changes, aiding traders in making timely decisions.
🔶 Disclaimer
The "VWAP Bands " indicator is provided for educational and informational purposes only. It is not intended as financial advice and should not be construed as such.
Trading involves significant risk and may not be suitable for all investors. Before using this indicator or making any investment decisions, it is important to conduct thorough research and consider your financial situation.

Trend Channels With Liquidity Breaks [ChartPrime]Trend Channels
This simple trading indicator is designed to quickly identify and visualize support and resistance channels in any market. The primary purpose of the Trend Channels with Liquidity Breaks indicator is to recognize and visualize the dominant trend in a more intuitive and user-friendly manner.
Main Features
Automatically identifies and plots channels based on pivot highs and lows
Option to extend the channel lines
Display breaks of the channels where liquidity is deemed high
Inclusion of volume data within the channel bands (optional)
Market-friendly and customizable colors and settings for easy visual identification
Settings
Length: Adjust the length and lookback of the channels
Show Last Channel: Only shows the last channel
Volume BG: Shade the zones according to the volume detected
How to Interpret
Trend Channels with Liquidity Breaks indicator uses a combination of pivot highs and pivot lows to create support and resistance zones, helping traders to identify potential breakouts, reversals or continuations of a trend.
These support and resistance zones are visualized as upper and lower channel lines, with a dashed center line representing the midpoint of the channel. The indicator also allows you to see the volume data within the channel bands if you choose to enable this functionality. High volume zones can potentially signal strong buying or selling pressure, which may lead to potential breakouts or trend confirmations.
To make the channels more market-friendly and visually appealing, Trend Channels indicator also offers customizable colors for upper and lower lines, as well as the possibility to extend the line lengths for further analysis.
The indicator displays breaks of key levels in the market with higher volume.

Chop and Trend Index (CTI)The Chop and Trend Index (CTI) is a unique indicator that provides a different perspective on market conditions compared to traditional oscillators. It is designed to identify periods of market chop and strong trends, and it does so by combining two key components: the number of halfback taps and the strength of the trend.
The CTI is calculated by first determining the number of halfback taps over a user-defined length of time. A halfback tap occurs when the high or low of a bar reaches the midpoint (halfback level) of the previous bar. This is a measure of market chop: the more halfback taps, the choppier the market. The fewer halfback taps, the stronger the trend.
The strength of the trend is determined using the Average Directional Index (ADX), a popular trend strength indicator. The ADX is calculated based on the directional movement of the market, with higher values indicating stronger trends.
The CTI combines these two components by multiplying the normalized number of halfback taps by the ADX value. This results in an indicator that rises during strong trends with few halfback taps (either up or down) and falls during periods of market chop.
The CTI is not a directional indicator. Unlike the Relative Strength Index (RSI) or other oscillators, high values do not indicate overbought conditions, and low values do not indicate oversold conditions. Instead, high values indicate a strong trend (and possibly trend exhaustion), while low values indicate strong chop (and possibly an impending breakout in either direction).
The CTI can be used on any market and any timeframe, but it may be particularly useful on longer timeframes where periods of chop and trend are more pronounced.
The CTI includes several user inputs :
Length : This determines the number of bars over which the number of halfback taps is calculated. Increasing this value will make the CTI less sensitive to recent market conditions, while decreasing it will make the CTI more sensitive.
Normalization Window Length : This determines the number of bars over which the CTI is normalized. The CTI is normalized to a scale of 0 to 100 to make it easier to compare across different markets and timeframes.
Chop Threshold : This is the CTI value below which an alert will be triggered indicating a period of severe chop. This could signal an impending breakout and potential upcoming volatility.
Trend Exhaustion Threshold : This is the CTI value above which an alert will be triggered indicating potential trend exhaustion. This could signal a possible mean reversion.
The CTI also includes four colored threshold lines at 10, 25, 75, and 90. These thresholds can be used as a guide to identify periods of chop and trend. For example, CTI values below 10 or above 90 could indicate extreme conditions.
The CTI provides two alert conditions :
Low Threshold Crossed : This alert is triggered when the CTI falls below the user-defined Chop Threshold. This could signal a period of severe chop and the potential for upcoming volatility.
High Threshold Crossed : This alert is triggered when the CTI rises above the user-defined Trend Exhaustion Threshold. This could signal potential trend exhaustion and the possibility of mean reversion.
In conclusion, the CTI is a unique and versatile indicator that can provide valuable insights into market conditions. By identifying periods of chop and trend, it can help traders anticipate potential breakouts and reversals, and adjust their strategies accordingly.

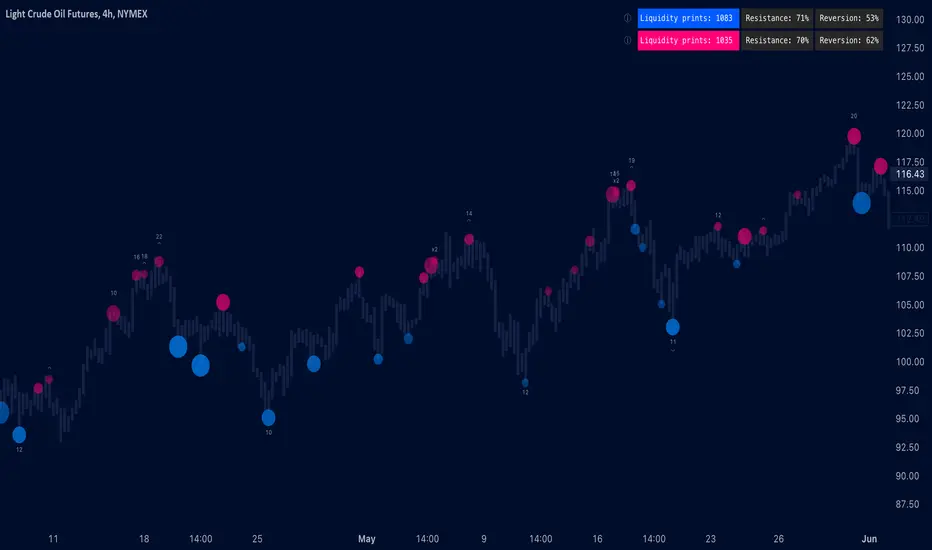
Liquidity prints / quantifytools- Overview
Liquidity prints detect points in price where buyers or sellers are being effectively absorbed, indicative of price being on a path of resistance. In other words, the prints detect points in price where hard way is likely in current motion and easy way in the opposite. Prints with ideal attributes such as prints into extended trends or into a deviation are marked separately as print confluence. Prints with important or multiple confluence factors give further color into potential strength and duration of print influence. Liquidity prints are detected using an universally applicable method based on price action (OHLC). The prints principally work on any chart, whether that is equities, currencies, cryptocurrencies or commodities, charts with volume data or no volume data. Essentially any asset that can be considered an ordinary speculative asset. The prints also work on any timeframe, from second charts to monthly charts. Liquidity prints are activated real-time after a confirmed bar close, meaning they are not repainted and can be interacted with once a confirmation is in place.
Liquidity prints are based on the premise that price acts a certain way when sufficient liquidity is found, in other words when price shows exhaustion of some sort. A simple example of such price action are wicks, attempted moves that were rejected within the same time period where move was initiated. This type of price action typically takes place when price is close to or at meaningful amount of bids in an order book. There's no guarantee the stacked orders can't be just cleared and moved through, but at face value it does not make sense to expect price moving the hard way. When sufficient amount of characteristics in price action are hinting proximate liquidity, a print is activated. As a barometer for print feedback quality, short term impact on price rate of change and likelihood of print lows/highs being revisited during backtesting period are tracked for each print. Peak increase/decrease during backtesting period is also recorded and added to average calculations. Liquidity prints can also be backtested using any script that has a source input, including mechanic strategies utilizing Tradingview's native backtester.
Key takeaways
Liquidity prints are activated when price is showing signs of grind against path of greater resistance, leaving path of least resistance to the opposite direction.
Liquidity prints with ideal attributes are marked separately as print confluence, giving further color into print strength and duration of influence.
Liquidity prints are backtested using price rate of change, print invalidation mark and peak magnitude metrics.
Liquidity prints can be backtested and utilized in any other Tradingview script, including mechanic strategies utilizing Tradingview's native backtester.
Liquidity prints are detected using price action based methodology. They principally work on any chart or timeframe, including charts with no volume data.
Liquidity prints are activated real-time after a confirmed bar close and are not repainted.
For practical guide with practical examples, see last section.
Accessing script 🔑
See "Author's instructions" section, found at bottom of the script page.
Disclaimer
Liquidity prints are not buy/sell signals, a standalone trading strategy or financial advice. They also do not substitute knowing how to trade. Example charts and ideas shown for use cases are textbook examples under ideal conditions, not guaranteed to repeat as they are presented. Liquidity prints notify when a set of conditions (various reversal patterns, overextended price etc.) are in place from a purely technical standpoint. Liquidity prints should be viewed as one tool providing one kind of evidence, to be used in conjunction with other means of analysis.
Liquidity print quality is backtested using metrics that reasonably depict their expected behaviour, such as historical likelihood of price slowing down or turning shortly after a print. Print quality metrics are not intended to be elaborate and perfect, but to serve as a general barometer for print feedback. Backtesting is done first and foremost to exclude scenarios where prints clearly don't work or work suboptimally, in which case they can't be considered as valid evidence. Even when print metrics indicate historical reactions of good quality, price impact can and inevitably does deviate from the expected. Past results do not guarantee future performance.
- Example charts
Chart #1: BTCUSDT
Chart #2: DXY
Chart #3: NQ futures
Chart #4: Crude oil futures
Chart #5: Custom timeframes
- Print confluence
Attributes that make prints ideal in one way or another are marked separately as print confluence, giving clue into potential strength and duration of print influence. Prints with important or multiple confluence factors can be considered as heavier and more reliable evidence of price being on a path of resistance. Users can choose which confluence to show/hide (by default all) and set a minimum amount of confluence for confluence text to activate (by default 1).
Confluence type #1: Trend extensions
Price trending for abnormally long time doesn't happen too often and requires effort to sustain. Prints taking place at extended trends often have a longer duration influence, indicating a potential larger scale topping/bottoming process being close. Trend extension confluence is indicated using a numbered label, equal to amount of bars price has been in a trending state.
Confluence type #2: Consecutive prints
Prints that take place consecutively imply heavier resistance ahead, as required conditions trigger multiple times within a short period. Consecutive prints tend to lead to more clean, aggressive and heavier magnitude reactions relative to prints with no confluence. Consecutive print confluence is indicated using a numbered label with an x in front, equal to amount of prints that have taken place consecutively.
Confluence type #3: Deviations
When price closes above/below prior print highs/lows and closes right back in with a print, odds are some market participants are stuck in an awkward position. When market participants are stuck, potential for a snowball effect of covering underwater positions is higher, driving price further away. Prints into deviations act similarly to consecutive prints, elevating potential for more aggressive reactions relative to prints with no confluence. Deviation confluence is indicated using a label with a curve symbol.
- Backtesting
Built-in backtesting is based on metrics that are considered to reasonably quantify expected behaviour of prints. Main purpose of the metrics is to form a general barometer for monitoring whether or not prints can be viewed as valid evidence. When prints are clearly not working optimally, one should adjust expectations accordingly or take action to improve print performance. To make any valid conclusions of print performance, sample size should also be significant enough to eliminate randomness effectively. If sample size on any individual chart is insufficient, one should view feedback scores on multiple correlating and comparable charts to make up for the loss.
For more elaborate backtesting, prints can be used in any other script that has a source input, including fully mechanic strategies utilizing Tradingview's native backtester. Print plots are created separately for regular prints and prints with each type of confluence.
Print feedback
Print feedback is monitored for 3 bars following a print. Feedback is considered to be 100% successful when all 3/3 bars show a supportive reaction. When 2/3 bars are supportive, feedback rate is 66%, 1/3 bars = 33% and 0/3 = 0%. After print backtesting period is finished, performance of given print is added to average calculations.
Metric #1 : Rate of change
Rate of change used for backtesting is based on OHLC4 average (open + high + low + close / 4) with a length of 3. Rate of change trending up is considered valid feedback for bullish liquidity prints, trending down for bearish liquidity prints. Note that trending rate of change does not always correlate with trending price, but sometimes simply means current trend in price is slowing down.
Metric #2 : Invalidation mark
Print invalidation marks are set at print low/high with a little bit of "wiggle room". Wiggle room applied is always 1/10th of print bar range. E.g. for a bullish print with bar range of 2%, invalidation mark is set to 0.20% below print low. For most prints this is practically at print low/high, but in the case of prints with high volatility a more noticeable excess is given, due to the expectation of greater adverse reaction without necessarily meaning invalidation. A low being above invalidation mark is considered valid feedback for bullish prints and a high being below invalidation mark for bearish prints.
Metric #3 : Peak increase/decrease
Unlike prior two metrics, peak increase/decrease is not feedback the same way, but rather an assisting factor to be viewed with feedback scores. Peak increase/decrease is measured from print close to highest high/lowest low during backtesting period and added to average calculations
Feedback scores
When liquidity prints are working optimally, quality threshold for both feedback metrics are met. By default, threshold is set to 66%, indicating valid feedback on 2/3 of backtesting periods on average. When threshold is met, a tick will appear next to feedback scores, otherwise an exclamation mark indicating suboptimal performance on either or both.
By default, the prints are filtered as little as possible, idea behind being that it is better to have more poor prints filtered with discretion/mechanically afterwards than potentially filtering too much from the get go. Sometimes filtering is insufficient, leading to failed reactions beyond a tolerable level. When this is the case, print sensitivity can be adjusted via input menu, separately for bullish and bearish prints. Print filter sensitivity ranges from 1 to 5, by default set to 1. Lower sensitivity sets looser criteria for print activation, higher sensitivity sets stricter criteria. For most charts and timeframes default sensitivity works just fine, but when this is not the case, filters can be tweaked in search of better settings. If feedback score threshold is met, it's better to keep filter sensitivity intact and use discretion, which is much more nuanced and capable than any mechanical process. If feedback scores are still insufficient after tweaking, depending on the severity of lack, prints should be vetted extra carefully using other means of analysis or simply avoided.
Verifying backtest calculations
Backtest metrics can be toggled on via input menu, separately for bullish and bearish prints. When toggled on, both cumulative and average counters used in print backtesting will appear on "Data Window" tab. Calculation states are shown at a point in time where cursor is hovered. E.g. when hovering cursor on 4th of January 2021, backtest calculations as they were during this date will be shown. Backtest calculations are updated after backtest period of a print has finished (3 bars). Assisting backtest visuals are also plotted on chart to ease inspection.
- Alerts
Available alerts are the following.
- Bullish/bearish liquidity print
- Bullish/bearish liquidity print with specified print confluence
- Bullish/bearish liquidity print with set minimum print confluence amount exceeded
- Visuals
Visual impact of prints can be managed by adjusting width and length via input menu. Length of prints is available in 3 modes (1-3 from shortest to longest) and width in 10 modes (1-10 from narrowest to widest).
Print confluence text can be embedded inside print nodes, eliminating visuals outside the chart.
Metric table is available in two themes, Classic and Stealth.
Metric table can be offsetted horizontally or vertically from any four corners of the chart, allowing space for tables from other scripts.
Table sizes, label sizes and colors are fully customizable via input menu.
-Practical guide
Key in maximizing success with prints is knowing when they are likely reliable and when not. In general, the more volatile and ranging the market regime, the better liquidity prints will work. Any type of volatile spike in price, parabola or a clean range is where liquidity prints provide optimal feedback. On the other hand low volatility and trending environments are suboptimal and tend to provide more mute/lagged or completely failed feedback. Anomalies such as market wide crashes are also environments where prints can't be expected to work reliably.
Being aware of events on multiple timeframes is crucial for establishing bias for any individual timeframe. Not often it makes sense to go against higher timeframe moves on lower timeframes and this principle of timeframe hierarchy also applies to prints. In other words, higher timeframe prints dictate likelihood of successful prints on lower timeframes. If hard way on a weekly chart is up, same likely applies to daily chart during weekly print influence time. In such scenarios, it's best to not swim in upstream and avoid contradicting lower timeframe prints, at least until clear evidence suggesting otherwise has developed.
Points in price where it anyway makes sense to favor one side over the other are key points of confluence for prints as well. Prints into clean range highs/lows with clean taps can be valuable for optimal entry timing. This is especially true if simultaneously previous pivot gets taken out, increasing odds of liquidity indicated by a print being swept stop-losses.
Prints that don't match underlying bias (e.g. bullish prints at range high, bearish prints at range low) should be avoided until clear evidence has developed favoring them, such as a convincing break through a level followed by a re-test.
Prints that are immediately rejected aggressively are more likely prints that end up failing. Next bar following a print closing below print lows/above print highs is a strong hint of print failure. To consider print still valid in such cases, there should be quick and clear defending of print lows/highs. Failed prints are an inevitable bummer, but never useless. Failed prints are ideal for future reference, as liquidity still likely exists there. Re-tests into these levels often provide sensible entries.
Stacked confluence doesn't come too often and is worth paying special attention to, as multiple benefitting factors are in place simultaneously.
From a more zoomed out perspective, any larger zone with multiple prints taking place inside are potential topping/bottoming processes taking place, also worth paying attention to.
Rainbow Collection - VioletMoving averages come in all shapes and types. The most basic type is the simple moving average which is simply the sum divided by the quantity. Therefore, the simple moving average is the sum of the values divided by their number.
In technical analysis, you generally use moving averages to understand the underlying trend and to find trading signals. In the case of the Violet indicator, we are using a Hull moving average which is a special variation based on different weights to minimize lag.
The Violet indicator is therefore used as follows:
* A bullish signal is generated whenever the close price surpasses the 20-period Hull moving average while the previous close prices from periods were all below their respective Hull moving average of the period.
*A bearish signal is generated whenever the close price breaks the 20-period Hull moving average while the previous close prices from periods were all above their respective Hull moving average of the period.
The aim of the Violet indicator is to capture reversals as early as possible through a combination of lagged conditions based on the Fibonacci sequence.

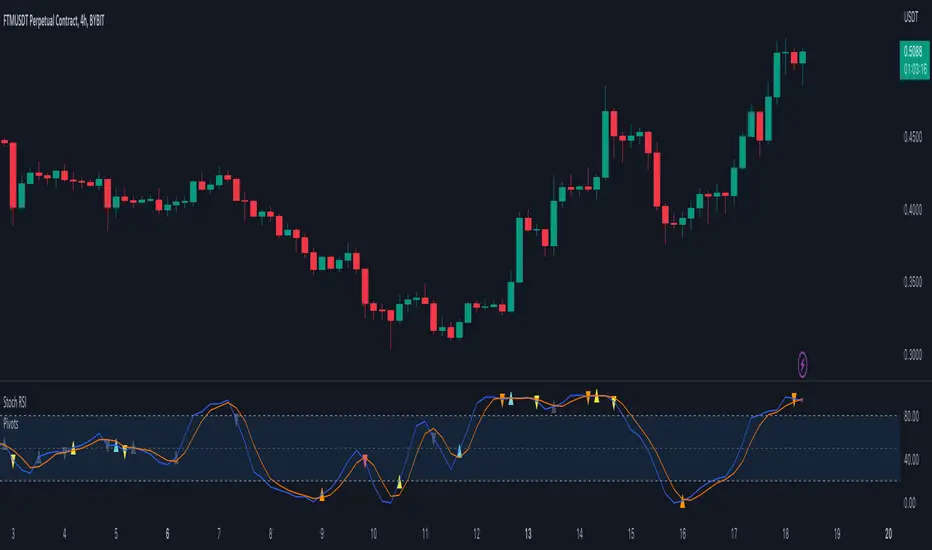
Pivots For IndicatorsThis is an overlay indicator that finds and identifies pivots. It is very sensitive so works best on smoother oscillators such as Stoch RSI. Make sure you set the source to your indicator after you overlay it. You will need to adjust the rev high and low inputs in the settings. For example Stoch RSI would have a revhigh = 80 and revlow = 20. This script is not designed to work on the chart.
Yellow = First Higher low or First Lower High
Orange = Reversal (Indicator low and high levels can be adjusted in settings.
Teal = Higher Low
Red = Lower High
Gray = Higher high or Lower Low
Return Abnormality Score [SpiritualHealer117]The Return Abnormality Score indicator is designed to help traders identify potential reversals in price by detecting abnormal daily returns beyond a certain significance level. The indicator uses a normal cumulative distribution function to calculate the probability of the daily return and flags it when it exceeds the specified significance level.
Traders can use this indicator by monitoring the abnormality score. If the daily return is negative, the probability is multiplied by a negative number. Therefore, if the abnormality score goes above the positive threshold, it suggests that the price is oversold, while if it goes below the negative threshold, it indicates that the price is overbought. It can also be helpful for spotting bear or bull traps due to their irregular behavior.
Depending on the trader's preference, the indicator can be smoothed or unsmoothed.
This indicator should be paired with other technical analysis tools like SSL Hybrid for trend confirmation, and proper risk management strategies.

Cosmic GravityCosmic Gravity draws dynamic non-repainting trendlines and helps
⭐ know when to scalp
⭐ predict the position and timing of the next major reversal
⭐ predict sudden changes in volatility
⭐ recognize if the trend is bearish or bullish
👀 HOW IT WORKS
Cosmic Gravity draws a dynamic channel consisting of a basis line and several support and resistance levels for low/medium/high volatility situations, as defined by the Inner Channel and 2 Outer Channel plots respectively. The script achieves this by reducing a large number of select moving averages, their multiples, and other trend levels into a single basis line and deriving the remaining plots off of it using ATR and probability-constant multiples. The basis line color is determined by its smoothed vector similar to how our Cosmic Vector indicator paints its plot. The aim of this indicator is to provide a consistent and generic price context that works out-of-the-box; accordingly a single static average period is used throughout and the settings have been stripped to the bare minimum with no need to ever update them.
📗 HOW TO USE IT
Cosmic Gravity's channel levels are meant to be used as a guide for entering and exiting positions and setting stop-loss and take profit levels. The indicator is deemed effective for any particular timeframe as long as the price stays within the maximum bounds of the indicator's plots. For this reason it is recommended to use Cosmic Gravity in a multi-chart layout where each chart has a different timeframe. The 5 primary strategies are:
long when the price reverses off of an Outer Channel support level and short when the price reverses off of an Outer Channel resistance level
long when the price crosses above the basis line after being below it for a prolonged period and vice-versa (short when the price trend moves below the basis line)
long when the basis line color turns blue after being pink for a prolonged period and visa-versa (short when the basis line color turns pink)
long/short in the direction the price takes when it goes outside the Magnetic Gravity channel when this channel is in a tight squeeze
scalp as the price bounces between the Inner Channel levels (do this only while the price is contained inside the Inner Channel )
🔔 SMART ALERTS
Get notified at the most critical times with a single alert. Simply select Cosmic Gravity - Any alert() function call as the condition when creating an alert and you will be tipped-off on bar-close as follows:
RR↘ (price close crossed below Outer Channel R6 plot)
RR↗ (price high crossed above Outer Channel R6 plot)
R└ (price low entered R channel from above)
R┘ (price high exited R channel from above)
R┐ (price high exited R channel from below)
R┌ (price high entered R channel from below)
B↘ (price high crossed below Basis plot)
B↗ (price low crossed above Basis plot)
B╮ ( Basis vector turned negative)
B╯ ( Basis vector turned positive)
S└ (price low entered S channel from above)
S┘ (price low exited S channel from above)
S┐ (price low exited S channel from below)
S┌ (price high entered S channel from below)
SS↘ (price low crossed below Outer Channel S6 plot)
SS↗ (price close crossed above Outer Channel S6 plot)
For example, an alert such as Cosmic Gravity 6H R┐ B↘ means that during the last 6-hour bar the price exited the R channel from below and also crossed below the basis line.
🚩 DISCLAIMER
The information we create and publish here is not prohibited, doesn't constitute investment advice, and isn't created solely for qualified investors.

RSI Exhaustion + DivergenceThe Relative Strength Index Exhaustion with Divergence is an essential replacement of the standard Relative Strength Index Oscillator because it's able to identify and highlight hidden exhaustions together with Bullish/Bearish Regular and Hidden Divergences.
This indicator can give the outmost probability in spotting trend reversals or trend continuation.
By identifying hidden exhaustion momentum, the Relative Strength Index Exhaustion indicator represents an essential support to the trader in effectively reading the market and grabbing the best opportunities.
This detects divergences between price and indicator with 1 candle delay so it filters out repeating divergences.
Recommended to use this at a higher timeframe to lessen the false signals.
Red Arrow = Bullish/Bearish Divergence
White Arrow = Hidden Bullish/Bearish Divergence
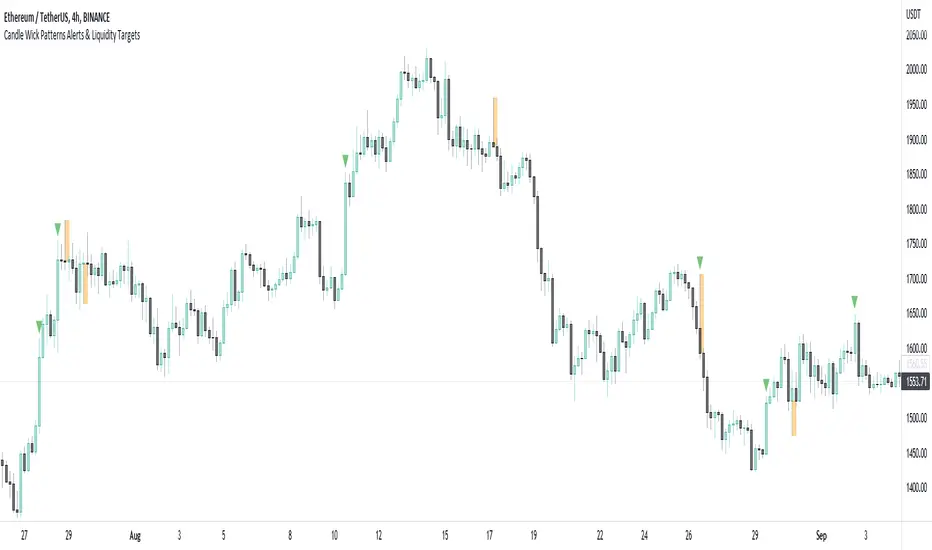
Candle Wick Patterns Alerts & Liquidity TargetsCandle wicks provide incredibly useful confluence and confirmation of price action and technical analysis.
Quite simply a wick is formed by price being moved to an extreme by one side, then price being pushed back by the other side.
This can show increased pressure by one side, reduced or increased momentum, or exhaustion by another side.
This indicator while simple, is extremely powerful and versatile and can be set up to recognize numerous types of candle wick and therefore suit numerous trading styles.
The settings as to how wicks are highlighted are:
- Timeframe - view wicks on a higher timeframe while trading on a lower timeframe
- Minimum Wick to Body Ratio - increasing this value will look for wicks who are at least n times larger than the candle body. The most obvious examples here are Doji's - hammer, gravestone, dragonfly, etc. These can indicate trend reversals, indecision and changing momentum.
- Minimum Candle Body as percent of price - this value makes sure that any wick highlighted, belongs to a candle with a body that is at least n% of the price. A higher value is likely to show price momentum is stronger in a particular direction, good for confirming a trend.
- Minimum Candle Wick as percent of price - similar to candle bodies, this value will make sure the candle wick is at least n% of the price. This will identify large fluctuations in price, and if you are familiar with smart money concepts, an increasingly popular strategy is to target 50% of the wick being filled (liquidity).
- Show half fill level of wick - As above, this can provide a good target, which price will be drawn to, depending on the wick.
Finally, the indicator can be used to create alerts when a new wick that meets your settings criteria, is formed.
And don't forget you can add the indicator multiple times, with different settings to cover multiple scenarios and timeframes!
William Blau Ergodic Tick Volume Indicator (TVI) [Loxx]William Blau Ergodic Tick Volume Indicator (TVI) is a volume/volatility indicator that is used for finding reversals in price movement
What is William Blau Ergodic Tick Volume?
This is one of the techniques described by William Blau in his book "Momentum, Direction and Divergence" (1995). If you like to learn more, we advise you to read this book. His book focuses on three key aspects of trading: momentum, direction and divergence. Blau, who was an electrical engineer before becoming a trader, thoroughly examines the relationship between price and momentum in step-by-step examples. From this grounding, he then looks at the deficiencies in other oscillators and introduces some innovative techniques, including a fresh twist on Stochastics. On directional issues, he analyzes the intricacies of ADX and offers a unique approach to help define trending and non-trending periods.
William Blau's definition of TVI ergodicity is that the indictor is ergodic when periods are set to 32, 5, 1, and the signal is set to 5. Other combinations are not ergodic, according to Blau.
How to use TVI
TVI bar color change is a signal to enter the market. When the TVI changes from yellow to red, it is a signal to buy and if the TVI bar changes from blue to green, it is a signal to sell.
Just like the MACD and TRIX, the zero line on the indicator determines market sentiment and trend. If the TVI bars are above the zero line it's bullish and if the TVI bars are below the zero line the trend is bearish. Zero line crosses can be used to determine continuation and trend entries as well.
Included
Bar coloring
35+ moving averages for both TVI and the signal
Infiten's Price Percentage Oscillator Channel (PPOC Indicator)What is the script used for?
Infiten's Price Percentage Oscillator (PPOC Indicator) can be used as a contrarian indicator for volatile stocks and futures to indicate reversals, areas of support and resistance. For longer term trading, if the Short SMA or prices go above the High PPO Threshold line, it is a sign that the asset is overbought, whereas prices or the Short SMA going below the Low PPO Threshold line indicates that the asset is oversold.
What lines can be plotted?
Low PPO Thresh - Calculated as -PPO Threshold * Short MA + Long MA : Gives the price below which the PPO hits your lower threshold
High PPO Thresh - Calculated as PPO Threshold * Short MA + Long MA : Gives the price above which the PPO hits your upper threshold
MA PPO : Plots candles with the Low PPO Thresh as the low, High PPO Thresh as the high, Short MA as the open, and Long MA as the close.
Short SMA : plots the short simple moving average
Long SMA : plots the long simple moving average
Customizable Values :
Short MA Length : the number of bars back used to calculate the short moving average for a PPO
Long MA Length : the number of bars back used to calculate the long moving average for a PPO
PPO Threshold : the percent difference from the moving average expressed as a decimal (0.5 = 50%)
Recommendations:
Longer timeframes like 300 days are best with larger PPO Thresholds, I recommend using a PPO Threshold of 0.5 or higher. For shorter timeframes like 14 days I recommend setting smaller PPO Thresholds, like 0.3 or lower. I find that these values typically capture the most extremes in price action.
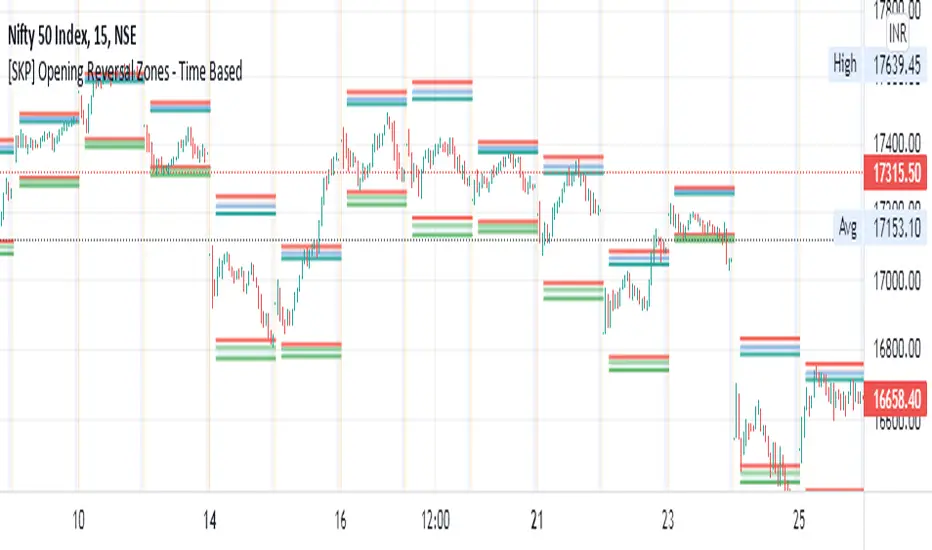
[SKP] Opening Range Reversals with FIBO zonesopening range reversal zones with fibo .50, .618, .786, 1 levels
opening range time can set as you like, 15M, 30M etc
entry at .50 and .618 levels with stop loss .786 and 1 levels.
do backtest and practice..
idea from author colejustice
Random Walk ReversalUses the Random Walk script as a tool for predicting trend reversals instead of trend strength.

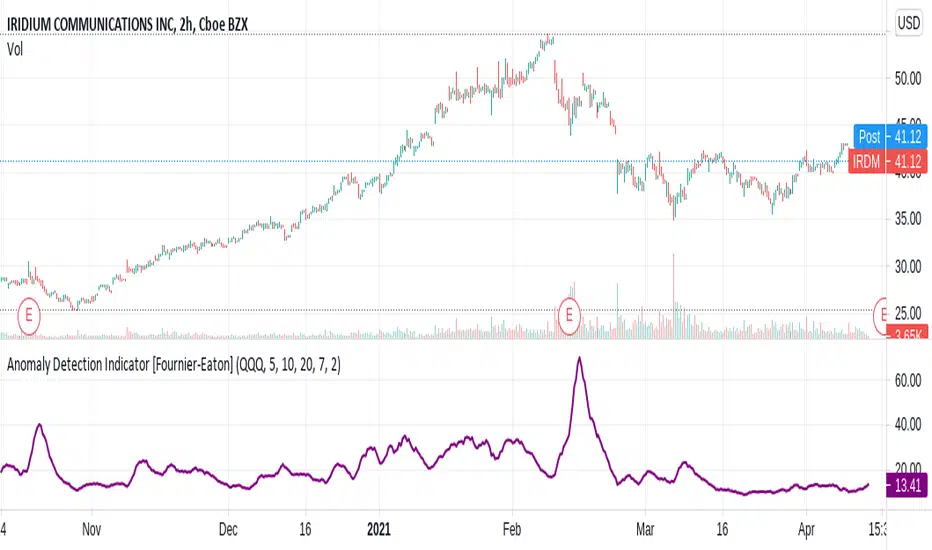
Anomaly Detection Indicator[Fournier-Eaton]Detect unusual activity with this script.
This algorithm should detect significant events RELATIVE to the benchmark of your choice. The default is benchmark is QQQ.
upcoming earnings should be visible
dividend announcements
news events relative to the stock
possible reversals
etc.
The granularity of the algorithm changes with selected time-frame.
This is an early version. Please suggest changes.
V0.1