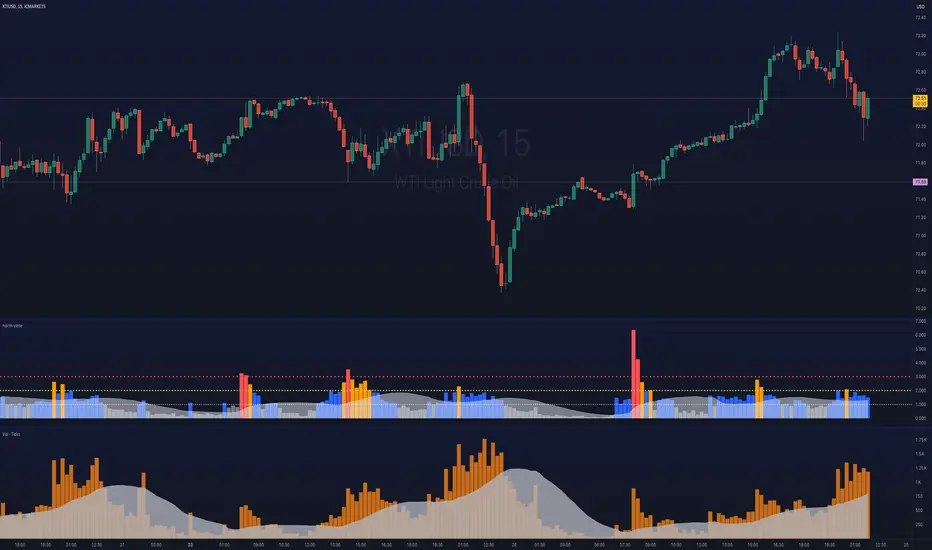
FeraTrading Relative Volume IndicatorThis FeraTrading Relative Volume Indicator measures relative volume pressure by comparing buying and selling activity, smoothed using a configurable average. It helps traders identify volume-driven momentum shifts, offering dynamic buy and sell signals based on weighted pressure values.
Key Features:
📈 Relative Volume (RV) Line: Measures net buying/selling pressure using volume-weighted price action.
🟢 Buy Signals: Triggered when RV crosses above a smoothed moving average (SMA 1).
🔴 Sell Signals (optional): Triggered when RV crosses below a separate SMA (SMA 2).
🔍 Customizable Inputs: Adjust smoothing length, weight, and signal sensitivity.
🕯️ Weighted Candles (optional): Visualizes custom OHLC based on volume-weighted volatility.
📊 Two SMAs: Use separate or combined moving averages to analyze trends in pressure.
🎨 Flexible Styling: Customize line and signal colors to match your chart setup.
Use Cases:
Spotting accumulation/distribution phases
Timing entries during volume surges
Confirming breakout momentum with underlying volume pressure
This indicator was developed by FeraTrading to visualize relative volume pressure.
Buscar en scripts para "relative volume"

MM Relative Volume (RVOL)What this script does:
This script shows you the "Relative Volume" (RVOL) value up to the current minute. RVOL is the volume from market open up to the current minute today, compared to the average of the same over the last n (30 by default) days.
How this script works:
There are a lot of indicators out there for RVOL, but they all take shortcuts that result in sub-par data. This indicator goes the distance to store data for every minute for the last n days for the current chart, then in sums the volume up to the current minute today along with the average of the same up-to-the-minute data from the prior n days to calculate the relative volume of the stock. It's super important to get this data up to the current minute, because most traders use this information primarily during the first 90 minutes of trading, and need to know if this value is going up or down.
How to use this script:
Relative volume can be used to gauge how "In Play" a stock is. If RVOL is less than 1 it is not "In Play" on this trading day and you might not want to trade it. If RVOL is above 2, it is "In Play" and you may want to trade it. When stocks are very "In Play", you can see an RVOL of 5 and above. The higher the RVOL the more "In Play" the stock is. You can also used RVOL for position sizing. If RVOL is <1 you may decide not to take a large position in the name. If RVOL is >3, this may give you more confidence to take a larger position as more reward and more liquidity should be present.
What makes this script original:
This particular implementation of RVOL has never been done before on TradingView to my knowledge. Most other indicators use a rolling average of the prior 30 days which is much easier to do, but this doesn't actually work properly because instead of getting large volume spikes from prior days filtered out correctly, it takes a LOT longer for those to even out as the rolling average eventually smooths down. Instead, with this indicator, any large/small volume days will truly drop off after the moving average length and the calculated average daily volume (ADV) will be accurate up to the minute. For more details on the original concept behind this indicator, check out the blog linked on my profile.

ka66: Normalised/Relative VolumeThis is an idea taken from a John Bollinger (of Bollinger Bands fame) talk. Instead of showing volume with a moving average overlay, we show volume relative to its moving average:
avgVolume = sma(volume, 10) // several configurable MAs allowed
relativeVolume = volume / avgVolume
Now if we get a value of 1, that means the current volume is the same as its historical average. Under 0, less than average, and above zero, greater than its average.
If we get a value like 2, then current volume is twice its average. I hope the implication of this being displayed visually is becoming clearer.
We plot this relative volume as columns.
We then plot horizontal levels, like 1, 2, 3 to see the magnitude of the current volume relative to its average.
Consecutive rising or falling relative volume is shown in the same colour.
I am still exploring volume as trading data point, but we see some ideas from this visual representation:
How do volume patterns change across timeframes? Do we get better signals or higher or lower time frames (e.g. big relative volume spikes)
Can consecutive rises or falls indicate a big potential move, even though price is just fluctuating.
What about a switch from rise to fall.
If we get pinbars/spikes with a big relative volume spike, can we then infer more clearly whether buyers or sellers are in control.
Market Open - Relative VolumeThe indicator calculates the Pre-market volume percentage of the current day, relative to the average volume being traded in the trading session (14 days), displayed in Table Row 1, Table Cell 1, as V%. Pre-market volume between 15% & 30% has a orange background color. Pre-market volume percentage above 30% has a green background color.
The indicator calculates the relative volume per candle relative to the average volume being traded in that time period (14 days) (e.g., "1M," "2M," up to "5M"), displayed in a table. Relative volume between 250% & 350% has a orange background color. Relative volume above 350% has a green background color.
FYI >> Indicator calculations are per candle, not time unit (due to pine script restrictions). Meaning, the indicator current table data is only accurate in the 1M chart. If you are using the indicator in a higher timeframe, e.g., on the 5M chart, then the values in table cells >> (1M value == relative volume of the first 5-minute candle) (5M value = relative volume of the first five 5-minute candles) and so on. (Future versions will have a dynamic table).

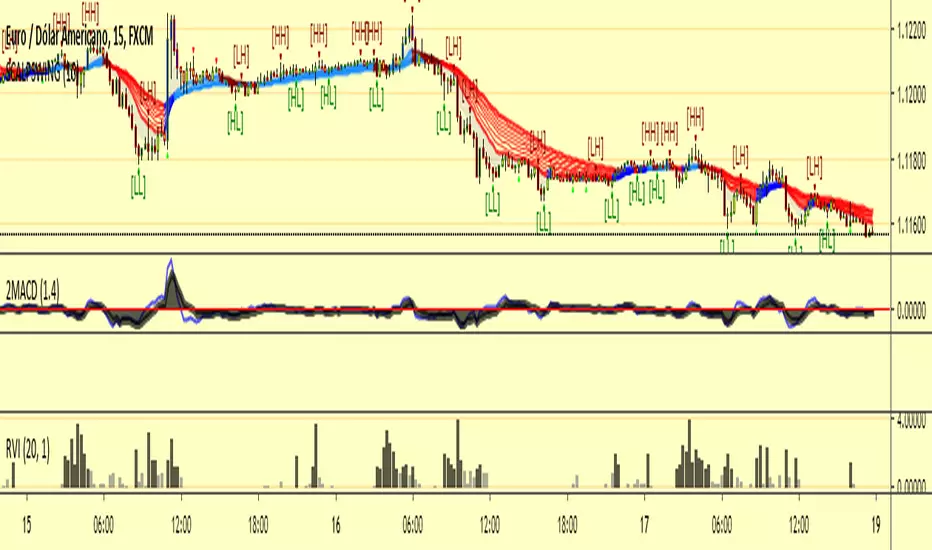
Multi Exchange Relative Volume - FOREXHello traders! This is my first script that I will publish here. This script calculates the relative volume based on the average volume at that time of the day across different brokers.

Volume, Relative Volume HighlightThe indicator plots regular volume bars.
The highlight is given by the current cumulative volume for the day, compared to a custom average (standard 20 periods). The stronger the color, the higher the relative volume is. Stocks moving of higher relative volume have higher chances of making predictable moves.

RVol - Time-based relative volumeImportant to see whether the stock has significantly more activity than usual.
Alternatively you can use TradingView's built-in "Relative Volume At Time" indicator (anchor timeframe: 1 day, length: 10, calculation mode: cumulative, adjust unconfirmed: true), which is essentially the same - without the colorizing of the bars.
More infos: www.reddit.com

Relative Volume Change: BTC | Retail v. Non-Retail [Sim]This script was inspired by Cryptorae's BTC Volume Share, Retail script:
The script plots the relative monthly change of BTC volume, retail vs. non-retail. A move above 1 means the volume of retail or non-retail, respectively, is greater than last month's cumulative volume.

Relative Volume IndicatorA simple indicator showing the relation of volume to highest volume for a define number of bars. Helps to differentiate periods of low and high volume.
Define the number of bars to find the highest volume used as a basis.
Apply a simple moving average to smoothen the volume. Set it to 1 to disable smoothing.
Define a threshold differentiating low and high volume.

Relative Volume Strength Index (MZ RVSI)INTRODUCTION
Volume always plays a role of key indication for price movements and momentum and I always found the same problem with all available volume oscillators and indicators which is that their data is always in compounded form that can’t be easily used in raw form as a parameter in many strategies.
This indicator uses raw volume data from one of following oscillators:
TFS Volume Oscillator
On Balance Volume
Klinger Volume Oscillator
Cumulative Volume Oscillator
Volume Zone Oscillator
Then this data goes through the following process of noise filtration:
Hull Moving Average of input data to reduce noise
Relative Strength Index of HMA
Hull Moving Average of RSI to reduce noise for finalized RVSI
ADDITIONAL FEATURES
Heiken-Ashi: Heiken-Ashi values are optional to use in calculations and I’ve set them to default as I found good results with them.
Slope for Trend Detection: Slope of finalized RVSI is calculated in order to check volume trend direction. Another additional feature of Volume breakouts is also added which is used in dynamic coloring of RVSI. Dynamic color indications are as follows.
Green Color:
Strong Volume Uptrend above volume breakout point
Fuchsia Color:
Weak Volume Uptrend below volume breakout point but slope supported
Red Color:
Strong Volume Downtrend below volume breakout point
Gray Color:
Weak Volume Downtrend above volume breakout point but slope supported
Yellow Color:
Possible trend reversal as slope is flat.
DEFAULTS SETTINGS
Volume length is 30 (Better for timeframes higher than 1H)
Hull Moving Average and RSI length is set to 14
ADDITIONAL APPLICATIONS
This indicator can be used as divergence detection tool for volume same way as RSI is used for price divergence. I’ll soon add divergence signals inside the code and this code can be used in multiple ways as volume breakout indication in strategies for better results.

RVOL - R4RocketRelative volume or RVOL for short is an indicator that is used to measure how 'In Play' the stock is. Simply put, it helps to quantify how interested everybody is in the given stock - higher the value, higher the interest and hence higher is the probability for movement in the stock.
I have tried to create RVOL (Relative Volume ) Indicator as per the description that I read on SMB Capital blog. The blog is a great resource.
...................................................................................................................................................................................
How to use the indicator - The indicator is meant for INTRADAY ONLY.
The indicator has following inputs -
1. RVOL Period - Value from 3 to 14 (Default Value = 4)
This is used to calculate the average volume over the given period of days. e.g. average volume for the last 5 days, last 3 days, last 10 days etc. NOTE - If you use higher RVOL Period on smaller timeframes, the code will give an error. So I recommend using 4 or lower for 5 min timeframe. (Nothing will work on 1 min chart and you can experiment for other timeframes.)
2. RVOL Sectional - True / False (Default Value = False)
If you check this box then you will be able to calculate the RVOL for a particular session (or between particular sessions) in that trading day.
What do I mean by session?
Well I have divided the trading day into 6 (almost) equally spaced sessions in time, i.e. 6 hours and 15 mins (for NSE - India) of trading day is divided into 1 hr - 1st session, 1 hr - 2nd session, 1 hr - 3rd session, 1 hr - 4th session, 1 hr - 5th session, 1 hr and 15 min - 6th session.
Before using 3rd and 4th inputs of indicator, RVOL Sectional box MUST BE CHECKED FIRST.
3. RVOL From Session - 1 to 6 (Default Value = 1)
4. RVOL To Session - 1 to 6 (Default Value = 2)
Now if you select 2 in "RVOL From Session" input and 3 in "RVOL To Session" input, the indicator will calculate RVOL for the 2nd and 3rd hour of the trading day. If you select 3 in both the inputs, then the indicator will give RVOL for the 3rd hour of the trading day.
5. RVOL Trigger - 0.2 to 10 (Default Value = 2)
Filter to find days having RVOL above that value. The indicator turns green (or colour of your choice) when RVOL is more than "RVOL Trigger".
...................................................................................................................................................................................
Hope this indicator will add some value in your trading endeavor.
“Only The Game, Can Teach You The Game” – Jesse Livermore
Yours sincerely,
R4Rocket
**If you have some awesome idea for improvement of the indicator - request you to update the code and share the same.

Relative Volume Strength IndexRVSI is an alternative volume-based indicator that measures the rate of change of average OBV.
How to read a chart using it?
First signal to buy is when you see RVSI is close to green oversold levels.
Once RVSI passes above it's orange EMA, that would be the second alert of accumulation.
Be always cautious when it reaches 50 level as a random statistical correction can be expected because of "market noises".
You know it's a serious uptrend when it reaches above 75 and fluctuates there, grading behind EMA.
The best signal to sell would be a situation where you see RVSI passing below it's EMA when the whole thing is close to Red overbought level
It looks simple, but it's powerful!
I'd use RVSI in combination with price-based indicators.

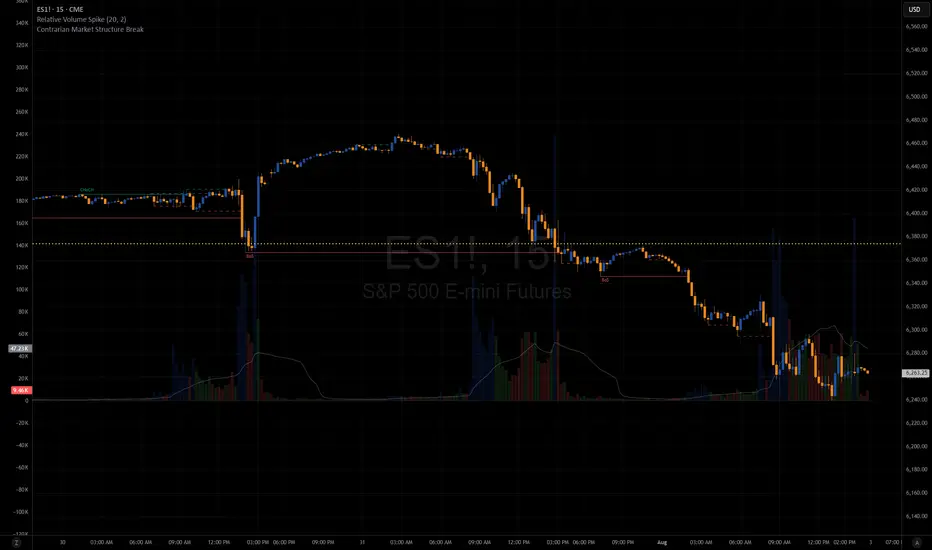
Relative Volume SpikeThis indicator lets you know when a wick has 2x (default value) more volume than the average.
Relative Volume IndicatorGrato ao LazyBear, pela base do indicador, que modifiquei para facilitar o entendimento dos movimentos.
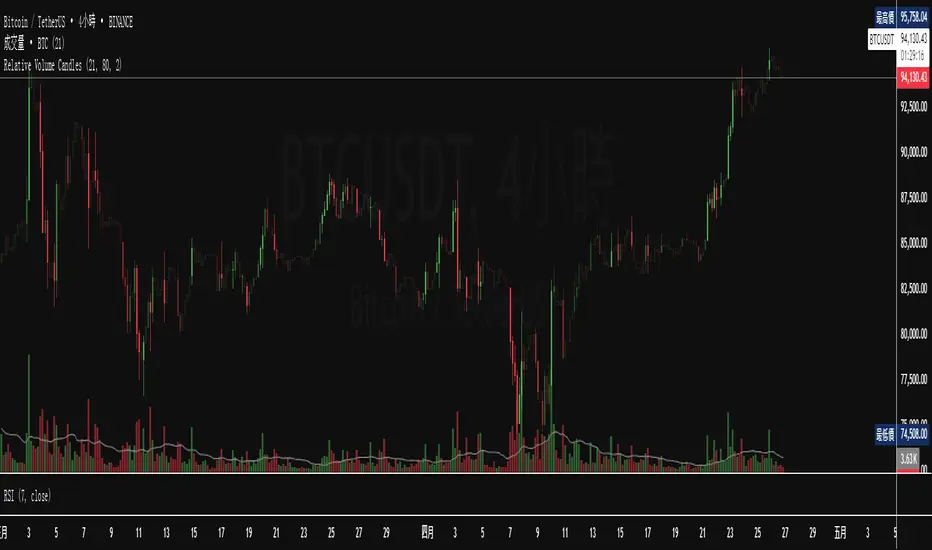
Relative Volume CandlesVisualizes candlesticks with transparency based on volume relative to a moving average. Higher-than-average volume makes candles more opaque, while lower volume increases transparency—helping you spot significant price movements at a glance!
Features:
Customizable up/down candle colors (default: green/red)
Adjustable lookback period for volume averaging (default: 21)
Fine-tune transparency with base transparency (default: 80) and scale (default: 2.0)
Overlay directly on your chart for seamless analysis
Relative Volume Force IndexThis indicator can anticipate the market movements. Its posible because it calculates how much force (volume) it's necessary to move the price up or down. If it's necessary a lot of volume to move the price a little it's a reversion signal, but if a little volume could change the price whit elevate volatility, it's signal of reversion too. The indicator plots red if the market is down, and green if it's up, the size and the color of the bars cand demonstrate the movement relative force. Does it by the configurable averages. Not works well whit poor liquidity.

Relative Volume Strength Index Stepwise FieldRVSI Indicator with multiple stepwise plot lines for deeper trend analysis.

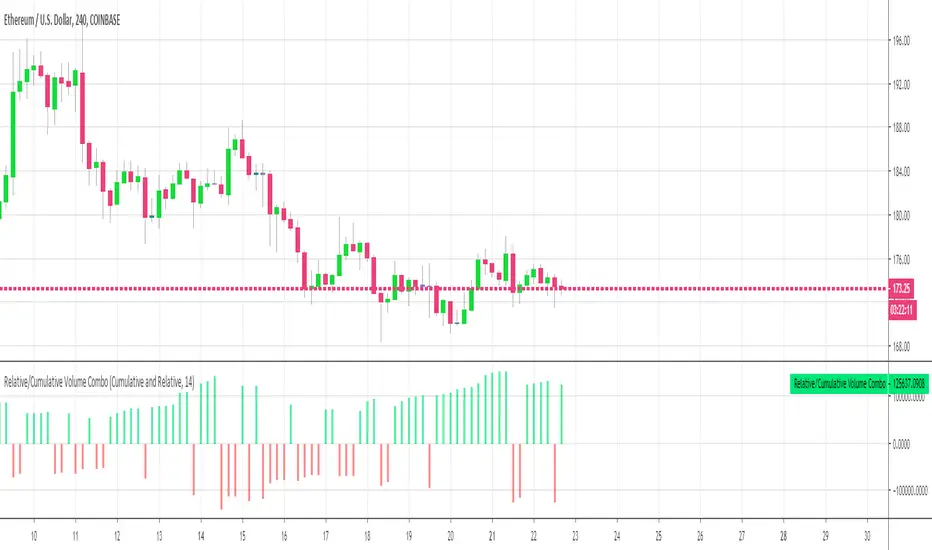
Relative Volume Combined With a Cumulative FunctionHi everyone
The today's script was suggested by a follower.
--------------------------------------
1 minute of Knowledge
--------------------------------------
Many traders look at volume as a pre-signal that a move may happen.
In trading, some say that "the volume precedes the movement".
This simply means that often volume will increase before a significant move in the stock.
Imagine if a unique trader is buying a crypto/stock. The volume is unlikely to move.
But, if all the mass goes to mass spot buy an asset, then we could see a volume spike announcing a potential upwards move.
---------------------------------------------
What's the story with that indicator?
---------------------------------------------
It's an interesting way of presenting the volume data.
Will show the total volume for the selected period.
You can choose between relative and cumulative presentation.
The users can display the consecutive rising volume above the 0 line and the failing volume below that line.
--------------------------------------
Mix knowledge with usefulness
--------------------------------------
A price making a higher/high (HH) or lower/low (LL) has a real and strong meaning- a HH or LL on a volume has a significant meaning also.
Increasing volume for a stock/crypto, could signify that buyers were willing to purchase a bigger number of shares at a higher price (comparatively to the day before)
Obviously, non-stop crazy buying/shorting won't work at some point - and that "some point" may hurt a bit.
Such volume indicator combined with others like momentum or strength indicators is a nice trading strategy.
The volume announces that a move may happen and the other indicators will confirm the prophecy :)
Peace
Dave
RVOL - Final on 814 for 3m Candles ONLYRelative Volume for 3 minute charts ONLY.
Lookback 20 days.
Historical and average values are used to formulate the ratio.
Thank you to R4Rocket for the initial code.
I also researched the RVOL output in Trade Ideas to align the final ratio as close as possible.
The colors change at different levels:
<0.5 ; Red
0.5 > and <=.65 ; Orange
0.65 > and <=1 ; Dark Yellow
1 > and <=1.25 ; Bright Yellow
1.25 < and <=1.5 ; Dark Green
1.5 < and <=2 ; Brighter Green
Above 2 ; Very Bright Green

RVOL Premarket (Screener)Relative Volume indicator which includes pre market data. Can also use it to build a Pre Market high Rel Volume (x5) screener category.

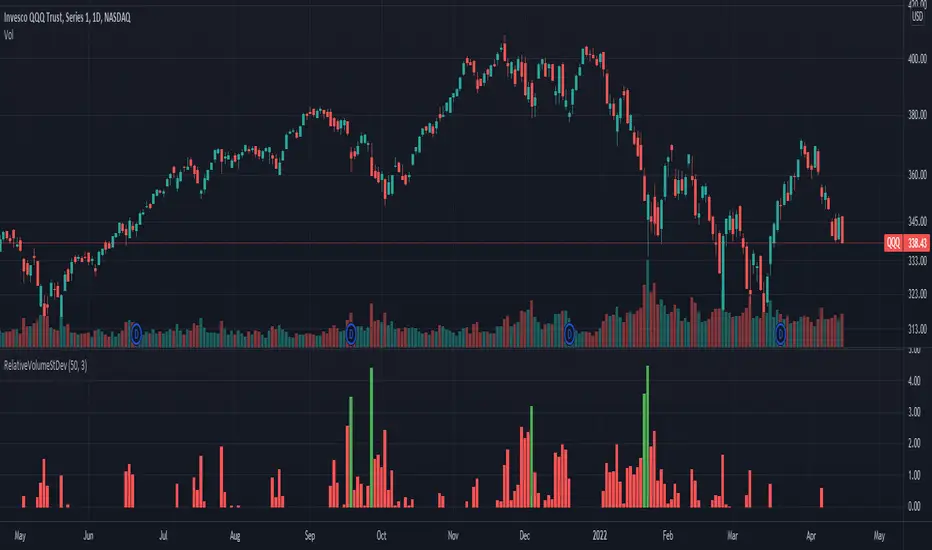
Relative Volume Standard DeviationThis indicator, developed by Melvin E. Dickover, calculates the difference between the volume and its simple moving average, but expressed as a ratio in standard deviations.
The plotted bars become green when the volume is unusually large (configurable).

Relative Volume (RVOL)I have seen a few RVOL scripts floating around out there, but when creating alerts, the parameters have not been labeled clearly that makes it easy to say: "Alert me when RVOL crosses up my Treshold." Look no further than my retooled version that clearly separates the two data series by color and label. Enjoy!
