Adaptive Parabolic SAR (APSAR) - [MYN]We took the code that we wrote in Myth Busting Strategy #6 to make it more profitable, specifically the timeframe adaptive Parabolic SAR logic and published this as a separate indicator to make it easier for others to use and adopt.
There really is no magic to this. This indicator basically just evaluates the timeframe and derives a multiplier that is applied to the PSAR Max attribute.
Buscar en scripts para "psar"

Indicator Direction Table With Bullish & Bearish LabelsINDICATOR DIRECTION TABLE WITH BULLISH AND BEARISH LABELS
This is a table that shows the bullish, bearish or neutral trend for nine different popular indicators. Each indicator label will change color in real time to make you aware of each change in direction. This way you don’t have to read and analyze a bunch of different indicators constantly and you can focus on price action instead.
Look for the entire table to turn green or red before taking positions.
You can also set alerts for when the entire table of indicators is bullish or bearish.
The indicator settings allow customization of indicator lengths & values, table position and turning the indicator table on or off.
The length and other values for each indicator can be customized to suit your preferences, but by default all of them are set to the normal default settings that Tradingview supplies the indicators with. Typically 14 as the length.
The indicators used in this table are as follows:
MACD - Moving Average Convergence Divergence
Stochastic RSI - Stochastic Relative Strength Index
Vortex - Vortex Indicator
Momentum - Momentum Indicator
RSI - Relative Strength Index
PSAR - Parabolic Stop & Reverse
DMI - Directional Movement Index
MFI - Money Flow Index
Fisher - Fisher Transform Price Action
***MARKETS***
This indicator can be used as a signal on all markets, including stocks, crypto, futures and forex.
***TIMEFRAMES***
This indicator table can be used on all timeframes.
***TIPS***
Try using numerous indicators of ours on your chart so you can instantly see the bullish or bearish trend of multiple indicators in real time without having to analyze the data. Some of our favorites are our Auto Fibonacci, Directional Movement Index + Fisher Price Action, Volume Profile With Buy & Sell Pressure, Auto Support And Resistance and Money Flow Index in combination with this indicator direction table. They all have unique features to help you make better and faster trading decisions.

[PX] MTF OverviewHello everyone,
the new table-functions came out, so I wanted to give it a try. With this indicator you can get an overview for your chart by looking at multiple timeframes and different type of indicators for each timeframe.
How does it work?
The indicator uses 3 different timeframes, which you can select in the settings-tab. For each timeframe it will look at the following indicators:
- Volume for the Volume column
- Relative Strength Index (RSI) for the Momentum column
- Average True Range (ATR) for the Volatility column
- Parabolic SAR (PSAR) for the Trend column
Increasing values will be shown in green, decreasing values in red. For the trend it prints a nice little symbol. I'm planning to add more indicators for each indicator category, so that you can choose, which indicators you want to use.
Hope that might be useful to some of you :)
Please click the "Like"-button and follow me for future open-source script publications.
If you are looking for help with your custom PineScript development, don't hesitate to contact me directly here on Tradingview or through the link in my signature :)

Parabolic SAR with Volatility Filter: Buy Alerts for 3commasHey folks and fellow 3commas users !
Here is a new signal generator for your DCA bot on 3commas.
This is a classic Parabolic SAR indicator with a filter for volatility.
NOTE: This is a repainting strategy by design. Recommended to use with "Once per bar" alert style for PSAR

TKP T3 Trend With Psar BarcolorThis script is adapted from TKP's long/short indicator to initiate buy/sell indications when price crosses the T3 moving averages, and when the T3's themselves cross. Bars change colors based on price over/under T3 and T3 up or down or This allows for simple visual analysis of trend direction along with entries, exits, and stop loss values.

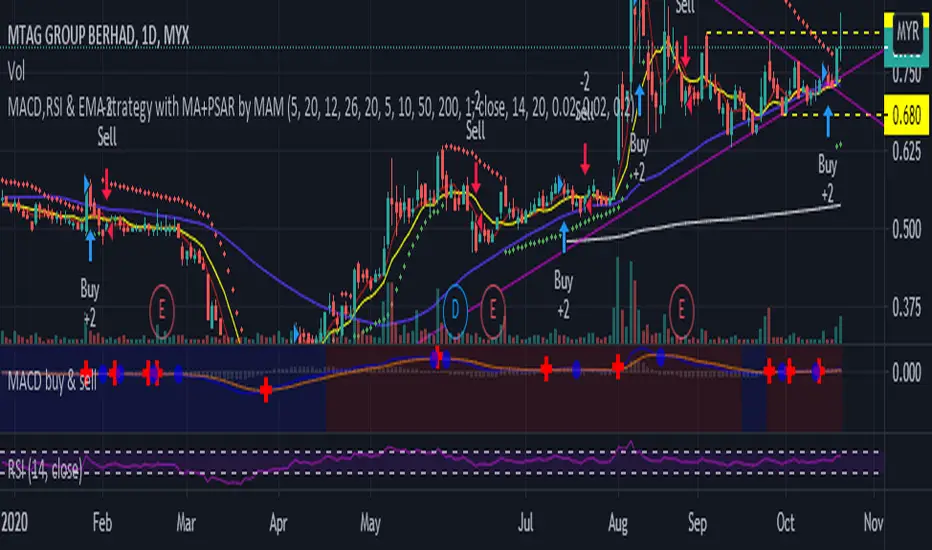
MACD,RSI & EMA strategy with MA+PSAR by MAMMACD,RSI & EMA strategy with MA+PSAR
Buy strategy
- MACD above signal
- RSI above RSI signal
- Close price above EMA
Sell Strategy
- MACD below signal
- RSI below RSI signal
- Close price below EMA
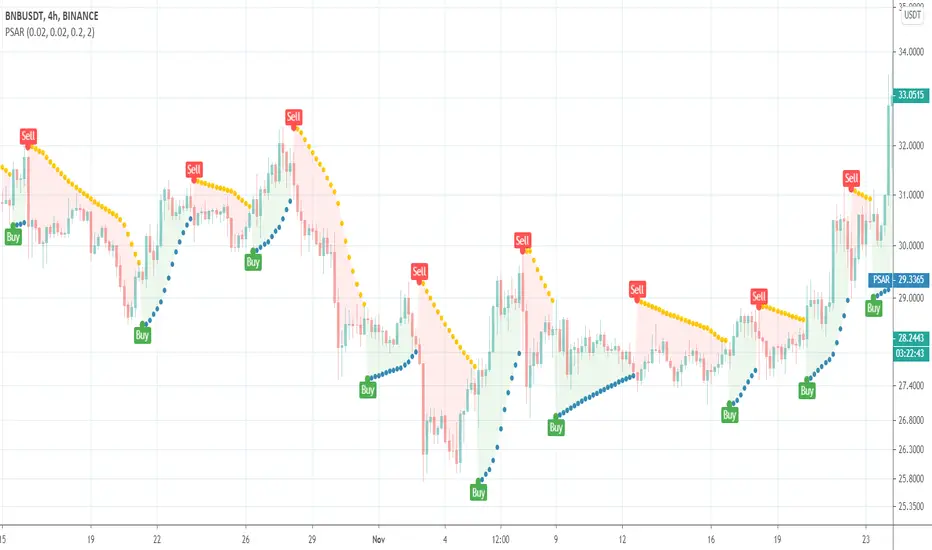
Simple and efficient PSAR swing strategyThis is a strategy build inside tradingview, which I found it works great with swing/position trading.
It works based on parabolic sar indicator, when indicator is below the candle, is an uptrend and when its its above is a downtrend.
At the same time it's very nice, because it has a sort of stop loss which is dynamic, because it triggers when candle crosses with indicator, so you dont have to worry about stop loss or take profit .
The key here of course, is going to be the risk management, if you want to success with it, never trade more than 2% of you capital, and if you want you can always apply a rule inside the code to close all position if x % amount of equity was going down, although I recommend have patience and let the system do its job.
I recommend this strategy to be used with charts like 1 day or 1 week. If you need and want I can convert it to an indicator that uses alerts (although with strategy as well can be made to send alerts).
PS. When you add this strategy on chart, inside is has different versions, if you use first version(1), it uses the system I explain above. If you use the last one, its based on risk management when the stop loss is the difference between psar and the candle, but it still needs some adjustments to make.
Overall first one is atm much more profitable, but I believe that the version with risk management can be much better, but it need much more adjustments to make which I dont have the time at the moment for it.
Enjoy it .


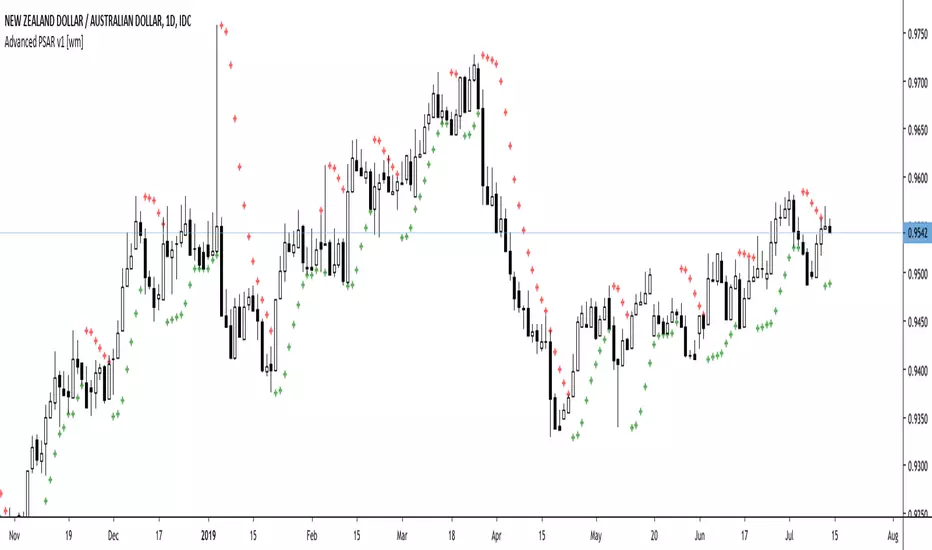
Advanced PSAR v1 [wm]A port off Dennis Meyers Advance PSAR outlined in Stocks and Commodities V13:4
The shape, slope and speed of the SAR is controlled by three parameters: the starting acceleration factor (AF), the increment that the AF can change when a new price high or low is made, and the maximum AF. Because of the way the SAR is calculated, the shape of the SAR curve resembles a parabola - hence its name.
Most software packages only allow the user to vary the AF increment and the AF maximum, fixing the starting AF at 0.02. This restriction hampers the trend-following abilities of the parabolic.
Frequently as the SAR hugs the price curve, it is penetrated by a price bar by a minuscule amount, causing the SAR to generate an opposite signal. The price then immediately turns around and resumes going in the direction it was going before this penetration occurred, causing a costly whipsaw loss.
Many of the whipsaw losses are caused by noise or randomness in the price series. Thus, if the SAR is to represent the trend of a real price series, it must have the capability to ignore penetrations of noise level amounts. To this end, I have modified the parabolic SAR formula to include a variable that allows the SAR not to reverse unless penetrated by a defined amount. This new parameter is defined as ‘XO Increment’ for crossover increment
This version is configured for pips. If using on other assets with much larger values should be used. Also note the starting values have not been optimised. Should users of this script find good values please comment and share with the community if you could
Parabolic SARThis is a redesign of the built-in Parabolic SAR indicator. I added a proper input system, an option to highlight initial points for both lines and an option to choose points width. So, customize it as you want.
Parabolic SAR was originally developed by J. Welles Wilder and described in his book "New Concepts in Technical Trading Systems" (1978). It is a trend-following indicator that can be used as a trailing stop loss.
To know which settings for PSAR are the most profitable on your instrument and timeframe you can use this tool
Profitable Parabolic SAR
PSAR xthis is hybrid of SAR and linear regression calculated by the same way we do super trend
the trend is controlled by the len, sar value and deviation
alerts and signals included
it just idea how to use SAR in different way .

Combined EMA Technical AnalysisThis script is written in Pine Script (version 5) for TradingView and creates a comprehensive technical analysis indicator called "Combined EMA Technical Analysis." It overlays multiple technical indicators on a price chart, including Exponential Moving Averages (EMAs), VWAP, MACD, PSAR, RSI, Bollinger Bands, ADX, and external data from the S&P 500 (SPX) and VIX indices. The script also provides visual cues through colors, shapes, and a customizable table to help traders interpret market conditions.
Here’s a breakdown of the script:
---
### **1. Purpose**
- The script combines several popular technical indicators to analyze price trends, momentum, volatility, and market sentiment.
- It uses color coding (green for bullish, red for bearish, gray/white for neutral) and a table to display key information.
---
### **2. Custom Colors**
- Defines custom RGB colors for bullish (`customGreen`), bearish (`customRed`), and neutral (`neutralGray`) signals to enhance visual clarity.
---
### **3. User Inputs**
- **EMA Colors**: Users can customize the colors of five EMAs (8, 20, 9, 21, 50 periods).
- **MACD Settings**: Adjustable short length (12), long length (26), and signal length (9).
- **RSI Settings**: Adjustable length (14).
- **Bollinger Bands Settings**: Length (20), multiplier (2), and proximity threshold (0.1% of band width).
- **ADX Settings**: Adjustable length (14).
- **Table Settings**: Position (e.g., "Bottom Right") and text size (e.g., "Small").
---
### **4. Indicator Calculations**
#### **Exponential Moving Averages (EMAs)**
- Calculates five EMAs: 8, 20, 9, 21, and 50 periods based on the closing price.
- Used to identify short-term and long-term trends.
#### **Volume Weighted Average Price (VWAP)**
- Resets daily and calculates the average price weighted by volume.
- Color-coded: green if price > VWAP (bullish), red if price < VWAP (bearish), white if neutral.
#### **MACD (Moving Average Convergence Divergence)**
- Uses short (12) and long (26) EMAs to compute the MACD line, with a 9-period signal line.
- Displays "Bullish" (green) if MACD > signal, "Bearish" (red) if MACD < signal.
#### **Parabolic SAR (PSAR)**
- Calculated with acceleration factors (start: 0.02, increment: 0.02, max: 0.2).
- Indicates trend direction: green if price > PSAR (bullish), red if price < PSAR (bearish).
#### **Relative Strength Index (RSI)**
- Measures momentum over 14 periods.
- Highlighted in green if > 70 (overbought), red if < 30 (oversold), white otherwise.
#### **Bollinger Bands (BB)**
- Uses a 20-period SMA with a 2-standard-deviation multiplier.
- Color-coded based on price position:
- Green: Above upper band or close to it.
- Red: Below lower band or close to it.
- Gray: Neutral (within bands).
#### **Average Directional Index (ADX)**
- Manually calculates ADX to measure trend strength:
- Strong trend: ADX > 25.
- Very strong trend: ADX > 50.
- Direction: Bullish if +DI > -DI, bearish if -DI > +DI.
#### **EMA Crosses**
- Detects bullish (crossover) and bearish (crossunder) events for:
- EMA 9 vs. EMA 21.
- EMA 8 vs. EMA 20.
- Visualized with green (bullish) or red (bearish) circles.
#### **SPX and VIX Data**
- Fetches daily closing prices for the S&P 500 (SPX) and VIX (volatility index).
- SPX trend: Bullish if EMA 9 > EMA 21, bearish if EMA 9 < EMA 21.
- VIX levels: High (> 25, fear), Low (< 15, stability).
- VIX color: Green if SPX bullish and VIX low, red if SPX bearish and VIX high, white otherwise.
---
### **5. Visual Outputs**
#### **Plots**
- EMAs, VWAP, and PSAR are plotted on the chart with their respective colors.
- EMA crosses are marked with circles (green for bullish, red for bearish).
#### **Table**
- Displays a summary of indicators in a customizable position and size.
- Indicators shown (if enabled):
- EMA 8/20, 9/21, 50: Green dot if bullish, red if bearish.
- VWAP: Green if price > VWAP, red if price < VWAP.
- MACD: Green if bullish, red if bearish.
- MACD Zero: Green if MACD > 0, red if MACD < 0.
- PSAR: Green if price > PSAR, red if price < PSAR.
- ADX: Arrows for very strong trends (↑/↓), dots for weaker trends, colored by direction.
- Bollinger Bands: Arrows (↑/↓) or dots based on price position.
- RSI: Numeric value, colored by overbought/oversold levels.
- VIX: Numeric value, colored based on SPX trend and VIX level.
---
### **6. Alerts**
- Triggers alerts for EMA 8/20 crosses:
- Bullish: "EMA 8/20 Bullish Cross on Candle Close!"
- Bearish: "EMA 8/20 Bearish Cross on Candle Close!"
---
### **7. Key Features**
- **Flexibility**: Users can toggle indicators on/off in the table and adjust parameters.
- **Visual Clarity**: Consistent use of green (bullish), red (bearish), and neutral colors.
- **Comprehensive**: Combines trend, momentum, volatility, and market sentiment indicators.
---
### **How to Use**
1. Add the script to TradingView.
2. Customize inputs (colors, lengths, table position) as needed.
3. Interpret the chart and table:
- Green signals suggest bullish conditions.
- Red signals suggest bearish conditions.
- Neutral signals indicate indecision or consolidation.
4. Set up alerts for EMA crosses to catch trend changes.
This script is ideal for traders who want a multi-indicator dashboard to monitor price action and market conditions efficiently.

Options Series - NonOverlay_Technical
⭐ 1. Purpose:
The script is designed to show technical indicators in a non-overlay form using candlestick representations. It combines multiple popular technical analysis tools to gauge the market's bullish or bearish conditions.
⭐ 2. Indicators:
The script uses several indicators across different timeframes: Exponential Moving Averages (EMA) for 5, 20, 50 periods. Simple Moving Average (SMA) for 200 periods. RSI (Relative Strength Index) for momentum. VWAP (Volume Weighted Average Price) for average price evaluation. PSAR (Parabolic SAR) for trend direction. Daily and multi-day (2-day and 3-day) data for broader market context.
⭐ 3. Candlestick Representation:
The script uses color-coded candlesticks to visually represent various indicators and their bullish/bearish states: Green candlesticks for bullish conditions. Red candlesticks for bearish conditions. Neutral/transparent for non-significant conditions.
⭐ 4. Important Conditions:
It calculates bullish and bearish conditions for each indicator: MA20: When the price is above or below the 20-period EMA. RSI: When RSI is above or below 50. VWAP: When the price is above or below the VWAP. PSAR: When the price is above or below the PSAR. 2-day and 3-day Moving Averages: Evaluating the broader trend.
⭐ 5. Bullish vs. Bearish Calculation:
The script sums up bullish and bearish signals to determine the overall market condition: Current_logical_bull: Counts the number of bullish indicators. Current_logical_bear: Counts the number of bearish indicators. The script compares these values to conclude whether the market is more bullish or bearish.
⭐ 6. Visual Plotting:
The script uses plotcandle to display the non-overlay signals at different levels for each condition, stacked vertically from MA20 to PSAR. Additionally, a master candle combines all indicators to show an overall market trend.
⭐ 7. Neon Effect on MA20:
It adds a neon-like effect to the MA20 line, making it visually prominent: A standard plot line with the base color. Two additional neon layers with increasing transparency to enhance the effect.
⭐ 8. Daily Timeframes and Lookahead:
The script fetches daily data using the lookahead feature to get a broader view of the market trend. It tracks the previous day’s and two days' data for comparison.
⭐ 9. Labels and Customization:
The script dynamically adds labels to the chart for the different plotted indicators at the last bar, making it easier to identify which indicator is being represented.
🚀 Conclusion:
The script combines multiple technical indicators, such as EMA, RSI, VWAP, PSAR, and multi-day moving averages, to visually assess bullish and bearish market conditions. It uses color-coded candlesticks to represent each indicator and sums up the signals to determine the overall trend.

RY-Parabolic Stop and ReverseParabolic Stop and Reverse with Support Resistance (PSAR-SR)
Identify dynamic support and resistance levels based on price movements.
Reduce false signals often generated by the regular PSAR.
Provide more accurate trading decisions by considering previous reversal points as support and resistance.
How Does PSAR-SR Work?
PSAR Reversal Points:
When the regular PSAR generates a reversal signal, the price at that reversal point is used as support (in an uptrend) or resistance (in a downtrend).
Support and Resistance Lines:
Support: A line drawn from the previous PSAR reversal point in an uptrend.
Resistance: A line drawn from the previous PSAR reversal point in a downtrend.
Price often moves sideways between these support and resistance levels before a breakout occurs.
Breakout Above/Below Support and Resistance:
A Buy signal is generated when the price breaks above resistance with a new candle closing above it.
A Sell signal is generated when the price breaks below support with a new candle closing below it.
Strategy Using PSAR-SR
Wait for the Breakout:
Avoid buying or selling immediately when the PSAR gives a signal.
Confirm that the price breaks past the support or resistance levels and forms a new candle outside those lines.
Use Alongside Other Indicators:
PSAR-SR is not recommended as a standalone tool. Use additional confirmation indicators such as:
Moving Average: To identify long-term trends.
RSI or MACD: To confirm momentum or overbought/oversold conditions.
Advantages of PSAR-SR
Reduces False Signals:
By focusing on previous support and resistance levels, PSAR-SR avoids invalid signals.
Helps Identify Breakouts:
It provides better insight for traders to enter the market during valid breakouts.
Limitations of PSAR-SR
Not Suitable for Sideways Markets:
If the price moves sideways for an extended period, the signals may become less effective.
Requires Additional Confirmation:
Should be used in combination with other indicators to improve accuracy.
Conclusion
PSAR-SR is a helpful tool for identifying dynamic support and resistance levels and generating buy/sell signals based on price breakouts. However, it should always be used with additional indicators for confirmation to avoid false trades.
Disclaimer:
Use this indicator at your own risk, and always perform additional analysis before making any trading decisions.
If you'd like further clarification or examples of how to apply this to a chart, feel free to ask! 😊

Octopus Nest Strategy Hello Fellas,
Hereby, I come up with a popular strategy from YouTube called Octopus Nest Strategy. It is a no repaint, lower timeframe scalping strategy utilizing PSAR, EMA and TTM Squeeze.
The strategy considers these market factors:
PSAR -> Trend
EMA -> Trend
TTM Squeeze -> Momentum and Volatility by incorporating Bollinger Bands and Keltner Channels
Note: As you can see there is a potential improvement by incorporating volume.
What's Different Compared To The Original Strategy?
I added an option which allows users to use the Adaptive PSAR of @loxx, which will hopefully improve results sometimes.
Signals
Enter Long -> source above EMA 100, source crosses above PSAR and TTM Squeeze crosses above 0
Enter Short -> source below EMA 100, source crosses below PSAR and TTM Squeeze crosses below 0
Exit Long and Exit Short are triggered from the risk management. Thus, it will just exit on SL or TP.
Risk Management
"High Low Stop Loss" and "Automatic High Low Take Profit" are used here.
High Low Stop Loss: Utilizes the last high for short and the last low for long to calculate the stop loss level. The last high or low gets multiplied by the user-defined multiplicator and if no recent high or low was found it uses the backup multiplier.
Automatic High Low Take Profit: Utilizes the current stop loss level of "High Low Stop Loss" and gets calculated by the user-defined risk ratio.
Now, follows the bunch of knowledge for the more inexperienced readers.
PSAR: Parabolic Stop And Reverse; Developed by J. Welles Wilders and a classic trend reversal indicator.
The indicator works most effectively in trending markets where large price moves allow traders to capture significant gains. When a security’s price is range-bound, the indicator will constantly be reversing, resulting in multiple low-profit or losing trades.
TTM Squeeze: TTM Squeeze is a volatility and momentum indicator introduced by John Carter of Trade the Markets (now Simpler Trading), which capitalizes on the tendency for price to break out strongly after consolidating in a tight trading range.
The volatility component of the TTM Squeeze indicator measures price compression using Bollinger Bands and Keltner Channels. If the Bollinger Bands are completely enclosed within the Keltner Channels, that indicates a period of very low volatility. This state is known as the squeeze. When the Bollinger Bands expand and move back outside of the Keltner Channel, the squeeze is said to have “fired”: volatility increases and prices are likely to break out of that tight trading range in one direction or the other. The on/off state of the squeeze is shown with small dots on the zero line of the indicator: red dots indicate the squeeze is on, and green dots indicate the squeeze is off.
EMA: Exponential Moving Average; Like a simple moving average, but with exponential weighting of the input data.
Don't forget to check out the settings and keep it up.
Best regards,
simwai
---
Credits to:
@loxx
@Bjorgum
@Greeny

Candle Color GeneratorCandle Color Generator:
This indicator is designed to highlight the candle colors based on the combinations of Parabolic SAR (PSAR) and 2 Hull Moving Averages (HMA).
Colors:
Yellow, Red, and Green colors are used to describe the candle colors depends on its position to PSAR and 2 HMAs.
PSAR:
PSAR position above or below candle position is differentiated by Red and Green colors
HMAs:
As default settings 20 HMA is considered as lower period and 50 HMA is considered period for the calculation
Trade What You See:
This indicator will help to see how the setup of particular instrument coming up. Users/Traders can use and trade based on what they see and interpret from it.
Disclaimer:
Idea of publishing this script is to identify the strength of the instrument using multiple confirmation.
Using this indicator, changing inputs (show/hide/change period), and trading decisions are up to the users/traders.
Courtesy:
Thanks to inventors of HMA (Alan Hull), PSAR(Welles Wilder) as these inputs are used to make some calculations

Multiple Symbol Trend Screener [Pineify]Multiple Symbol Trend Screener Pineify – Ultimate Multi-Indicator Scanner for TradingView
Empower your trading with deep market insights across multiple symbols using this feature-rich Pine Script screener. The Multiple Symbol Trend Screener Pineify enables traders to monitor and compare trends, reversals, and consolidations in real-time across the biggest equity symbols on TradingView, through a synergistic blend of popular technical indicators.
Key Features
Monitor up to 15 symbols and their trends simultaneously
Integrates 7 professional-grade indicators: MA Distance, Aroon, Parabolic SAR (PSAR), ADX, Supertrend, Keltner Channel, and BBTrend
Color-coded table display for instant visual assessment
Customizable lookback periods, indicator types, and calculation methods
SEO optimized for multi-symbol trend detection, screener, and advanced TradingView indicator
How It Works
This indicator leverages TradingView’s Pine Script v6 and request.security() to process multiple symbols across selected timeframes. Data populates a dynamic table, updating each cell based on the calculated value of every underlying indicator. MA Distance highlights deviation from moving averages; Aroon flags emerging trend strength; PSAR marks potential trend reversals; ADX assesses trend momentum; Supertrend detects bullish/bearish phases; Keltner Channel and BBTrend offer volatility and power insights.
Set up your preferred symbols and timeframes
Each indicator runs its calculation per symbol using its parameter group
All results are displayed in a table for a comprehensive dashboard view
Trading Ideas and Insights
Traders can use this screener for cross-market comparison, directional bias, entry/exit filtering, and comprehensive trend evaluation. The screener is excellent for swing trading, day trading, and portfolio tracking. It enables confirmation across multiple frameworks — for example, spotting momentum with ADX before confirming direction with Supertrend and PSAR.
Identify correlated movements or divergences across selected assets
Spot synchronized trend changes for basket trading ideas
Filter symbols by volatility, strength, or trend status for precise trade selection
How Multiple Indicators Work Together
The screener’s edge lies in its intelligent correlation of popular indicators. MA Distance measures the proximity to chosen moving averages, ideal for spotting overbought/oversold conditions. Aroon reveals the strength of new price trends, PSAR indicates reversal signals, and ADX quantifies the momentum of these trends. Supertrend provides a directional phase, while Keltner Channel & BBTrend analyze volatility shifts and band compressions. This amalgamation allows for a robust, multi-dimensional market snapshot, capturing details missed by single-indicator tools.
By displaying all key metrics side-by-side, the screener enables holistic decision-making, revealing confluence zones and contradiction areas across multiple tickers and timeframes.
Unique Aspects
Original implementation combining seven independent trend and momentum indicators for each symbol
Rich customization for symbols, timeframes, and all indicator parameters
Intuitive color-coding for quick reading of bullish/bearish/neutral signals
Comprehensive dashboard for instant actionable insights
How to Use
Load the indicator onto your TradingView chart
Go to the script’s settings and input your preferred symbols and relevant timeframes
Set your desired parameters for each indicator group: Moving Average type, Aroon length, PSAR values, ADX smoothing, etc.
Observe the results in the top-right table, then use it to filter candidates and validate trade setups
The screener is suitable for all timeframes and asset classes available on TradingView. Make sure your chart’s timeframe matches the one used in the scanner for optimal accuracy.
Customization
Choose up to 15 symbols to monitor in a single dashboard
Customize lookback periods, indicator types, colors, and display settings
Configure alerting options and thresholds for advanced trade automation
Conclusion
The Multiple Symbol Trend Screener Pineify sets a new standard for multi-asset screening on TradingView. By elegantly merging seven proven technical indicators, the screener delivers powerful trend detection, reversal analysis, and volatility monitoring — all in one dashboard. Take your trading to new heights with in-depth, customizable market surveillance.

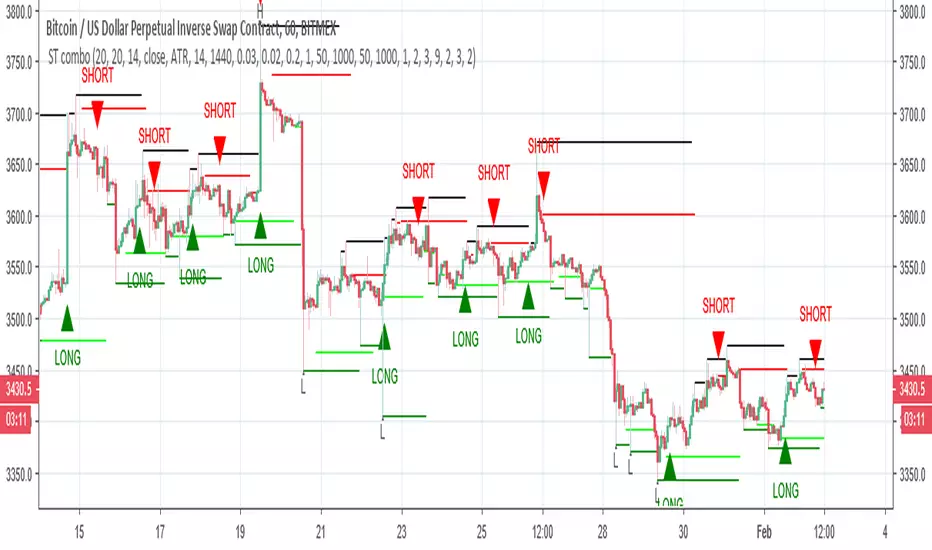
ST comboThis model try to combine super trend with Psars and pivots high and lows
the buy is buy the super trend , the sell is either pivots high points, Psar or supertrend
there is another option for buy and sell by Psar and pivots (buy again or sell again)
both have stop loss and take profit
The Psar is calculated different from regular Psar but it will give the signals the same
Trade_WhatYouSee_byCKTrade What You See:
This script/indicator is designed with the main purpose of identifying the strength of the instrument. Description added at each methods. Inputs can be changed by users as per their own rules as per their matching style. Happy Trading!
PSAR:
Default PSAR setting is used with the marking of red and green as per position of above or below candle. This will help to identify the current strength
ATR:
ATR based calculation used to identify ATR strength and its zone. This will help to double confirm the strength
2 EMA:
There are 2 EMAs are used here to see the crossover and the strength of the candle.
Disclaimer:
Combination of these multiple strength identification may help the users/traders to see the strength of the instrument. That is the main and sole purpose of publishing this indicator. Changing the inputs, taking trading decisions are up to each individual users/traders.
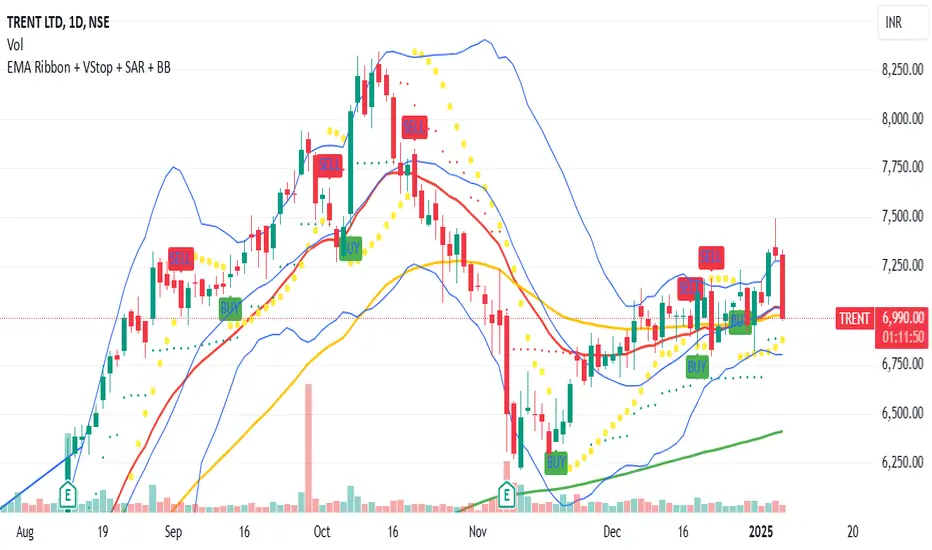
Aura Vibes EMA Ribbon + VStop + SAR + Bollinger BandsThe combination of Exponential Moving Averages (EMA), Volatility Stop (VStop), Parabolic SAR (PSAR), and Bollinger Bands (BB) offers a comprehensive approach to technical analysis, each serving a distinct purpose:
Exponential Moving Averages (EMA): EMAs are used to identify the direction of the trend by smoothing price data. Shorter-period EMAs react more quickly to price changes, while longer-period EMAs provide a broader view of the trend.
Volatility Stop (VStop): VStop is a dynamic stop-loss mechanism that adjusts based on market volatility, typically using the Average True Range (ATR). This allows traders to set stop-loss levels that accommodate market fluctuations, potentially reducing the likelihood of premature stop-outs.
Parabolic SAR (PSAR): PSAR is a trend-following indicator that provides potential entry and exit points by plotting dots above or below the price chart. When the dots are below the price, it suggests an uptrend; when above, a downtrend.
Bollinger Bands (BB): BB consists of a middle band (typically a 20-period simple moving average) and two outer bands set at standard deviations above and below the middle band. These bands expand and contract based on market volatility, helping traders identify overbought or oversold conditions.
Integrating these indicators can enhance trading strategies:
Trend Identification: Use EMAs to determine the prevailing market trend. For instance, a short-term EMA crossing above a long-term EMA may signal an uptrend.
Entry and Exit Points: Combine PSAR and BB to pinpoint potential entry and exit points. For example, a PSAR dot appearing below the price during an uptrend, coinciding with the price touching the lower Bollinger Band, might indicate a buying opportunity.
Risk Management: Implement VStop to set adaptive stop-loss levels that adjust with market volatility, providing a buffer against market noise.
By thoughtfully combining these indicators, traders can develop a robust trading system that adapts to various market conditions.
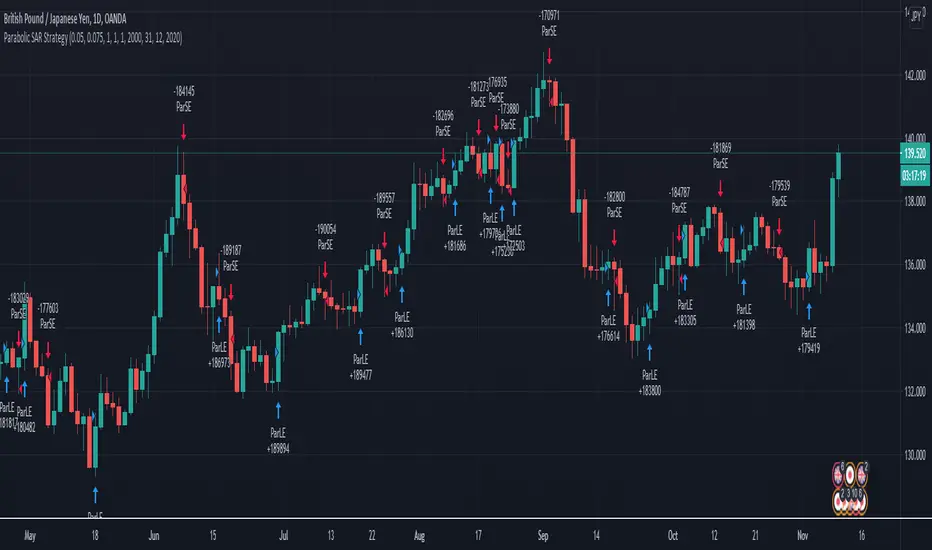
Parabolic SAR Swing strategy GBP JPY Daily timeframeToday I bring you a new strategy thats made of parabolic sar. It has optmized values for GBPJPY Daily timeframe chart.
It also has a time period selection, in order to see how it behave between selected years.
The strategy behind it is simple :
We have an uptrend , (the psar is below our candles) we go long. We exit when our candle crosses the psar value.
The same applies for downtrend(the psar is above our candles), where we go short. We exit when our candle cross the psar value.
Among the basic indicators, it looks like PSAR is one of the best canditates for swing trading.
If you have any questions, please let me know.
mForex - 3 Moving Average - Parabolic SARScript identifies the uptrend and downtrend according to the average price of the MA and PSAR lines.
Rules of sale:
- Open short positions when:
MA12 cuts MA26 and MA52 from the top.
PSAR dots on the price line
- Stop loss:
At the dots of PSAR and use Trailing Stop facing up
On the nearest peak
- Profit-taking: Corresponding ratio of R: R (1: 2)
- Open long positions when:
MA12 cuts MA26 and MA52 from the bottom.
PSAR dots below the price line
- Stop loss:
At the dots of PSAR and use Trailing Stop facing down
Below the nearest peak
- Profit-taking: Corresponding ratio of R: R (1: 2)
