Hourly Volatility Explorer📊 Hourly Volatility Explorer: Master The Market's Pulse
Unlock the hidden rhythms of price action with this sophisticated volatility analysis tool. The Hourly Volatility Explorer reveals the most potent trading hours across multiple time zones, giving you a strategic edge in timing your trades.
🌟 Key Features:
⏰ Multi-Timezone Analysis
• GMT (UTC+0)
• EST (UTC-5) - New York
• BST (UTC+1) - London
• JST (UTC+9) - Tokyo
• AEST (UTC+10) - Sydney
Perfect for tracking major market sessions and their overlaps!
📈 Dynamic Visualization
• Color-gradient hourly bars for instant pattern recognition
• Real-time volatility comparison
• Interactive data table with comprehensive statistics
• Automatic highlighting of peak volatility periods
🎯 Strategic Applications:
Day Trading:
• Identify optimal trading windows
• Avoid low-liquidity periods
• Capitalize on session overlaps
• Fine-tune entry/exit timing
Risk Management:
• Set appropriate stop losses based on hourly volatility
• Adjust position sizes for different market hours
• Optimize risk-reward ratios
• Plan around high-impact hours
Global Market Analysis:
• Track volatility across all major sessions
• Spot institutional trading patterns
• Identify quiet vs. active periods
• Monitor 24/7 market dynamics
💡 Perfect For:
• Forex traders navigating global sessions
• Crypto traders in 24/7 markets
• Day traders optimizing execution times
• Algorithmic traders fine-tuning strategies
• Risk managers calibrating exposure
📊 Advanced Features:
• Rolling 3-month analysis for reliable patterns
• Precise pip movement calculations
• Sample size tracking for statistical validity
• Real-time current hour comparison
• Color-coded visual system for instant insights
⚡ Pro Trading Tips:
• Use during major session overlaps for maximum opportunity
• Compare patterns across different instruments
• Combine with volume analysis for deeper insights
• Track seasonal variations in hourly patterns
• Build trading schedules around peak hours
🎓 Educational Value:
• Understand market microstructure
• Learn global market dynamics
• Master timezone relationships
• Develop timing intuition
🛠️ Customization:
• Adjustable lookback period
• Flexible pip multiplier
• Multiple timezone options
• Visual preference settings
Whether you're scalping the 1-minute chart or managing longer-term positions, the Hourly Volatility Explorer provides the precise timing intelligence needed for today's global markets.
Transform your trading schedule from guesswork to science. Know exactly when markets move, why they move, and how to position yourself for maximum opportunity.
#TechnicalAnalysis #Trading #Volatility #MarketTiming #DayTrading #Forex #Crypto #TradingView #PineScript #MarketAnalysis #TradingStrategy #RiskManagement #GlobalMarkets #FinancialMarkets #TradingTools #MarketStructure #PriceAction #Scalping #SwingTrading #AlgoTrading
Buscar en scripts para "pro"

Nef33 Forex & Crypto Trading Signals PRO
1. Understanding the Indicator's Context
The indicator generates signals based on confluence (trend, volume, key zones, etc.), but it does not include predefined SL or TP levels. To establish them, we must:
Use dynamic or static support/resistance levels already present in the script.
Incorporate volatility (such as ATR) to adjust the levels based on market conditions.
Define a risk/reward ratio (e.g., 1:2).
2. Options for Determining SL and TP
Below, I provide several ideas based on the tools available in the script:
Stop Loss (SL)
The SL should protect you from adverse movements. You can base it on:
ATR (Volatility): Use the smoothed ATR (atr_smooth) multiplied by a factor (e.g., 1.5 or 2) to set a dynamic SL.
Buy: SL = Entry Price - (atr_smooth * atr_mult).
Sell: SL = Entry Price + (atr_smooth * atr_mult).
Key Zones: Place the SL below a support (for buys) or above a resistance (for sells), using Order Blocks, Fair Value Gaps, or Liquidity Zones.
Buy: SL below the nearest ob_lows or fvg_lows.
Sell: SL above the nearest ob_highs or fvg_highs.
VWAP: Use the daily VWAP (vwap_day) as a critical level.
Buy: SL below vwap_day.
Sell: SL above vwap_day.
Take Profit (TP)
The TP should maximize profits. You can base it on:
Risk/Reward Ratio: Multiply the SL distance by a factor (e.g., 2 or 3).
Buy: TP = Entry Price + (SL Distance * 2).
Sell: TP = Entry Price - (SL Distance * 2).
Key Zones: Target the next resistance (for buys) or support (for sells).
Buy: TP at the next ob_highs, fvg_highs, or liq_zone_high.
Sell: TP at the next ob_lows, fvg_lows, or liq_zone_low.
Ichimoku: Use the cloud levels (Senkou Span A/B) as targets.
Buy: TP at senkou_span_a or senkou_span_b (whichever is higher).
Sell: TP at senkou_span_a or senkou_span_b (whichever is lower).
3. Practical Implementation
Since the script does not automatically draw SL/TP, you can:
Calculate them manually: Observe the chart and use the levels mentioned.
Modify the code: Add SL/TP as labels (label.new) at the moment of the signal.
Here’s an example of how to modify the code to display SL and TP based on ATR with a 1:2 risk/reward ratio:
Modified Code (Signals Section)
Find the lines where the signals (trade_buy and trade_sell) are generated and add the following:
pinescript
// Calculate SL and TP based on ATR
atr_sl_mult = 1.5 // Multiplier for SL
atr_tp_mult = 3.0 // Multiplier for TP (1:2 ratio)
sl_distance = atr_smooth * atr_sl_mult
tp_distance = atr_smooth * atr_tp_mult
if trade_buy
entry_price = close
sl_price = entry_price - sl_distance
tp_price = entry_price + tp_distance
label.new(bar_index, low, "Buy: " + str.tostring(math.round(bull_conditions, 1)), color=color.green, textcolor=color.white, style=label.style_label_up, size=size.tiny)
label.new(bar_index, sl_price, "SL: " + str.tostring(math.round(sl_price, 2)), color=color.red, textcolor=color.white, style=label.style_label_down, size=size.tiny)
label.new(bar_index, tp_price, "TP: " + str.tostring(math.round(tp_price, 2)), color=color.blue, textcolor=color.white, style=label.style_label_up, size=size.tiny)
if trade_sell
entry_price = close
sl_price = entry_price + sl_distance
tp_price = entry_price - tp_distance
label.new(bar_index, high, "Sell: " + str.tostring(math.round(bear_conditions, 1)), color=color.red, textcolor=color.white, style=label.style_label_down, size=size.tiny)
label.new(bar_index, sl_price, "SL: " + str.tostring(math.round(sl_price, 2)), color=color.red, textcolor=color.white, style=label.style_label_up, size=size.tiny)
label.new(bar_index, tp_price, "TP: " + str.tostring(math.round(tp_price, 2)), color=color.blue, textcolor=color.white, style=label.style_label_down, size=size.tiny)
Code Explanation
SL: Calculated by subtracting/adding sl_distance to the entry price (close) depending on whether it’s a buy or sell.
TP: Calculated with a double distance (tp_distance) for a 1:2 risk/reward ratio.
Visualization: Labels are added to the chart to display SL (red) and TP (blue).
4. Practical Strategy Without Modifying the Code
If you don’t want to modify the script, follow these steps manually:
Entry: Take the trade_buy or trade_sell signal.
SL: Check the smoothed ATR (atr_smooth) on the chart or calculate a fixed level (e.g., 1.5 times the ATR). Also, review nearby key zones (OB, FVG, VWAP).
TP: Define a target based on the next key zone or multiply the SL distance by 2 or 3.
Example:
Buy at 100, ATR = 2.
SL = 100 - (2 * 1.5) = 97.
TP = 100 + (2 * 3) = 106.
5. Recommendations
Test in Demo: Apply this logic in a demo account to adjust the multipliers (atr_sl_mult, atr_tp_mult) based on the market (forex or crypto).
Combine with Zones: If the ATR-based SL is too wide, use the nearest OB or FVG as a reference.
Risk/Reward Ratio: Adjust the TP based on your tolerance (1:1, 1:2, 1:3)

Daily Price LevelsTrack daily price action like a pro with instant visibility of key levels, percentages, and P&L values - all in one clean view."
Bullet points:
• Shows Daily Open, High, Low & Median levels
• Dynamic color-coding: green above open, red below
• Real-time price labels with:
Exact price levels
% distance between levels
Point values
Dollar values per contract
• Auto-repaints on timeframe changes
• 30min alerts for median crosses

NIFTY VWAP DistanceNIFTY Futures VWAP Distance Indicator
Track price deviation from Volume-Weighted Average Price in real-time
📈 Key Features:
Measures absolute (points) and percentage distance from VWAP
Daily session reset aligned with NSE trading hours
Dual-axis visualization with clear zero reference line
Real-time data table display for instant analysis
Typical price calculation: (H+L+C)/3 formula
Built-in safeguards against division errors
🎯 Ideal For:
Intraday traders monitoring mean reversion opportunities
Algorithmic traders needing VWAP deviation metrics
Swing traders identifying overextended price moves
Market profile analysts studying auction theory
📊 How to Use:
Apply to NIFTY Futures chart (1m-1h timeframes recommended)
Blue line = Points above/below VWAP
Red line = Percentage deviation
Positive values = Price > VWAP (bullish territory)
Negative values = Price < VWAP (bearish territory)
💡 Pro Tips:
Combine with volume profile for confirmation
Watch for >1% deviations for potential reversals
Use divergence patterns for early trend change signals
Works best with raw futures data (not continuous contracts)
🔧 Technical Specs:
Pine Script v5+
No repainting
Low latency calculations
Mobile-friendly display
"Know when price strays too far from fair value"

15-Minute ORB by @RhinoTradezOverview
Hey traders, ready to jump on the morning breakout train? The 15-Minute ORB by @RhinoTradez
is your go-to pal for rocking the Opening Range Breakout (ORB) scene, zeroing in on the first 15 minutes of the U.S. market day—9:30 to 9:45 AM Eastern Time. Picture this: sleek orange lines mark the high and low of that opening rush, but they only hang out during regular trading hours (9:30 AM-4:00 PM ET) and reset fresh each day—no old baggage here! Built in Pine Script v6 for that cutting-edge feel, it’s loaded with breakout signals and alerts to keep your trading game strong—ideal for SPY, QQQ, or any ticker you love.
Crafted by @RhinoTradez
to fuel your daily grind—let’s hit those breakouts running!
What It Does
The ORB strategy is all about that early market spark: the 9:30-9:45 AM range sets the battlefield, and breakouts signal the charge. Here’s the rundown:
Captures the Range : Snags the high and low from the 9:30-9:45 AM ET candle—U.S. market kickoff, locked in.
Daily Refresh : Wipes yesterday’s lines at 9:30 AM ET each day—today’s all that matters.
Regular Hours Focus : Orange lines shine from 9:45 AM to 4:00 PM ET, vanishing outside those hours.
Breakout Signals : Green triangles for upside breaks, red for downside, all within regular hours.
Alerts You : Chimes in with “Price broke above 15-min ORB High: 597” (or below the low) when the move hits.
It’s your morning breakout blueprint—simple, focused, and trader-ready.
Functionality Breakdown:
15-Minute ORB Snap:
Locks the high and low of the 9:30-9:45 AM ET candle on a 15-minute chart (EST/EDT auto-adjusted).
Resets daily at 9:30 AM ET—yesterday’s range is outta here.
Regular Hours Only:
Lines glow from 9:45 AM to 4:00 PM ET, keeping pre-market and after-hours clean.
Breakout Flags:
Marks price busting above the ORB high (green triangle below bar) or below the low (red triangle above), only during 9:30 AM-4:00 PM.
Alert Action:
Drops a custom alert with the breakout price (e.g., “Price broke below 15-min ORB Low: 594”)—stay in the know, hands-free.
Customization Options
Keep it chill with one slick tweak:
ORB Line Color : Starts at orange—vibrant and trader-cool! Flip it to blue, purple, or any shade you dig in the settings. Make it yours.
How to Use It
Pop It On: Add it to a 15-minute chart—SPY, QQQ, or your hot pick works like a dream.
Time It Right: Set your chart to “America/New_York” time (Chart Settings > Time Zone) to sync with 9:30 AM ET.
Choose Your Color: Dive into the indicator settings and pick your ORB line color—orange kicks it off, but you’re in charge.
Set Alerts: Right-click the indicator, add an alert with “Any alert() function call,” and catch breakouts live.
Ride the Wave: Green triangle? Upward vibe. Red? Downside alert. Mix with volume or candles for extra punch.
Pro Tips
15-Minute Only : Tailored for that 9:30-9:45 AM ET candle—other timeframes won’t sync up.
Daily Reset : Lines refresh at 9:30 AM ET—always today’s play.
Breakout Boost : High volume or RSI can seal the deal on those triangle signals.
No Clutter : Lines stick to 9:30 AM-4:00 PM ET—your chart stays tidy.
Brought to you by @RhinoTradez
in Pine Script v6, this ORB script’s your morning breakout wingman. Slap it on, pick a color, and let’s chase those moves together! Happy trading!

Capitulation Volume Detector by @RhinoTradezOverview
Hey traders, want to catch the market when it’s totally losing it? The Capitulation Volume Detector is your go-to buddy for spotting those wild moments when panic selling takes over. Picture this: prices plummet, volume explodes, and everyone’s bailing out—that’s capitulation, and it might just signal a turning point. This script throws a bright marker on your chart whenever the chaos hits, so you can decide if it’s time to jump in or sit tight. Built fresh in Pine Script v6, it’s sleek, customizable, and packs an alert to keep you posted—perfect for stocks, indices like SPY, or even crypto chaos.
Inspired by epic sell-offs like March 2020’s COVID crash, this tool’s here to help you navigate the storm with a smile (and maybe a profit).
What It Does
Capitulation volume is that “everyone’s out!” moment: a steep price drop meets a massive volume surge, hinting that sellers are tapped out. It’s not a guaranteed reversal—sometimes the bleeding continues—but it’s a loud clue that fear’s peaked. Here’s the magic:
Volume Check : Measures current volume against a customizable average (default: 20 bars).
Price Plunge : Tracks the percentage drop from the last close.
Capitulation Cal l: When volume rockets past your threshold (e.g., 2x average) and price tanks (e.g., -5%), you get a red triangle above the bar.
Stay Alert : Fires off a detailed message (e.g., “Volume 300M > 200M, Drop -10%”) so you’re never caught off guard.
Think of it as your market meltdown radar—simple, effective, and ready to roll.
Functionality Breakdown
Volume Surge Spotter :
Uses a 20-bar Simple Moving Average (SMA) of volume as your baseline.
Flags any bar where volume exceeds this average by your chosen multiplier (default: 2x).
Price Drop Detector :
Calculates the percentage change from the prior close.
Triggers when the drop’s bigger than your set limit (default: -5%).
Capitulation Marker:
Combines both signals: high volume + sharp drop = capitulation.
Slaps a red triangle above the bar for instant “whoa, there it is!” vibes.
Real-Time Alerts :
Sends a custom alert with volume and drop details, keeping you in the loop without babysitting the chart.
Customization Options
Tune it to your trading style with these easy settings:
Volume Multiplier (x Avg): Starts at 2.0 (2x average volume). Bump it to 3.0 for only the wildest spikes or dial it to 1.5 for more frequent catches. Range: 1.0-10.0, step 0.1.
Price Drop Threshold (%): Default 5.0 (a -5% drop). Go big with 10.0 for crash-level falls or ease to 3.0 for lighter dips. Range: 1.0-20.0, step 0.1.
Average Volume Period: Default 20 bars. Stretch it to 50 for a broader view or shrink to 10 for quick reactions. Range: 1-100.
Capitulation Marker Color: Red by default—because panic’s loud! Switch it to blue, green, or pink to match your chart’s personality.
How to Use It
Drop It On : Add it to any chart with volume data—SPY daily for market moves, /ES 15-minute for intraday action, or your go-to stock.
Play with Settings : Hit the indicator’s config gear and tweak the multiplier, drop threshold, period, or marker color to fit your vibe.
Set an Alert : Right-click the indicator, add an alert with “Any alert() function call,” and get pinged when capitulation strikes.
Watch the Action : Look for those red triangles on big drop days—pair with your favorite reversal signals for extra oomph.
Pro Tips
Daily Charts : Catch market-wide capitulations like March 23, 2020 (SPY: -10%, 3x volume).
Intraday : Spot flash crashes or sector sell-offs on 15-minute or 5-minute bars.
Context Matters : High volume alone isn’t enough—check the VIX or candlestick patterns (e.g., hammers) to confirm a bottom.

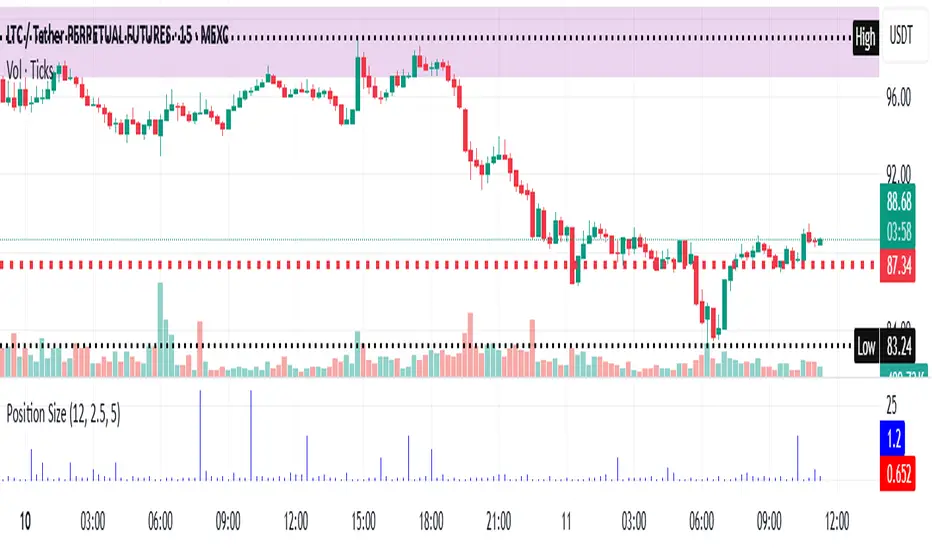
Risk-Based Position Size ProRisk-Based Position Size Indicator
Overview:
The Risk-Based Position Size Indicator helps traders determine the appropriate position size for each trade based on their total capital and risk percentage. This indicator dynamically calculates position size using two different methods:
Wick Range (High - Low): Calculates position size based on the total range of the candlestick.
Candle Body (Close - Open): Calculates position size using only the body of the candlestick, ignoring wicks.
It provides a visual representation of position sizing as a histogram and adjusts dynamically based on price movement.
Key Features:
✅ Two Calculation Modes:
Wick Range (Red Bars) – Uses the entire candlestick range (High - Low).
Candle Body (Blue Bars) – Uses only the difference between Close and Open.
✅ Customizable Risk Settings:
Define Total Capital (default: $100,000).
Set Risk Percentage per trade (default: 1%).
✅ Automatic Position Sizing:
Adjusts position size dynamically for each candlestick.
Prevents division errors when the range is zero.
✅ Rounding Option:
Toggle rounding of position size for better readability.
✅ Clear Visual Representation:
Displayed as a histogram for easy interpretation.
Red bars for Wick Range, Blue bars for Candle Body calculations.
How to Use:
Add the indicator to your TradingView chart.
Set your Total Capital and Risk Percentage in the settings.
Choose a Calculation Method:
Wick Range: Uses High - Low for sizing.
Candle Body: Uses absolute difference of Close - Open.
If desired, enable Round Position Size for easier interpretation.
Observe the histogram bars to see the calculated position size for each candle.
This indicator is useful for risk management, ensuring that position sizes are aligned with account size and market volatility. 🚀
New Features & Fixes:
✅ User can select decimal precision (0 to 5 places) from the settings.
✅ If rounding is enabled, values are rounded based on the chosen precision.
✅ If rounding is disabled, original values are shown without forced rounding.
✅ Wick Range (Red) & Candle Body (Blue) are still plotted together.
Now, you have full control over how many decimal places to display! 🎯
Supertrend TP SL (PRO)2. Main Components:
Supertrend Indicator:
Theoretical basis: The Supertrend indicator is based on two main concepts: Average True Range (ATR) and Factor. ATR measures the extent of price fluctuations in a given period of time, while Factor determines the sensitivity of the indicator to price changes.
Mechanism of operation: The indicator calculates two possible lines: one line representing the potential support level and another line representing the potential resistance level. The selection of the appropriate line depends on the current price direction. When the price is above the line, the indicator is considered to be in an uptrend, and vice versa.
Customizable inputs:
atrPeriod: Allows the trader to specify the time period for calculating the ATR. Shorter periods make the indicator more sensitive to price changes, while longer periods reduce its sensitivity.
factor: Allows the adjustment of the factor. Higher values make the indicator less likely to give false signals, but they may also delay entry signals.
Risk Management:
Take Profit and Stop Loss Orders:
TPPoints: Specifies the distance between the entry price and the take profit level. This distance is expressed in points, and is converted to an actual price value using syminfo.mintick (the smallest possible price movement of the traded asset).
SLPoints: Specifies the distance between the entry price and the stop loss level.
Importance: These orders allow the trader to specify the maximum loss he is willing to take and the profit target he is aiming to achieve, which helps in effective risk management.
Activate/Disable Trades:
isLongEnabled: Allows buy trades to be enabled or disabled, which allows the trader to trade in one direction only (for example, only trade in the uptrend during a bull market).
isShortEnabled: Allows sell trades to be enabled or disabled.
isTakeProfitEnabled: Allows take profit orders to be enabled or disabled. The trader may wish to disable them if he prefers to manage his trades manually.
isStopLossEnabled: Allows you to enable or disable stop loss orders. Although disabling them may seem tempting in some cases, it is a very risky move.
Visual Customization:
Line Style and Width:
lineStyle: Allows the trader to choose the style of lines used to draw TP and SL levels (Solid, Dashed, Dotted).
lineWidth: Sets the thickness of the lines.
Label Size:
labelSize: Allows you to set the size of the labels that display TP and SL levels (Small, Normal, Large).
Colors:
bullColor, bearColor, tpColor, slColor: Allows the trader to customize the colors of the different elements on the chart, making visual analysis easier.
3. Strategy Logic:
Determining Entry Signals: The strategy relies on the Supertrend indicator to determine entry signals. When the Supertrend trend changes from bearish to bullish, a buy trade is triggered (if isLongEnabled is enabled). When the trend changes from bullish to bearish, a sell trade is triggered (if isShortEnabled is enabled).
Order Execution: Once the entry signal is triggered, the strategy automatically places buy or sell orders.
Trade Management: After opening a trade, the strategy monitors the price and automatically triggers Take Profit and Stop Loss orders if the price reaches the specified levels.
Visualization: The strategy displays useful information on the chart, such as TP and SL lines, entry and exit signals, which helps the trader understand the strategy’s behavior and evaluate its performance.
4. Advanced Tips:
Optimizing Settings: The strategy’s performance can be improved by adjusting different input values. For example, the trader can experiment with different values for atrPeriod and factor to improve the accuracy of Supertrend signals.
Combining Indicators: This strategy can be combined with other indicators to improve the accuracy of entry signals. For example, the Relative Strength Index (RSI) can be used to confirm Supertrend signals.
Time Analysis: The strategy’s performance can be analyzed over different time periods to evaluate its effectiveness in various market conditions.
Strategy Testing: Before using the strategy in real trading, it should be tested on historical data (Backtesting) to evaluate its performance and determine the optimal settings.
5. Associated Risks:
False Signals: The Supertrend indicator may sometimes give false signals, especially in volatile markets.
Losses: Even with the use of stop loss orders, the trader may be exposed to significant losses.
Over-optimization: Over-optimization of settings on historical data may lead to misleading results. The trader should be careful about generalizing the results to future data.
Over-reliance on automation: The automated strategy should not be relied upon completely. The trader should monitor the trades and make appropriate decisions when necessary.
6. Disclaimer:
I am not a licensed financial advisor. This strategy is provided for educational and illustrative purposes only and should not be considered as investment advice. Trading in financial markets involves significant risks and you may lose your invested capital. Before making any investment decisions, consult a qualified financial advisor and conduct your own research. You alone are responsible for your trading decisions and their results. By using this strategy, you acknowledge and agree that I am not responsible for any losses or damages you may incur.
2. المكونات الرئيسية:
مؤشر Supertrend:
الأساس النظري: يعتمد مؤشر Supertrend على مفهومين رئيسيين هما: متوسط المدى الحقيقي (Average True Range - ATR) ومعامل الضرب (Factor). ATR يقيس مدى تقلبات الأسعار في فترة زمنية محددة، بينما Factor يحدد مدى حساسية المؤشر لتغيرات الأسعار.
آلية العمل: يقوم المؤشر بحساب خطين محتملين: خط يمثل مستوى الدعم المحتمل وخط آخر يمثل مستوى المقاومة المحتمل. يعتمد اختيار الخط المناسب على اتجاه السعر الحالي. عندما يكون السعر أعلى من الخط، يعتبر المؤشر في اتجاه صاعد، والعكس صحيح.
المدخلات القابلة للتخصيص:
atrPeriod: يتيح للمتداول تحديد الفترة الزمنية لحساب ATR. الفترات الأقصر تجعل المؤشر أكثر حساسية لتغيرات الأسعار، بينما الفترات الأطول تقلل من حساسيته.
factor: يسمح بتعديل معامل الضرب. القيم الأعلى تجعل المؤشر أقل عرضة لإعطاء إشارات خاطئة، ولكنها قد تؤخر أيضًا إشارات الدخول.
إدارة المخاطر:
أوامر جني الأرباح وإيقاف الخسارة:
TPPoints: يحدد المسافة بين سعر الدخول ومستوى جني الأرباح. يتم التعبير عن هذه المسافة بالنقاط (Points)، ويتم تحويلها إلى قيمة سعرية فعلية باستخدام syminfo.mintick (أصغر حركة سعرية ممكنة للأصل المتداول).
SLPoints: يحدد المسافة بين سعر الدخول ومستوى إيقاف الخسارة.
الأهمية: تتيح هذه الأوامر للمتداول تحديد الحد الأقصى للخسارة التي يرغب في تحملها والهدف الربحي الذي يسعى لتحقيقه، مما يساعد على إدارة المخاطر بشكل فعال.
تفعيل/تعطيل الصفقات:
isLongEnabled: يسمح بتفعيل أو تعطيل صفقات الشراء، مما يمكن المتداول من التداول في اتجاه واحد فقط (على سبيل المثال، التداول فقط في الاتجاه الصاعد خلال سوق صاعدة).
isShortEnabled: يسمح بتفعيل أو تعطيل صفقات البيع.
isTakeProfitEnabled: يسمح بتفعيل أو تعطيل أوامر جني الأرباح. قد يرغب المتداول في تعطيلها إذا كان يفضل إدارة صفقاته يدويًا.
isStopLossEnabled: يسمح بتفعيل أو تعطيل أوامر إيقاف الخسارة. على الرغم من أن تعطيلها قد يبدو مغريًا في بعض الحالات، إلا أنه يعتبر خطوة محفوفة بالمخاطر للغاية.
التخصيص المرئي:
نمط وعرض الخطوط:
lineStyle: يتيح للمتداول اختيار نمط الخطوط المستخدمة لرسم مستويات TP و SL (Solid, Dashed, Dotted).
lineWidth: يحدد سمك الخطوط.
حجم الملصقات:
labelSize: يسمح بتحديد حجم الملصقات التي تعرض مستويات TP و SL (Small, Normal, Large).
الألوان:
bullColor, bearColor, tpColor, slColor: تتيح للمتداول تخصيص ألوان العناصر المختلفة على الرسم البياني، مما يسهل عملية التحليل البصري.
3. منطق عمل الاستراتيجية:
تحديد إشارات الدخول: تعتمد الاستراتيجية على مؤشر Supertrend لتحديد إشارات الدخول. عندما يتغير اتجاه Supertrend من هابط إلى صاعد، يتم تفعيل صفقة شراء (إذا كانت isLongEnabled مفعلة). وعندما يتغير الاتجاه من صاعد إلى هابط، يتم تفعيل صفقة بيع (إذا كانت isShortEnabled مفعلة).
تنفيذ الأوامر: بمجرد تفعيل إشارة الدخول، تقوم الاستراتيجية بوضع أوامر الشراء أو البيع تلقائيًا.
إدارة الصفقات: بعد فتح الصفقة، تقوم الاستراتيجية بمراقبة السعر وتفعيل أوامر جني الأرباح وإيقاف الخسارة تلقائيًا في حالة وصول السعر إلى المستويات المحددة.
التمثيل المرئي: تعرض الاستراتيجية معلومات مفيدة على الرسم البياني، مثل خطوط TP و SL وإشارات الدخول والخروج، مما يساعد المتداول على فهم سلوك الاستراتيجية وتقييم أدائها.
4. نصائح متقدمة:
تحسين الإعدادات: يمكن تحسين أداء الاستراتيجية من خلال تعديل قيم المدخلات المختلفة. على سبيل المثال، يمكن للمتداول تجربة قيم مختلفة لـ atrPeriod و factor لتحسين دقة إشارات Supertrend.
الجمع بين المؤشرات: يمكن دمج هذه الاستراتيجية مع مؤشرات أخرى لتحسين دقة إشارات الدخول. على سبيل المثال، يمكن استخدام مؤشر القوة النسبية (RSI) لتأكيد إشارات Supertrend.
التحليل الزمني: يمكن تحليل أداء الاستراتيجية على مدى فترات زمنية مختلفة لتقييم مدى فعاليتها في ظروف السوق المتنوعة.
اختبار الاستراتيجية: قبل استخدام الاستراتيجية في التداول الحقيقي، يجب اختبارها على بيانات تاريخية (Backtesting) لتقييم أدائها وتحديد الإعدادات المثلى.
5. المخاطر المرتبطة:
الإشارات الخاطئة: قد يعطي مؤشر Supertrend إشارات خاطئة في بعض الأحيان، خاصة في الأسواق المتقلبة.
الخسائر: حتى مع استخدام أوامر إيقاف الخسارة، قد يتعرض المتداول لخسائر كبيرة.
التحسين المفرط: قد يؤدي التحسين المفرط للإعدادات على بيانات تاريخية إلى نتائج مضللة. يجب أن يكون المتداول حذرًا بشأن تعميم النتائج على البيانات المستقبلية.
الاعتماد الزائد على الأتمتة: يجب عدم الاعتماد بشكل كامل على الاستراتيجية الآلية. يجب على المتداول مراقبة الصفقات واتخاذ القرارات المناسبة عند الضرورة.
6. إخلاء المسؤولية:
أنا لست مستشارًا ماليًا مرخصًا. هذه الاستراتيجية مقدمة لأغراض تعليمية وتوضيحية فقط، ولا ينبغي اعتبارها نصيحة استثمارية. التداول في الأسواق المالية ينطوي على مخاطر كبيرة، وقد تخسر رأس المال المستثمر. قبل اتخاذ أي قرارات استثمارية، استشر مستشارًا ماليًا مؤهلاً وقم بإجراء بحثك الخاص. أنت وحدك المسؤول عن قراراتك التجارية ونتائجها. باستخدام هذه الاستراتيجية، فإنك تقر وتوافق على أنني لست مسؤولاً عن أي خسائر أو أضرار قد تتكبدها.

Zen ABR### **Average Bar Range (ABR) Levels** – A Simple Yet Powerful Scalping Tool
The **ABR Levels** indicator dynamically calculates the **average bar range** and plots three key levels on your chart:
✅ **0.5x ABR** – Half the average bar range
✅ **1x ABR** – The full average bar range
✅ **2x ABR** – Double the average bar range
This provides an **instant volatility gauge**, helping traders adjust position size, stop losses, and targets **based on current market conditions** rather than arbitrary numbers.
### **How It Works**
- The indicator calculates **the average range of the last 8 bars** (default setting, adjustable).
- The **ABR levels update in real time**, appearing in the **top-right corner of your chart** for easy reference.
- Works across **any instrument and timeframe** – great for scalpers and intraday traders.
### **Why Use ABR Levels?**
🚀 **Avoid oversized losses** – Trade dynamically instead of using fixed stops and targets.
📉 **Recognize shifts in market conditions** – Identify when volatility is expanding or contracting.
🎯 **Refine your entries & exits** – Use ABR levels to **scale** your positions intelligently.
### **Pro Tip:**
Never enter a trade **aiming for half-R** profits. If a trade goes badly, **you might manage it to break even or half-R**, but aiming for tiny wins will **wreck your long-term edge**.
🔹 **This script is open-source!** If you're not on TradingView, you can copy the code into any AI tool to generate it for your platform. 🚀

ST -Dashboard Volume MTF , [Sese04]User Guide: ST - Dashboard Volume MTF
Introduction
This script displays a multi-timeframe (MTF) volume dashboard, tracking buy and sell volumes and the moving averages of volume. It is designed for traders using ICT (Inner Circle Trader) and SMC (Smart Money Concepts) to quickly visualize market dynamics across multiple timeframes.
Settings and Features
📌 User Inputs
Customizable settings allow traders to adjust the dashboard display and volume moving averages.
Volume Display per Timeframe
show_vol_1m: Show volume for 1-minute chart.
show_vol_5m: Show volume for 5-minute chart.
show_vol_15m: Show volume for 15-minute chart.
show_vol_1h: Show volume for 1-hour chart.
show_vol_4h: Show volume for 4-hour chart.
show_vol_1d: Show volume for 1-day chart.
Volume Moving Average Settings
ma_length_short: Length of the short-term moving average (default 5 periods).
ma_length_long: Length of the long-term moving average (default 14 periods).
Dashboard Customization
dashboard_position: Dashboard position (Bottom Right, Bottom Left, Top Right, Top Left).
text_color: Text color for the dashboard.
text_size: Text size (small, normal, large).
How the Script Works
🔹 1. Calculating Buy and Sell Volume
The calculate_buy_sell function separates buy and sell volume based on the candle's open and close price:
If the closing price is higher than the opening price → Buy volume 📈.
If the closing price is lower or equal to the opening price → Sell volume 📉.
🔹 2. Retrieving Volume Data Across Multiple Timeframes
The function get_volumes collects buy and sell volume data for different timeframes using request.security().
The available timeframes are: 1m, 5m, 15m, 1h, 4h, and 1d.
🔹 3. Calculating Volume Moving Averages
The script uses ta.sma() to compute moving averages for volume trends:
ma_vol_short: Short-term moving average (e.g., 5 periods).
ma_vol_long: Long-term moving average (e.g., 14 periods).
🔹 4. Creating and Displaying the Dashboard
A table (table.new()) is generated at the last bar (barstate.islast) to display the volume data:
A title “📊 Volume Dashboard (Buy vs Sell)” in purple.
Column headers:
TIMEFRAME (e.g., 1M, 5M, 15M, 1H, 4H, 1D).
BUY VOLUME (dark blue).
SELL VOLUME (dark red).
Buy and Sell Volume values are displayed in their respective cells for easy reading.
How to Use This Script on TradingView?
Adding the Script
Open TradingView.
Go to Pine Editor and paste the script.
Click "Add to Chart".
Configuring the Settings
Open the indicator settings.
Enable/disable the desired timeframes.
Adjust the moving average lengths if necessary.
Interpreting the Data
Increasing buy volume across timeframes may indicate bullish momentum.
Rising sell volume suggests a bearish reversal.
Crossovers of volume moving averages can help detect market shifts.
Conclusion
This script is a powerful tool for analyzing volume dynamics across multiple timeframes. It provides a quick overview of the balance between buyers and sellers, essential for ICT scalping and liquidity-based trading.
🚀 Pro Tip: Combine this dashboard with other SMC indicators (engulfing candles, pivot points) to refine your trading decisions.

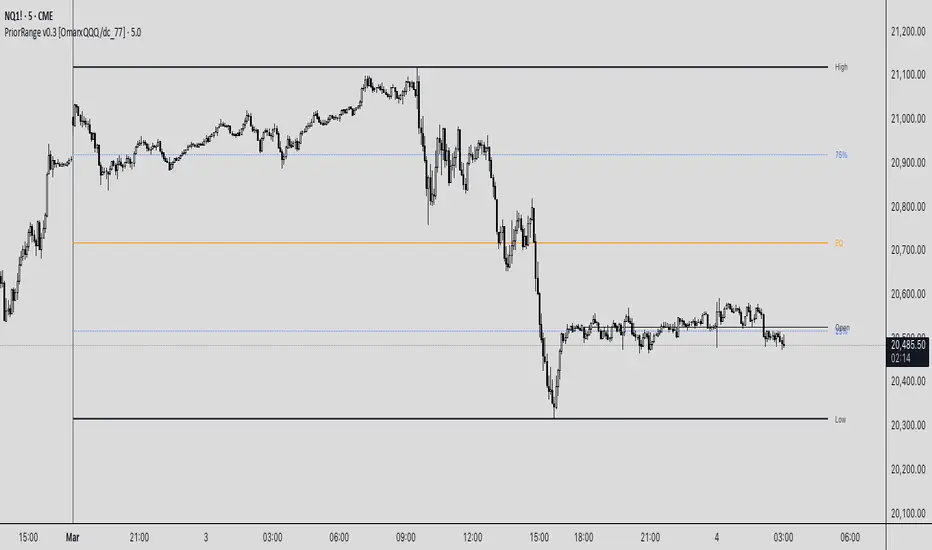
PriorRange v0.3 [OmarxQQQ/dc_77]PriorRangeLevels is a versatile indicator that plots key price levels based on prior period ranges across multiple timeframes. This tool helps traders identify potential support, resistance, and breakout zones by displaying the High, Low, 75%, 50% (EQ), and 25% levels from the previous period.
Key Features:
- Multi-timeframe analysis from 1-minute to Monthly charts
- Time zone flexibility with options for major global markets (NYC, London, Tokyo, etc.)
- Customizable display for each level (High, Low, 75%, EQ, 25%, Open)
- Clean, organized settings interface with grouped options
- Anchor line marking the start of prior periods
- Current period open price reference
How It Works:
The indicator detects new periods based on your selected timeframe and calculates the range of the previous period. It then plots horizontal lines at the High, Low, and three internal levels (75%, 50%, 25%) extending forward by your specified number of bars. These levels serve as potential support/resistance zones and decision points for your trading strategy.
Trading Applications:
- Use High/Low levels as potential breakout targets or reversal zones
- Monitor price reaction to the EQ (50%) level to gauge trend strength
- Identify intraday support/resistance based on previous period ranges
- Plan entries and exits around established market structure
Each component can be individually customized with different line styles, colors, and widths to match your chart preferences and analytical needs.
Originally created by @dc_77 with enhanced organization, multi-timeframe capabilities, and improved user interface. As Requested by many people.
populi a populo pro populo
GLGT
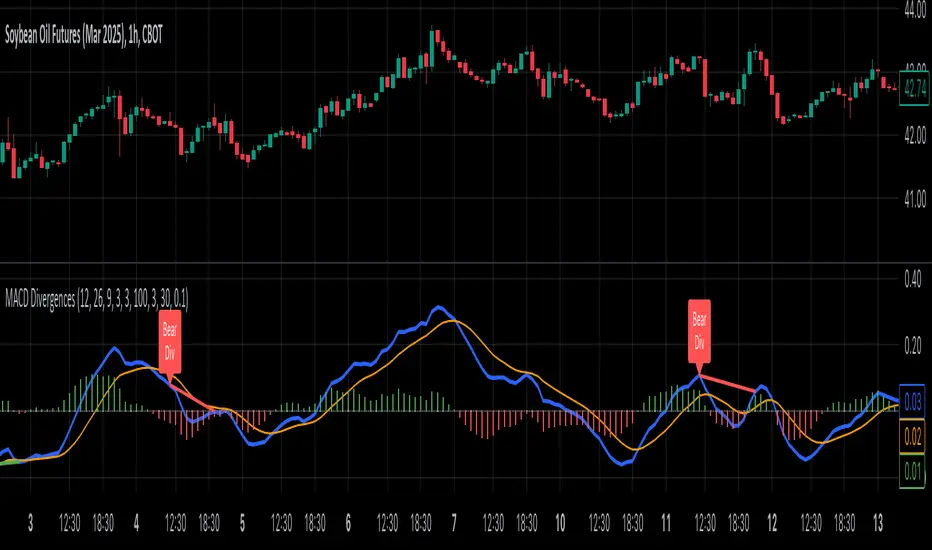
MACD Divergence all in oneMACD Divergence all in one
It can also be named as MACD dual divergence detector pro !
A sophisticated yet user-friendly tool designed to identify both bullish and bearish divergences using the MACD (Moving Average Convergence Divergence) indicator. This advanced script helps traders spot potential trend reversals by detecting hidden momentum shifts in the market, offering a comprehensive solution for divergence trading.
🎯 Key Features:
• Automatic detection of bullish and bearish divergences
• Clear visual signals with color-coded lines (Green for bullish, Red for bearish)
• Smart filtering system to eliminate false signals
• Customizable parameters to match your trading style
• Clean, uncluttered chart presentation
• Optimized performance for real-time analysis
• Easy-to-read labels showing divergence types
• Built-in signal spacing to avoid clustering
📊 How it works:
The indicator uses an advanced algorithm to analyze the relationship between price action and MACD momentum to identify:
Bullish Divergences:
- Price makes higher lows while MACD shows lower lows
- Signals potential trend reversal from bearish to bullish
- Marked with green lines and upward labels
Bearish Divergences:
- Price makes lower highs while MACD shows higher highs
- Signals potential trend reversal from bullish to bearish
- Marked with red lines and downward labels
⚙️ Customizable Settings:
1. MACD Parameters:
- Fast Length (default: 12)
- Slow Length (default: 26)
- Signal Length (default: 9)
2. Divergence Detection:
- Left/Right Pivot Bars
- Divergence Lookback Period
- Minimum/Maximum Divergence Length
- Divergence Strength Filter
3. Visual Settings:
- Clear color coding for easy identification
- Adjustable line thickness
- Customizable label size
💡 Best Practices:
- Most effective on higher timeframes (1H, 4H, Daily)
- Combine with support/resistance levels
- Use with trend lines and price action
- Consider volume confirmation
- Best results during trending markets
- Use appropriate stop-loss levels
🎓 Trading Tips:
1. Look for bullish divergences near support levels
2. Watch for bearish divergences near resistance zones
3. Confirm signals with other technical indicators
4. Consider market context and overall trend
5. Use proper position sizing and risk management
⚠️ Important Notes:
- Past performance doesn't guarantee future results
- Always use proper risk management
- Test settings on historical data first
- Different timeframes may require parameter adjustments
- Not all divergences lead to reversals
Created by: Anmol-max-star
Last Updated: 2025-02-25 16:15:08 UTC
📌 Regular updates and improvements planned!
Disclaimer:
This indicator is for informational purposes only. Always conduct your own analysis and use proper risk management techniques. Trading involves risk of loss, and past performance does not guarantee future results.
🤝 Support:
Feel free to leave comments for:
- Suggestions
- Improvements
- Feature requests
- Bug reports
- General feedback
Your feedback helps make this tool better for everyone!
Happy Trading and May the Trends Be With You! 📈
Multi-Timeframe VWAP DashboardMulti-Timeframe VWAP Dashboard with Advanced Customization**
Unlock the power of **Volume-Weighted Average Price (VWAP)** across multiple timeframes with this highly customizable and feature-rich Pine Script. Designed for traders who demand precision and flexibility, this script provides a **comprehensive VWAP dashboard** that adapts to your trading style and strategy. Whether you're a day trader, swing trader, or long-term investor, this tool offers unparalleled insights into market trends and price levels.
---
### **Key Features:**
1. **Multi-Timeframe VWAP Calculation:**
- Calculate VWAP across **12-minute, 48-minute, 96-minute, 192-minute, daily, weekly, monthly, and even yearly timeframes**.
- Supports **custom timeframes** for tailored analysis.
2. **Price Source Selection:**
- Choose from multiple price sources for VWAP calculation, including **Open, High, Low, Close, HL2, HLC3, HLCC4, and All**.
- Optimize VWAP for **uptrends and downtrends** by selecting the most relevant price source.
3. **Customizable Labels:**
- Add **dynamic labels** to each VWAP line for quick reference.
- Customize label **colors, sizes, and offsets** to suit your chart setup.
- Display **price values** and **session types** (e.g., "12 Min", "Daily", "Weekly") directly on the chart.
4. **Advanced Session Detection:**
- Automatically detect new sessions for **intraday, daily, weekly, monthly, and yearly timeframes**.
- Ensures accurate VWAP calculations for each session.
5. **Plot Visibility Control:**
- Toggle the visibility of individual VWAP plots to **reduce clutter** and focus on the most relevant timeframes.
- Includes options for **short-term, medium-term, and long-term VWAPs**.
6. **Comprehensive Timeframe Coverage:**
- From **12-minute intervals** to **12-month intervals**, this script covers all major timeframes.
- Perfect for traders who analyze markets across multiple horizons.
7. **User-Friendly Inputs:**
- Intuitive input options for **timeframes, colors, labels, and offsets**.
- Easily customize the script to match your trading preferences.
8. **Dynamic Label Positioning:**
- Labels adjust automatically based on price movements and session changes.
- Choose from **multiple offset options** to position labels precisely.
9. **Miscellaneous Customization:**
- Adjust **text color, label size, and price display settings**.
- Enable or disable **price values** and **session type labels** for a cleaner chart.
---
### **Why Use This Script?**
- **Versatility:** Suitable for all trading styles, including scalping, day trading, swing trading, and long-term investing.
- **Precision:** Accurate VWAP calculations across multiple timeframes ensure you never miss key price levels.
- **Customization:** Tailor the script to your specific needs with a wide range of input options.
- **Clarity:** Dynamic labels and customizable plots make it easy to interpret market trends at a glance.
---
### **How It Works:**
1. **Select Your Price Source:**
- Choose the price source (e.g., Open, Close, HL2) for VWAP calculation based on your trading strategy.
2. **Choose Timeframes:**
- Define the timeframes for VWAP calculation, from intraday to yearly intervals.
3. **Customize Labels and Plots:**
- Enable or disable labels and plots for each timeframe.
- Adjust colors, sizes, and offsets to match your chart setup.
4. **Analyze Market Trends:**
- Use the VWAP lines and labels to identify **support/resistance levels**, **trend direction**, and **potential reversal points**.
5. **Adapt to Market Conditions:**
- Switch between timeframes and price sources to adapt to changing market conditions.
---
### **Ideal For:**
- **Day Traders:** Use short-term VWAPs (e.g., 12-minute, 48-minute) to identify intraday trends and key levels.
- **Swing Traders:** Leverage medium-term VWAPs (e.g., 96-minute, daily) to spot swing opportunities.
- **Long-Term Investors:** Analyze long-term VWAPs (e.g., weekly, monthly) to gauge overall market direction.
---
### **How to Get Started:**
1. Add the script to your TradingView chart.
2. Customize the inputs to match your trading preferences.
3. Analyze the VWAP lines and labels to make informed trading decisions.
---
### **Pro Tip:**
Combine this script with other technical indicators (e.g., moving averages, RSI) for a **holistic view** of the market. Use the VWAP lines as dynamic support/resistance levels to enhance your entry and exit strategies.
This script is a must-have tool for traders who value precision, flexibility, and clarity. Share it with your audience to help them elevate their trading game. Whether they're beginners or seasoned professionals, this **Multi-Timeframe VWAP Dashboard** will become an essential part of their toolkit.

Multi-Timeframe VWAP Master ProThe Multi-Timeframe VWAP Suite is a comprehensive and highly customizable indicator designed for traders who rely on Volume-Weighted Average Price (VWAP) across multiple timeframes and periods. This tool provides a complete suite of VWAP calculations, including daily, weekly, monthly, quarterly, yearly, and custom VWAPs, allowing traders to analyze price action and volume trends with precision. Whether you're a day trader, swing trader, or long-term investor, this indicator offers unparalleled flexibility and depth for your trading strategy.
Multi-Timeframe VWAPs:
Daily, Weekly, Monthly, Quarterly, and Yearly VWAPs: Track VWAP across various timeframes to identify key support and resistance levels.
Customizable Timeframes: Use the SMA timeframe input to adjust the period for moving averages and other calculations.
Previous Period VWAPs:
Previous Daily, Weekly, Monthly, and Quarterly VWAPs: Analyze historical VWAP levels to understand past price behavior and identify potential reversal zones.
Previous Year Quarterly VWAPs: Compare current price action to VWAP levels from specific quarters of the previous year.
Custom VWAPs:
Custom Start Date and Timeframe: Define your own VWAP periods by specifying a start date and timeframe, allowing for tailored analysis.
Dynamic Custom VWAP Calculation: Automatically calculates VWAP based on your custom inputs, ensuring flexibility for unique trading strategies.
Seasonal and Yearly VWAPs:
April, July, and October VWAPs: Analyze seasonal trends by tracking VWAP levels for specific months.
Yearly VWAP: Get a broader perspective on long-term price trends with the yearly VWAP.
SMA Integration:
SMA Overlay: Combine VWAP analysis with a Simple Moving Average (SMA) for additional confirmation of trends and reversals.
Customizable SMA Length and Timeframe: Adjust the SMA settings to match your trading style and preferences.
User-Friendly Customization:
Toggle Visibility and Labels: Easily enable or disable the display of specific VWAPs and their labels to keep your chart clean and focused.
Color Customization: Each VWAP line and label is color-coded for easy identification and can be customized to suit your preferences.
Dynamic Labeling:
Automatic Labels: Labels are dynamically placed on the last bar, providing clear and concise information about each VWAP level.
Customizable Label Text: Labels include detailed information, such as the timeframe or custom period, for quick reference.
Flexible Timeframe Detection:
Automatic Timeframe Detection: The indicator automatically detects new days, weeks, months, and quarters, ensuring accurate VWAP calculations.
Support for Intraday and Higher Timeframes: Works seamlessly on all chart timeframes, from 1-minute to monthly charts.
Previous Year Quarterly VWAPs:
Q1, Q2, Q3, Q4 VWAPs: Compare current price action to VWAP levels from specific quarters of the previous year.
User-Selectable Year: Choose the year for which you want to calculate previous quarterly VWAPs.
Persistent Monthly VWAPs:
Option to Persist Monthly VWAPs Year-Round: Keep monthly VWAP levels visible even after the month ends for ongoing analysis.
Comprehensive Analysis: Combines multiple VWAP timeframes and periods into a single tool, eliminating the need for multiple indicators.
Customizable and Flexible: Tailor the indicator to your specific trading strategy with customizable timeframes, periods, and settings.
Enhanced Decision-Making: Gain deeper insights into price action and volume trends across different timeframes, helping you make more informed trading decisions.
Clean and Organized Charts: Toggle visibility and labels to keep your chart clutter-free while still accessing all the information you need.
Ideal For:
Day Traders: Use daily and intraday VWAPs to identify intraday support and resistance levels.
Swing Traders: Analyze weekly and monthly VWAPs to spot medium-term trends and reversals.
Long-Term Investors: Leverage quarterly and yearly VWAPs to understand long-term price behavior and key levels.
Seasonal Traders: Track April, July, and October VWAPs to capitalize on seasonal trends.
The Multi-Timeframe VWAP Suite is a powerful and versatile tool for traders of all styles and timeframes. With its comprehensive suite of VWAP calculations, customizable settings, and user-friendly design, it provides everything you need to analyze price action and volume trends with precision and confidence. Whether you're looking to fine-tune your intraday strategy or gain a broader perspective on long-term trends, this indicator has you covered.

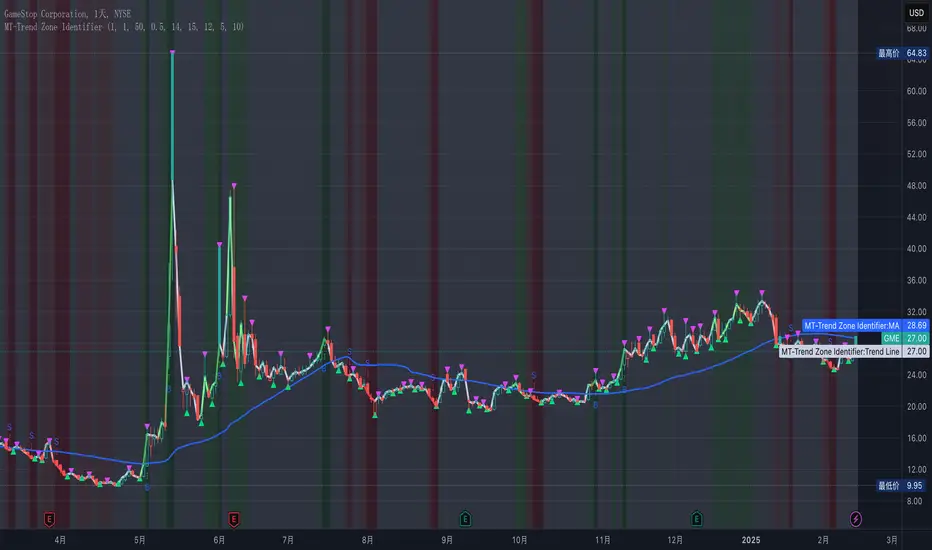
MT-Trend Zone IdentifierTrend Zone Identifier – A Dynamic Market Trend Mapping Tool
Overview
The Trend Zone Identifier is an advanced TradingView indicator that helps traders visualize different market trend phases. By leveraging Pivot Points, Moving Averages (MA), ADX (Average Directional Index), and Retest Confirmation, this tool identifies uptrend, downtrend, and ranging (sideways) conditions dynamically.
This indicator is designed to segment the market into clear trend zones, allowing traders to distinguish between confirmed trends, trend transitions (pending zones), and ranging markets. It provides an intuitive visual overlay to enhance market structure analysis and assist in decision-making.
Key Features
✔ Trend Zone Identification – Classifies price action into Uptrend (Green), Downtrend (Red), Pending Confirmation (Light Colors), and Sideways Market (Gray/Neutral)
✔ Pivot-Based Breakout & Breakdown Detection – Uses pivot highs/lows to determine trend shifts
✔ Moving Average & ADX Validation – Ensures the trend is backed by MA structure and ADX trend strength
✔ Pullback Confirmation – Allows trend confirmation based on price retesting key levels
✔ Extreme Volatility & Gaps Filtering – Optional ATR-based extreme movement filtering to avoid false signals
✔ Multi-Timeframe Support – Option to integrate higher timeframe trend validation
✔ Customizable Sensitivity – Fine-tune MA smoothing, ADX thresholds, pivot detection, and pullback range
How It Works
1. Trend Classification
• Uptrend (Green): Price is above a key MA, ADX confirms strength, and a pivot breakout occurs
• Downtrend (Red): Price is below a key MA, ADX confirms strength, and a pivot breakdown occurs
• Pending Trend (Light Colors): Initial trend breakout or breakdown is detected but requires further confirmation
• Sideways/Ranging (Gray): ADX signals a weak trend, and price remains within a neutral zone
2. Retest & Confirmation Logic
• A trend is only confirmed after a breakout or breakdown followed by a successful retest
• If the market fails the retest, the indicator resets to a neutral state
3. Custom Filters for Optimization
• Enable or disable volume filtering for confirmation
• Adjust pivot sensitivity to detect major or minor swing points
• Choose to require consecutive bars confirming the breakout/breakdown
Ideal Use Cases
🔹 Swing traders who want to capture trend transitions early
🔹 Trend-following traders who rely on confirmed market cycles
🔹 Range traders looking to identify sideways market zones
🔹 Algorithmic traders who need clean trend segmentation for automated strategies
Final Thoughts
The Trend Zone Identifier is a versatile market structure indicator that helps traders define trend cycles visually and avoid trading against weak trends. By providing clear breakout, breakdown, and retest conditions, it enhances market clarity and reduces decision-making errors.
➡ Add this to your TradingView workspace and start analyzing market trends like a pro! 🚀
EMA/SMA Ribbon Pro (AUTO HTF + Labels)This indicator is a multi-timeframe (MTF) moving average ribbon that dynamically adjusts to the next highest timeframe. It provides a visual representation of market trends by stacking multiple EMAs and SMAs with customizable color fills and labels.
Features
✅ Multi-Timeframe (MTF) Support: Automatically detects the next highest time frame or allows for manual selection
✅ Customizable Moving Averages: Supports EMA and SMA with different lengths for flexible configuration
✅ Ribbon Visualization: Smooth color transitions between different moving averages for better trend identification
✅ Crossover Labels: Detects bullish and bearish EMA/SMA crossovers and marks them on the chart
✅ Price Labels & Timeframe Display: Displays moving average values to the right of the price axis with customizable label padding and colors
How It Works
Select the HTF mode: Manual or automatic
Choose EMA/SMA lengths to create different ribbons
Enable/disable price labels for each moving average
Customize colors and transparency for ribbons and labels
Crossover labels appear when faster moving averages cross slower ones and vice versa
Use Cases
📌 Trend Identification: Identify bullish and bearish trends using multiple EMAs and SMAs
📌 Support & Resistance Zones: MAs can act as dynamic support and resistance levels
📌 Reversal & Confirmation Signals: Watch for MTF crossovers to confirm trend changes
Customization
🔹 Standard EMA Lengths: 6, 8, 13, 21, 34, 48, 100, 200, 300, 400
🔹 SMA Lengths: 48, 100, 200
🔹 Color Adjustments: Set custom colors for bullish/bearish ribbons
🔹 Crossovers: Enable/disable custom crossover pairs (e.g., 100/200 EMA, 200 EMA/SMA).
This indicator is perfect for traders who rely on multi-timeframe confluence while seeking to enhance their market analysis and decision-making process.
As always, by combining EMA/SMA Ribbon with other tools, traders ensure that they are not relying on a single indicator. This layered approach can reduce the likelihood of false signals and improve overall trading accuracy.
As always, be sure to use any indicator with price action and volume indicators for better trade confirmation!

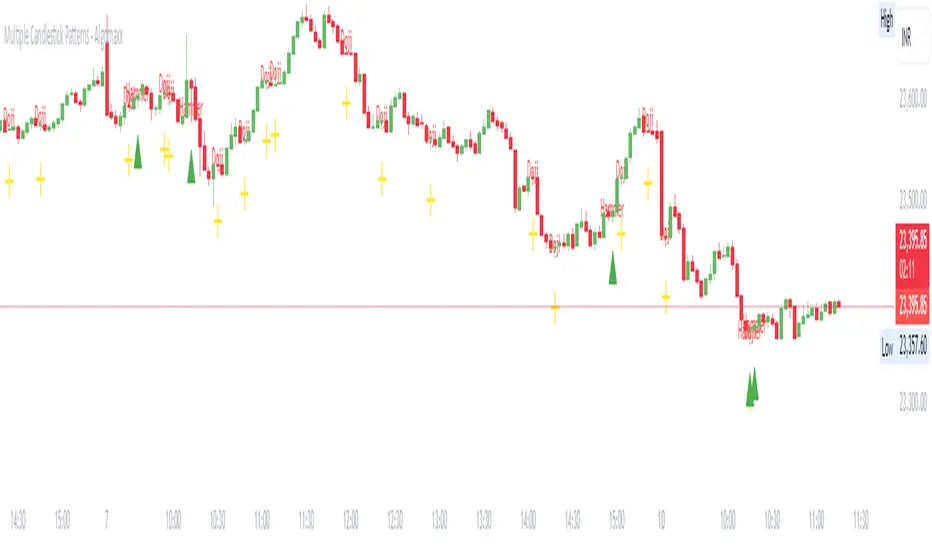
Multiple Candlestick Patterns - AlgomaxxA comprehensive candlestick pattern detection indicator that identifies seven major Japanese candlestick patterns in real-time. This indicator helps traders identify potential reversal and continuation patterns with customizable visual alerts and labels.
Features
Detects 7 major candlestick patterns:
Doji
Hammer
Shooting Star
Bullish Engulfing
Bearish Engulfing
Morning Star
Evening Star
Color-coded candlesticks for easy pattern identification
Customizable pattern indicators above/below candles
Optional pattern labels with adjustable position
Alert conditions for each pattern
Grouped settings for easy customization
Settings
General Settings
Lookback Period: Number of candles to analyze (default: 20)
Body Size Threshold: Minimum relative size for candle body (default: 0.6)
Pattern Settings
Toggle visibility for each pattern type:
Doji Pattern
Hammer Pattern
Shooting Star Pattern
Bullish Engulfing Pattern
Bearish Engulfing Pattern
Morning Star Pattern
Evening Star Pattern
Label Settings
Show Labels: Toggle pattern labels on/off
Label Text Color: Customize label color
Label Position: Choose between Left/Center/Right alignment
Label Offset: Adjust distance of labels from candles
Pattern Descriptions
Doji: Shows indecision when open and close prices are very close
Yellow color
Cross symbol below candle
Hammer: Potential bullish reversal with long lower shadow
Green color
Triangle up symbol below candle
Shooting Star: Potential bearish reversal with long upper shadow
Red color
Triangle down symbol above candle
Bullish Engulfing: Bullish reversal pattern where current green candle completely engulfs previous red candle
Light green color
Triangle up symbol below candle
Bearish Engulfing: Bearish reversal pattern where current red candle completely engulfs previous green candle
Light red color
Triangle down symbol above candle
Morning Star: Three-candle bullish reversal pattern
Seafoam green color
Triangle up symbol below candle
Evening Star: Three-candle bearish reversal pattern
Pink red color
Triangle down symbol above candle
How to Use
Add the indicator to your chart
Customize the settings based on your preferences:
Enable/disable specific patterns you want to monitor
Adjust label settings for better visibility
Set up alerts for patterns you want to be notified about
Pattern Recognition:
Watch for color changes in candlesticks indicating pattern formation
Look for shape indicators above/below candles
Read pattern labels for quick pattern identification
Trading Suggestions:
Use in conjunction with other technical indicators
Consider overall trend and support/resistance levels
Confirm patterns with volume and price action
Wait for pattern completion before making trading decisions
Tips
Patterns work best when used with multiple timeframes
Combine with trend lines and support/resistance levels
Use volume to confirm pattern strength
Consider market context and overall trend
Larger timeframes typically produce more reliable signals
Use alerts to avoid missing important pattern formations
Disclaimer
This indicator is for informational and educational purposes only. No guarantee is made regarding the accuracy of pattern detection or potential future price movements. Always use proper risk management and consider multiple factors before making trading decisions.
BullDozz Fibo ZigZagFibo ZigZag - Advanced Fibonacci Retracement Tool 🔥
📌 Overview
The Fibo ZigZag indicator is a powerful tool for trend structure analysis using the ZigZag pattern and Fibonacci retracement levels. It automatically identifies swing highs & lows, draws ZigZag lines, and overlays Fibonacci levels with price labels at the right end for better readability.
This indicator is designed for traders who use price action, trend reversal strategies, and support/resistance analysis.
🛠 Features
✅ Automatic ZigZag detection with customizable depth, deviation, and backstep
✅ Fibonacci retracement levels (0%, 23.6%, 38.2%, 50%, 61.8%, 100%, 161.8%, 261.8%, 423.6%)
✅ Price labels at Fibonacci levels (placed at the right end of the levels)
✅ Alerts for new swing highs & lows
✅ Customizable line colors, text colors, and label sizes
✅ Lightweight and optimized for fast performance
📊 How It Works
1️⃣ The script detects ZigZag structure points based on price swings
2️⃣ It connects recent highs & lows with a ZigZag line
3️⃣ Fibonacci retracement levels are calculated and drawn between the last two significant swing points
4️⃣ Each Fibo level is labeled with its percentage & exact price, placed at the right end for clarity
5️⃣ Alerts trigger automatically when a new swing high or low is detected
⚙ Customization Options
🔹 ZigZag Settings: Adjust Depth, Deviation, BackStep, and Leg length
🔹 Fibonacci Levels: Modify line colors, label text colors, and visibility
🔹 Alerts: Enable/disable trend change alerts
📈 Best Use Cases
🚀 Identifying Trend Reversals – Detect key turning points using Fibonacci levels
📉 Support & Resistance Trading – Use retracement levels as entry/exit points
📊 Swing Trading & Scalping – Combine ZigZag with price action for effective strategies
🔔 Alert-Based Trading – Get notified when new swing highs/lows form
🚀 How to Use
📌 Add the indicator to your chart
📌 Adjust the settings to match your trading strategy
📌 Use the Fibonacci levels & ZigZag lines to analyze trend direction & key price zones
📌 Wait for alerts or manually enter trades based on price reaction to Fibo levels
📢 Final Thoughts
The Fibo ZigZag is an essential tool for traders who rely on price action, trend reversals, and Fibonacci levels. Whether you're a beginner or a pro, this indicator helps you spot high-probability trading opportunities with ease.
⚡ Try it now & enhance your trading strategy! 🚀
💬 Let us know your feedback & suggestions in the comments! Happy trading! 📊🔥

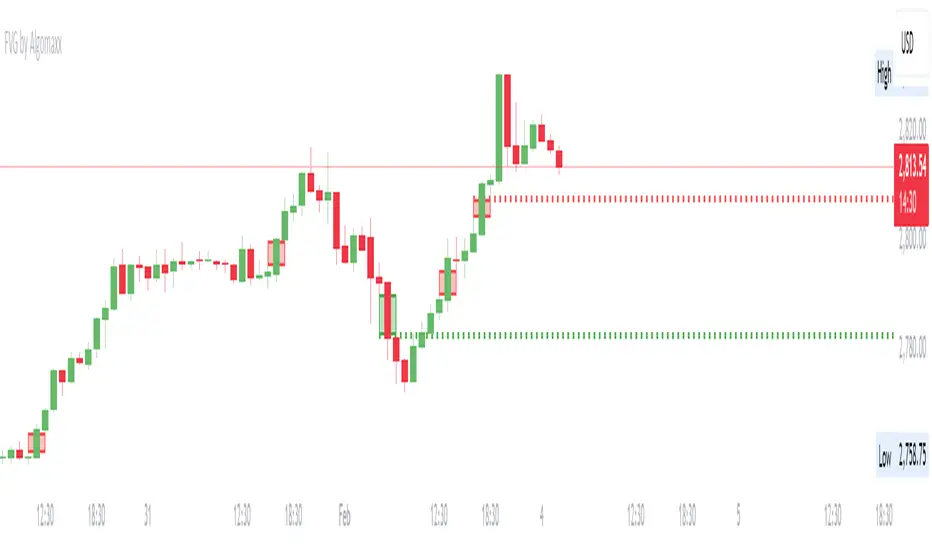
Fair Value Gap (FVG) by AlgoMaxxFair Value Gap (FVG) by AlgoMaxx
Advanced Fair Value Gap (FVG) detector with dynamic support/resistance lines. This professional-grade tool helps traders identify and track important market inefficiencies through Fair Value Gaps.
Features:
• Auto-detection of bullish and bearish FVGs
• Dynamic dotted extension lines for latest FVGs
• Smart gap filtering system
• Color-coded visualization
• Customizable parameters
• Clean, optimized code
Key Functions:
• Detects imbalance zones between candlesticks
• Marks FVGs with color-coded boxes
• Extends dotted lines for active reference levels
• Automatically updates with new gap formations
• Tracks gap fills in real-time
Inputs:
• Lookback Period: Historical gaps to display
• Minimum Gap Size %: Filter for gap significance
• Bullish/Bearish Colors: Visual customization
• Show Filled Gaps: Toggle filled gap visibility
Practical Applications:
1. Support/Resistance Levels
2. Mean Reversion Trading
3. Trend Continuation Setups
4. Market Structure Analysis
5. Price Action Trading
Usage Tips:
• Higher timeframes (1H+) provide more reliable signals
• Multiple FVGs in one zone indicate stronger levels
• Use in conjunction with other technical tools
• Monitor price reactions at FVG levels
• Consider gaps as zones rather than exact prices
Note: This is a premium-grade indicator designed for serious traders. Works best on higher timeframes where price inefficiencies are more significant.
═══════════════════
By Algomaxx
Version: 1.0
═══════════════════
Disclaimer:
This indicator is for informational purposes only. Trade at your own risk and always use proper risk management.
#FVG #technical #trading #algomaxx #premium
Gold Pro StrategyHere’s the strategy description in a chat format:
---
**Gold (XAU/USD) Trend-Following Strategy**
This **trend-following strategy** is designed for trading gold (XAU/USD) by combining moving averages, MACD momentum indicators, and RSI filters to capture sustained trends while managing volatility risks. The strategy uses volatility-adjusted stops to protect gains and prevent overexposure during erratic price movements. The aim is to take advantage of trending markets by confirming momentum and ensuring entries are not made at extreme levels.
---
**Key Components**
1. **Trend Identification**
- **50 vs 200 EMA Crossover**
- **Bullish Trend:** 50 EMA crosses above 200 EMA, and the price closes above the 200 EMA
- **Bearish Trend:** 50 EMA crosses below 200 EMA, and the price closes below the 200 EMA
2. **Momentum Confirmation**
- **MACD (12,26,9)**
- **Buy Signal:** MACD line crosses above the signal line
- **Sell Signal:** MACD line crosses below the signal line
- **RSI (14 Period)**
- **Bullish Zone:** RSI between 50-70 to avoid overbought conditions
- **Bearish Zone:** RSI between 30-50 to avoid oversold conditions
3. **Entry Criteria**
- **Long Entry:** Bullish trend, MACD bullish crossover, and RSI between 50-70
- **Short Entry:** Bearish trend, MACD bearish crossover, and RSI between 30-50
4. **Exit & Risk Management**
- **ATR Trailing Stops (14 Period):**
- Initial Stop: 3x ATR from entry price
- Trailing Stop: Adjusts to lock in profits as price moves favorably
- **Position Sizing:** 100% of equity per trade (high-risk strategy)
---
**Key Logic Flow**
1. **Trend Filter:** Use the 50/200 EMA relationship to define the market's direction
2. **Momentum Confirmation:** Confirm trend momentum with MACD crossovers
3. **RSI Validation:** Ensure RSI is within non-extreme ranges before entering trades
4. **Volatility-Based Risk Management:** Use ATR stops to manage market volatility
---
**Visual Cues**
- **Blue Line:** 50 EMA
- **Red Line:** 200 EMA
- **Green Triangles:** Long entry signals
- **Red Triangles:** Short entry signals
---
**Strengths**
- **Clear Trend Focus:** Avoids counter-trend trades
- **RSI Filter:** Prevents entering overbought or oversold conditions
- **ATR Stops:** Adapts to gold’s inherent volatility
- **Simple Rules:** Easy to follow with minimal inputs
---
**Weaknesses & Risks**
- **Infrequent Signals:** 50/200 EMA crossovers are rare
- **Potential Missed Opportunities:** Strict RSI criteria may miss some valid trends
- **Aggressive Position Sizing:** 100% equity allocation can lead to large drawdowns
- **No Profit Targets:** Relies on trailing stops rather than defined exit targets
---
**Performance Profile**
| Metric | Expected Range |
|----------------------|---------------------|
| Annual Trades | 4-8 |
| Win Rate | 55-65% |
| Max Drawdown | 25-35% |
| Profit Factor | 1.8-2.5 |
---
**Optimization Recommendations**
1. **Increase Trade Frequency**
Adjust the EMAs to shorter periods:
- `emaFastLen = input.int(30, "Fast EMA")`
- `emaSlowLen = input.int(150, "Slow EMA")`
2. **Relax RSI Filters**
Adjust the RSI range to:
- `rsiBullish = rsi > 45 and rsi < 75`
- `rsiBearish = rsi < 55 and rsi > 25`
3. **Add Profit Targets**
Introduce a profit target at 1.5% above entry:
```pine
strategy.exit("Long Exit", "Long",
stop=longStopPrice,
profit=close*1.015, // 1.5% target
trail_offset=trailOffset)
```
4. **Reduce Position Sizing**
Risk a smaller percentage per trade:
- `default_qty_value=25`
---
**Best Use Case**
This strategy excels in **strong trending markets** such as gold rallies during economic or geopolitical crises. However, during sideways or choppy market conditions, the strategy might require manual intervention to avoid false signals. Additionally, integrating fundamental analysis—like monitoring USD weakness or geopolitical risks—can enhance its effectiveness.
---
This strategy offers a balanced approach for trading gold, combining trend-following principles with risk management tailored to the volatility of the market.

Johnny's Machine Learning Moving Average (MLMA) w/ Trend Alerts📖 Overview
Johnny's Machine Learning Moving Average (MLMA) w/ Trend Alerts is a powerful adaptive moving average indicator designed to capture market trends dynamically. Unlike traditional moving averages (e.g., SMA, EMA, WMA), this indicator incorporates volatility-based trend detection, Bollinger Bands, ADX, and RSI, offering a comprehensive view of market conditions.
The MLMA is "machine learning-inspired" because it adapts dynamically to market conditions using ATR-based windowing and integrates multiple trend strength indicators (ADX, RSI, and volatility bands) to provide an intelligent moving average calculation that learns from recent price action rather than being static.
🛠 How It Works
1️⃣ Adaptive Moving Average Selection
The MLMA automatically selects one of four different moving averages:
📊 EMA (Exponential Moving Average) – Reacts quickly to price changes.
🔵 HMA (Hull Moving Average) – Smooth and fast, reducing lag.
🟡 WMA (Weighted Moving Average) – Gives recent prices more importance.
🔴 VWAP (Volume Weighted Average Price) – Accounts for volume impact.
The user can select which moving average type to use, making the indicator customizable based on their strategy.
2️⃣ Dynamic Trend Detection
ATR-Based Adaptive Window 📏
The Average True Range (ATR) determines the window size dynamically.
When volatility is high, the moving average window expands, making the MLMA more stable.
When volatility is low, the window shrinks, making the MLMA more responsive.
Trend Strength Filters 📊
ADX (Average Directional Index) > 25 → Indicates a strong trend.
RSI (Relative Strength Index) > 70 or < 30 → Identifies overbought/oversold conditions.
Price Position Relative to Upper/Lower Bands → Determines bullish vs. bearish momentum.
3️⃣ Volatility Bands & Dynamic Support/Resistance
Bollinger Bands (BB) 📉
Uses standard deviation-based bands around the MLMA to detect overbought and oversold zones.
Upper Band = Resistance, Lower Band = Support.
Helps traders identify breakout potential.
Adaptive Trend Bands 🔵🔴
The MLMA has built-in trend envelopes.
When price breaks the upper band, bullish momentum is confirmed.
When price breaks the lower band, bearish momentum is confirmed.
4️⃣ Visual Enhancements
Dynamic Gradient Fills 🌈
The trend strength (ADX-based) determines the gradient intensity.
Stronger trends = More vivid colors.
Weaker trends = Lighter colors.
Trend Reversal Arrows 🔄
🔼 Green Up Arrow: Bullish reversal signal.
🔽 Red Down Arrow: Bearish reversal signal.
Trend Table Overlay 🖥
Displays ADX, RSI, and Trend State dynamically on the chart.
📢 Trading Signals & How to Use It
1️⃣ Bullish Signals 📈
✅ Conditions for a Long (Buy) Trade:
The MLMA crosses above the lower band.
The ADX is above 25 (confirming trend strength).
RSI is above 55, indicating positive momentum.
Green trend reversal arrow appears (confirmation of a bullish reversal).
🔹 How to Trade It:
Enter a long trade when the MLMA turns bullish.
Set stop-loss below the lower Bollinger Band.
Target previous resistance levels or use the upper band as take-profit.
2️⃣ Bearish Signals 📉
✅ Conditions for a Short (Sell) Trade:
The MLMA crosses below the upper band.
The ADX is above 25 (confirming trend strength).
RSI is below 45, indicating bearish pressure.
Red trend reversal arrow appears (confirmation of a bearish reversal).
🔹 How to Trade It:
Enter a short trade when the MLMA turns bearish.
Set stop-loss above the upper Bollinger Band.
Target the lower band as take-profit.
💡 What Makes This a Machine Learning Moving Average?
📍 1️⃣ Adaptive & Self-Tuning
Unlike static moving averages that rely on fixed parameters, this MLMA automatically adjusts its sensitivity to market conditions using:
ATR-based dynamic windowing 📏 (Expands/contracts based on volatility).
Adaptive smoothing using EMA, HMA, WMA, or VWAP 📊.
Multi-indicator confirmation (ADX, RSI, Volatility Bands) 🏆.
📍 2️⃣ Intelligent Trend Confirmation
The MLMA "learns" from recent price movements instead of blindly following a fixed-length average.
It incorporates ADX & RSI trend filtering to reduce noise & false signals.
📍 3️⃣ Dynamic Color-Coding for Trend Strength
Strong trends trigger more vivid colors, mimicking confidence levels in machine learning models.
Weaker trends appear faded, suggesting uncertainty.
🎯 Why Use the MLMA?
✅ Pros
✔ Combines multiple trend indicators (MA, ADX, RSI, BB).
✔ Automatically adjusts to market conditions.
✔ Filters out weak trends, making it more reliable.
✔ Visually intuitive (gradient colors & reversal arrows).
✔ Works across all timeframes and assets.
⚠️ Cons
❌ Not a standalone strategy → Best used with volume confirmation or candlestick analysis.
❌ Can lag slightly in fast-moving markets (due to smoothing).

Percent Change HistogramThis indicator shows you percent changes in a super visual way using a color-coded histogram.
Here's how the colors work:
🟩 Dark green = percent change is growing stronger
🟢 Light green = still positive but losing steam
🟥 Dark red = getting more negative
🔴 Light red = negative but improving
The cool part? You can set any lookback period you want. For example:
24 periods on 1H chart = last 24 hours
30 periods on daily = last month
7 periods on daily = last week
Pro tip: You're not locked to your chart's timeframe! Want to see monthly changes while trading on 5min?
No problem.
You can even stack multiple indicators to watch different intervals simultaneously (daily, weekly, monthly) - super helpful for multi-timeframe analysis.
Perfect for spotting momentum shifts across different timeframes without switching between charts.

PlanDeFi: Adaptive Trend Ribbons [ATR+RSI]#### **Overview**
The **Crypto Half-Trend Pro ** is a trend-following indicator designed to identify bullish and bearish market conditions using a combination of **moving averages, volatility adjustments, and dynamic ATR bands**. This enhanced version improves on the traditional Half-Trend system by incorporating **EMA smoothing, volatility-based adjustments, and additional fakeout/reversal detection mechanisms**.
#### **Key Features**
✅ **Trend Detection:**
- Uses a combination of fast and slow moving averages (EMA/SMA) to determine trend direction.
- Implements **Hull Moving Average (HMA)** smoothing for better trend visualization.
✅ **Dynamic ATR Bands:**
- Adjusts bands based on market volatility using **RSI-based ATR multipliers**.
- Helps identify potential **breakouts and trend reversals**.
✅ **Fakeout & Reversal Detection:**
- Detects potential **fake breakouts** by analyzing price action against extended ATR bands.
- Identifies **early reversal signals** using price crossovers and volume confirmation.
✅ **Customizable Alerts & Visuals:**
- Built-in **buy & sell signals** for trend confirmation.
- Color-coded bullish/bearish trend lines and **fakeout warnings**.
- **TradingView alerts** for trend shifts and reversals.
#### **How It Works**
🔹 The indicator calculates a **smoothed trend line** using a Hull Moving Average on dynamic price levels.
🔹 ATR bands expand/contract dynamically based on **market volatility** to improve signal accuracy.
🔹 Trend direction is confirmed when price crosses the trend line **with volume confirmation**.
🔹 **Fakeouts** are detected when price temporarily exceeds extended bands but fails to hold momentum.
🔹 **Reversal signals** are generated when price breaks back into the ATR zone with volume spikes.
#### **How to Use It**
- 📈 **Buy Signal:** When price breaks above the trend line, confirmed by volume and crossover signals.
- 📉 **Sell Signal:** When price breaks below the trend line with confirmed bearish conditions.
- 🚨 **Reversal Warning:** If price sharply re-enters the ATR zone with volume confirmation, expect a potential trend shift.
- 🛑 **Fakeout Alert:** If price temporarily breaks resistance but closes back inside, it may be a false move.
#### **Ideal For**
✔️ Crypto & Forex traders looking for **dynamic trend signals**
✔️ Swing traders wanting to **avoid fakeouts & catch reversals**
✔️ Traders seeking a **customizable, volatility-adjusted trend system**
🚀 **Try PlanDeFi: Adaptive Trend Ribbons today and improve your trend analysis!**
