ACW PROACW PRO
ACW PIVOT SHORT SCRIPT + ACW CUSTOM MA SCRIPT
PROFITABLE TIMEFRAMES
15MIN
30MIN
H1-H4
D1,W1
Buscar en scripts para "pro"

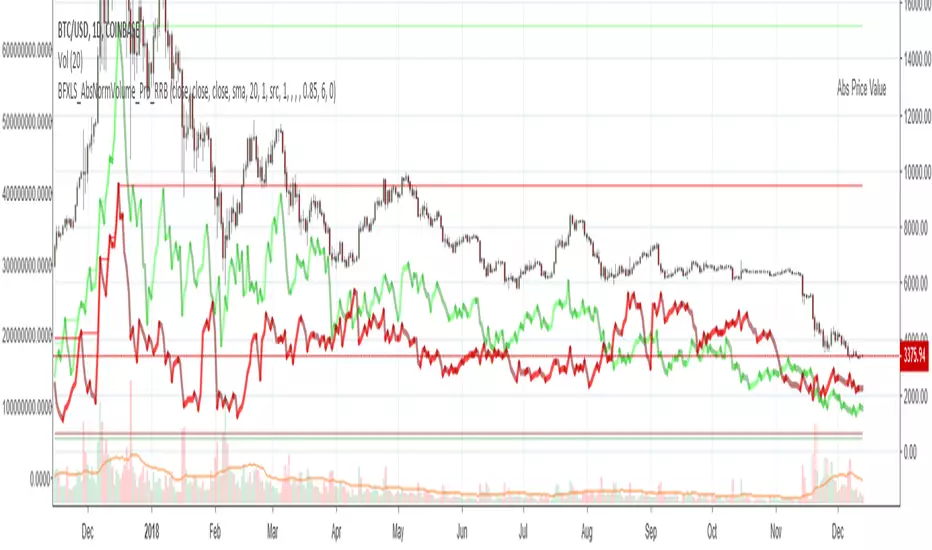
Chiki-Poki BFXLS Longs Shorts Abs Normalized Volume Pro by RRBChiki-Poki BFXLS Longs vs Shorts Absolute Normalized Volume Value Pro by RagingRocketBull 2018
Version 1.0
This indicator displays Longs vs Shorts in a side by side graph, shows volume's absolute price value and normalized volume of Longs/Shorts for the current asset. This allows for more accurate L/S comparisons (like a log scale for volume) since volume on spot exchanges (Bitstamp, Bitfinex, Coinbase etc) is measured in coins traded, not USD traded. Similarly, L/S is usually the amount of coins in open L/S positions, not their total USD value. On Bitmex and other futures exchanges volume is measured in USD traded, so you don't need to apply the Volume Absolute Price Value checkbox to compare L/S. You should always check first whether your source is measured in coins or USD.
Chiki-Poki BFXLS primarily uses *SHORTS/LONGS feeds from Bitfinex for the current crypto asset, but you can specify custom L/S source tickers instead.
This 2-in-1 works both in the Main Chart and in the indicator pane below. You can switch between Main/Sub Window panes using RMB on the indicator's name and selecting Move To/Pane Above/Below.
This indicator doesn't use volume of the current asset. It uses L/S ticker's OHLC as a source for SHORTS/LONGS volumes instead. Essentially L/S => L/S Volume == L/S
Features:
- Display Longs vs Shorts side by side graph for the current crypto asset, i.e. for BTCUSD - BTCUSDLONGS/BTCUSDSHORTS, for ETHUSD - ETHUSDLONGS/ETHUSDSHORTS etc.
- Use custom OHLC ticker sources for Longs/Shorts from different exchanges/crypto assets with/without exchange prefix.
- Plot Longs/Shorts as lines or candles
- Show/Hide L/S, Diff, MAs, ATH/ATL
- Use Longs/Shorts Volume Absolute Price Value (Price * L/S Volume) instead of Coins Traded in open L/S positions to compare total L/S value/capitalization
- Normalize L/S Volume using Price / Price MA / L/S Volume MA
- Supports any existing type of MA: SMA, EMA, WMA, HMA etc
- Volume Absolute Price Value / Normalize also works on candles
- Oscillator mode with negative axis (works in both Main Chart/Subwindow panes).
- Highlight L/S Volume spikes above L/S MAs in both lines/oscillator.
- Change L/S MA color based on a number of last rising/falling L/S bars, colorize candles
- Display L/S volume as 1000s, mlns, or blns using alpha multiplier
1. based on BFXLS Longs vs Shorts and Compare Style, uses plot*, security and custom hma functions
2. swma has a fixed length = 4, alma and linreg have additional offset and smoothing params
Notes:
- Make sure that Left Price Scale shows up with Auto Fit Data enabled. You can reattach indicator to a different scale in Style.
- It is not recommended to switch modes multiple times due to TradingView's scale reattachment bugs. You should switch between Main Chart and Sub Window only once.
- When the USD price of an asset is lower you can trade more coins but capitalization value won't be as significant as when there are less coins for a higher price. Same goes for Shorts/Longs.
Current ATH in shorts doesn't trigger a squeeze because its total value is now far less than before and we are in a bear market where it's normal to have a higher number of shorts.
- You should always subtract Hedged L/S from L/S because hedged positions are temporary - used to preserve the value of the main position in the opposite direction and should be disregarded as such.
- Low margin rates increase the probability of a move in an underlying direction because it is cheaper. High margin rates => the market is anticipating a move in this direction, thus a more expensive rate. Sudden 5-10x rate raises imply a possible reversal soon. high - 0.1%, avg - 0.01-0.02%, low - 0.001-0.005%
You can also check out:
- BFXLS Longs/Shorts on BFXData
- Bitfinex L/S margin rates and Hedged L/S on datamish
- Bitmex L/S on Coinfarm.online
Bars In a Row Counter Pro by RRBBars In a Row Counter Pro by RagingRocketBull 2018
Version 1.0
This indicator counts bars of the same color in a sequence (dojis included) and plots the resulting counts as histogram bars
1. based on barssince, uses plot function with histogram style
2. Min/Max Threshold is the upper and lower limits for counting bars. For example, you can look only for sequences of 5 to 10 bars of the same color in a row
3. Show Histogram Beyond Threshold - you can hide/change color of the non-important histogram part that exceeds the threshold
4. Show Threshold Bands - show the upper and lower limits as levels on the indicator
5. Show Min/Max Bands - show ATH max red/green bars in a row historic levels on the indicator
6. Count Red Bars - count red bars in a sequence, show/hide red bars on a histogram (you can exclude red bars and count only green bars)
7. Count Green Bars - count green bars in a sequence, show/hide green bars on a histogram (you can exclude green bars and count only red bars)
8. Invert Red Bars - show red and green histograms together on the same axis above zero (saves space)
Feel free to use. Good Luck!

Williams' Pro-GoNo idea what I am doing here. Trying to Program Williams Pro-Go as an indicator. Not familiar with Pine at all.

Pro Volume & Momentum Dashboard [CONFIRMED ENTRY v2.1]🎯 Key Upgrades in This Version:
1. 10-Point Confluence Scoring System
# Factor Description
1 Volume Spike RVOL ≥ threshold with directional candle
2 Volume Delta Buy vs Sell pressure analysis
3 VWAP Position Institutional fair value
4 200 EMA Macro trend alignment
5 EMA Stack 9 > 21 > 50 alignment
6 ADX Trend strength + direction
7 RSI Momentum confirmation
8 MACD Histogram momentum
9 HTF Trend Higher timeframe alignment
10 Candle Quality Strong body, minimal wicks
2. Confirmed Entry Logic
✅ Requires minimum 7/10 confluence score (adjustable)
✅ Waits for candle close to avoid fakeouts
✅ 5-bar cooldown prevents duplicate signals
✅ Potential setups warned when score is 5-6/10
3. Risk Management
Auto-calculated Stop Loss (ATR-based)
Two Take Profit levels (TP1 & TP2)
Visual risk zones on chart
Risk/Reward ratio displayed
4. Higher Timeframe Confirmation
Checks 1H (or custom) timeframe trend
Ensures trade aligns with bigger picture
📌 How to Use:
Wait for ◆ CONFIRMED BUY/SELL label (not triangles)
Check dashboard for 7+/10 score
Entry: On signal candle close
Stop Loss: Red line below/above
Take Profit: Green lines (scale out at TP1, full exit TP2)
🕯️ Candlestick Patterns Added
Bullish Patterns (11 Total)
Pattern Description Strength
Bullish Engulfing Green candle engulfs prior red ⭐⭐⭐ Strong
Hammer Long lower wick at bottom ⭐⭐ Medium
Morning Star 3-candle reversal pattern ⭐⭐⭐ Strong
Bullish Harami Small green inside large red ⭐⭐ Medium
Piercing Line Opens gap down, closes above mid ⭐⭐ Medium
Three White Soldiers 3 consecutive strong green candles ⭐⭐⭐ Strong
Dragonfly Doji Long lower wick, no body ⭐⭐ Medium
Tweezer Bottom Equal lows at support ⭐⭐ Medium
Bullish Marubozu Full body, no wicks ⭐⭐⭐ Strong
Rising Three Continuation after pullback ⭐⭐ Medium
Bearish Patterns (11 Total)
Pattern Description Strength
Bearish Engulfing Red candle engulfs prior green ⭐⭐⭐ Strong
Shooting Star Long upper wick at top ⭐⭐ Medium
Evening Star 3-candle reversal pattern ⭐⭐⭐ Strong
Bearish Harami Small red inside large green ⭐⭐ Medium
Dark Cloud Cover Opens gap up, closes below mid ⭐⭐ Medium
Three Black Crows 3 consecutive strong red candles ⭐⭐⭐ Strong
Gravestone Doji Long upper wick, no body ⭐⭐ Medium
Tweezer Top Equal highs at resistance ⭐⭐ Medium
Bearish Marubozu Full body, no wicks ⭐⭐⭐ Strong
Falling Three Continuation after pullback ⭐⭐ Medium
Hanging Man Long lower wick at top ⭐⭐ Medium


Pro Structure: Precision MSS/BOS & Extended FVG1. Precision Structure Mapping (BOS & MSS) Unlike standard ZigZag indicators that just connect pivots, this script visualizes the exact "Break" point:
MSS (Market Structure Shift): Displayed as a Thick Solid Line. This signals a potential trend reversal (e.g., breaking a Lower High in a downtrend).
BOS (Break of Structure): Displayed as a Thin Dashed Line. This signals trend continuation in the current direction.
Visual Logic: The lines originate exactly from the Swing Pivot and terminate exactly at the candle that closes beyond that pivot, providing instant visual confirmation of the break.
2. Trend-Filtered Fair Value Gaps (FVG) To reduce "Analysis Paralysis," this indicator uses an active trend filter:
Bullish Trend: Only Bullish FVGs (Green) are highlighted. Bearish FVGs are hidden to prevent counter-trend confusion.
Bearish Trend: Only Bearish FVGs (Red) are highlighted.
Extended Zones: FVG boxes are automatically projected forward (default: 5 candles) to help identify immediate entry zones before price returns to them.
3. Clean Aesthetics The chart remains minimal. Labels are non-intrusive, and color coding is strictly defined (Green for Bullish structure/FVGs, Red for Bearish structure/FVGs), allowing for rapid decision-making.
Settings
Swing Detection Length: Customize the sensitivity of the structure (lower for scalping, higher for macro trends).
FVG Extension: Control how far into the future the FVG boxes are drawn.
Visuals: Fully customizable colors and label options.
This tool is intended to assist in identifying high-probability structural points and aligned entry zones.

Pro-Vision ATR + ExhaustionThis indicator is designed to provide Real-Time Volatility Guardrails. Unlike standard ATR indicators that plot a single line at the bottom of your chart, this tool projects volatility "shells" directly onto the price action from the current candle.
It answers the most critical question in a live trade: "How far can this stock move right now before it is statistically exhausted?"
The Components
Current ATR Centerpiece: The lines originate from the most recent price action, updating live with every tick.
Target Lines (1.5x ATR - Yellow): These represent the "Normal Expected Move." In a healthy trend, price often reaches these levels without much resistance.
Exhaustion Lines (3.0x ATR - Red): These represent "Extreme Volatility." Statistically, it is rare for price to sustain a move beyond 3x its average range in a single period without a pullback or consolidation.
How to Trade It
1. Profit Taking (The "Target" Exit)
If you are in a long position and price hits the Yellow Upper Line, it has achieved its expected volatility move for that timeframe.
Strategy: Scale out 50% of your position here. This locks in gains based on math rather than emotion.
2. Reversal Trading (The "Exhaustion" Play)
When price pierces or touches the Red Exhaustion Line, the asset is "overbought" or "oversold" relative to its recent volatility.
Strategy: Look for a reversal candle (like a shooting star or hammer) touching the red line.
The Trade: Short the asset at the red line with a tight stop, or close your long position immediately. These levels often act as "invisible" ceilings.
3. Setting "Smart" Stop Losses
Standard stops are often placed at arbitrary percentages. Using this indicator, you can place your stop just outside the 1.5x ATR line.
Strategy: If you enter a trade and price moves past the opposite ATR line, the volatility has shifted against you, and the original trade thesis is likely invalid.
4. Filtering Bad Entries (The "Don't Chase" Rule)
Strategy: If you are looking to go Long, but the price is already sitting at the Yellow Line, the "meat of the move" is likely over.
Rule: Never enter a new position if the price is already 75% of the way to the Red Exhaustion line. Wait for a mean reversion back to the middle.

Pro Minimalist ATR (Black)The script I provided is a tool that automatically calculates and displays volatility "zones" around the average price. Here is the plain English explanation of what it is doing and why:
1. The Anchor: 20 DMA (The "Fair Value")
The script starts by calculating the 20-Day Moving Average (20 DMA).
What it represents: Think of this as the "fair price" or the "center of gravity" for the market over the last month.
In the script: It looks at the closing price of the last 20 candles, adds them up, and divides by 20. This is your baseline.
2. The Ruler: ATR (The "Volatility")
Next, it measures the Average True Range (ATR) over the last 14 days.
What it represents: This measures the "energy" or "noise" of the market. If candles are huge, the ATR is high. If candles are tiny, the ATR is low.
Why we use it: Using a fixed number (like $50) doesn't work because stocks move differently. ATR adapts to the current market mood.
3. The Zones: +1, +2, -1, -2
The script then takes that "center" (20 DMA) and adds/subtracts the "ruler" (ATR) to create four distinct levels:
+1 ATR: This is the "Upper Normal" limit. Price hanging here is bullish but normal.
+2 ATR: This is the "Extreme" limit. Statistically, price rarely stays above this line for long without snapping back. This is often an overbought signal.
-1 ATR: This is the "Lower Normal" limit.
-2 ATR: This is the "Extreme" discount. If price hits this, it is statistically stretched far below its average.
4. The Visuals: "Clean" Labeling
Finally, the script focuses on presentation:
No Lines: It specifically avoids drawing lines all over your history to keep your chart clean.
Dynamic Labels: It creates text labels only on the very last bar (the current moment). It constantly deletes the old label and draws a new one as the price moves, so it looks like the text is "floating" next to the current price.
Axis Marking: It forces marks onto the right-hand price scale (display=display.price_scale) so you can see the exact price levels (e.g., 154.20) without having to guess.

Pro Volume Lite positionsThis is another update to the Positions indicator, which gives 3 SQ , so that you can have a dynamic sizing.
This way you will be able to scale in MB

Smart Money Swing Strategy [All-in-One]# Pro Swing Trader 📈
A comprehensive swing trading indicator for TradingView that combines multiple confluence factors to identify high-probability trade setups with built-in risk management.
## 🎯 Overview
This indicator is designed for swing traders who want to catch momentum pullbacks with precision entries. It filters trades using multiple timeframe analysis, RSI zones, volume confirmation, and EMA trends to deliver only the highest-confidence setups.
### Key Features
✅ **Multi-Timeframe Confluence** - Confirms trades with higher timeframe analysis (Daily, 4H, etc.)
✅ **Smart Entry Signals** - Detects pullback-to-EMA reclaim patterns
✅ **Automatic Risk Management** - Calculates stops, targets, and R-multiples
✅ **Dynamic Stop Loss** - ATR trailing stop + break-even automation
✅ **Real-Time HUD Dashboard** - Live confluence scoring and trade metrics
✅ **Comprehensive Alerts** - Entry, TP1, TP2, and stop-loss notifications
✅ **Visual Trade Levels** - Clear on-chart stop-loss and take-profit lines
---
## 📊 How It Works
### Signal Logic
The indicator identifies two types of signals:
**Base Signals** (Small triangles):
- Price pulls back between Fast EMA and Slow EMA
- RSI is in the swing zone (40-60 by default)
- Price reclaims the Fast EMA with momentum
- Optional: Volume spike confirmation
**High-Confidence Signals** (Large triangles):
- All base signal criteria met
- Higher timeframe confirms the trend direction
- HTF RSI and slope alignment
- These are your primary trade signals
### Entry Conditions
#### Long Entry (🟢 HC L)
1. Fast EMA > Slow EMA (uptrend)
2. Previous candle closed between the EMAs (pullback)
3. Current candle crosses above and closes above Fast EMA (reclaim)
4. RSI between 40-60 (swing zone)
5. **HTF Confirmation**: Daily/4H price above EMA50, RSI > 50, positive slope
6. Optional: Volume > 1.5x 20-bar average
#### Short Entry (🔻 HC S)
1. Fast EMA < Slow EMA (downtrend)
2. Previous candle closed between the EMAs (pullback)
3. Current candle crosses below and closes below Fast EMA (reclaim)
4. RSI between 40-60 (swing zone)
5. **HTF Confirmation**: Daily/4H price below EMA50, RSI < 50, negative slope
6. Optional: Volume > 1.5x 20-bar average
---
## 🎛️ Settings & Parameters
### Trend Parameters
- **Fast EMA**: Default 20 - Quick trend detection
- **Slow EMA**: Default 50 - Major trend filter
- **Swing Lookback**: Default 10 - Bars to find swing high/low for stops
### RSI Settings
- **RSI Length**: Default 14
- **RSI Min**: Default 40 - Lower bound of swing zone
- **RSI Max**: Default 60 - Upper bound of swing zone
### Risk Management
- **Final TP Risk-Reward (R)**: Default 2.0 - Main profit target multiplier
- **TP1 R Multiple**: Default 1.0 - Partial profit target
- **Use Break-even Stop**: Move stop to entry after 1R profit
- **ATR Trailing Stop**: Dynamic stop based on ATR(14) x 2.0
### Filters
- **Require Volume Spike**: Optional volume confirmation filter
- **Use Higher TF Confirmation**: Enable multi-timeframe analysis
- **Higher TF**: Default "D" (Daily) - Can use 240 (4H), W (Weekly), etc.
---
## 📈 Dashboard (HUD)
The top-center dashboard shows real-time confluence status:
| Column | Meaning |
|--------|---------|
| **Trend** | Current trend direction (UP/DOWN/Flat) |
| **HTF** | Higher timeframe alignment (Bull/Bear/Flat) |
| **RSI Zone** | Is RSI in swing zone? (YES/NO) |
| **Volume** | Volume spike detected? (YES/NO) |
| **Signal** | Active signal type (HC LONG/HC SHORT/None) |
| **R Risk** | Current profit in R-multiples |
| **Stop** | Current stop-loss level |
| **TP1** | Partial take-profit status |
| **TP2** | Final take-profit status |
| **Conf %** | Overall confluence score (0-100%) |
### Confidence Score Breakdown
- **20%** - Trend present (up or down)
- **30%** - HTF confirmation aligned (or 15% if HTF off)
- **20%** - RSI in swing zone
- **10%** - Volume spike
- **20%** - High-confidence signal triggered
**Scoring**:
- 🟢 70%+ = High probability setup
- 🟡 40-69% = Moderate setup
- 🔴 <40% = Low probability
---
## 🔔 Alert Setup
The indicator includes 8 alert conditions:
### Entry Alerts
- **HC LONG ENTRY** - High-confidence long signal triggered
- **HC SHORT ENTRY** - High-confidence short signal triggered
### Profit Target Alerts
- **LONG TP1 Reached** - Hit partial profit (1R by default)
- **LONG Final TP Reached** - Hit final target (2R by default)
- **SHORT TP1 Reached** - Hit partial profit
- **SHORT Final TP Reached** - Hit final target
### Stop Loss Alerts
- **LONG Stop/BE/Trail Level Hit** - Long position stopped out
- **SHORT Stop/BE/Trail Level Hit** - Short position stopped out
### How to Set Up Alerts
1. Click "Add Alert" on TradingView
2. Choose this indicator from the dropdown
3. Select desired alert condition
4. Set alert to trigger "Once Per Bar Close"
5. Customize notification method (popup/email/webhook)
---
## 📋 Trading Workflow
### 1. Wait for High-Confidence Signal
Look for the large **HC L** or **HC S** triangle on chart close.
### 2. Verify Confluence
Check the HUD dashboard:
- Confidence score should be 70%+
- HTF status should show alignment
- RSI Zone should be "YES"
### 3. Entry
Enter the trade at market or on next candle open.
### 4. Set Stop Loss
Use the **initial stop** shown in the HUD (red line on chart):
- **Longs**: Below the swing low (10-bar lookback)
- **Shorts**: Above the swing high (10-bar lookback)
### 5. Set Take Profits
- **TP1**: 1R (50% position close) - Yellow line
- **TP2**: 2R (remaining 50% close) - Green line
### 6. Manage the Trade
- Monitor the **R Risk** column to track profit
- Stop moves to break-even automatically after 1R (if enabled)
- ATR trailing stop engages dynamically (red line adjusts)
- Exit if price hits dynamic stop level
---
## 🎨 Visual Guide
### On-Chart Elements
**Triangles**:
- Small lime/red triangles = Base signals (lower confidence)
- Large lime/red triangles = High-confidence signals (trade these!)
**Lines**:
- 🟢 Green line = Fast EMA (20)
- 🟠 Orange line = Slow EMA (50)
- 🔴 Red line = Dynamic stop-loss level
- 🟡 Yellow line = TP1 level
- 🟢 Green line = TP2 (final target)
**HUD Colors**:
- 🟢 Green = Bullish/Active/Good
- 🔴 Red = Bearish/Inactive/Warning
- 🟡 Yellow = Neutral/Caution
- 🔵 Blue = Informational
- ⚫ Gray = Disabled/Off
---
## 💡 Strategy Tips
### Best Practices
1. **Only trade High-Confidence signals** - Ignore base signals unless very experienced
2. **Respect the HTF** - Don't fight the higher timeframe trend
3. **Use proper position sizing** - Risk 1-2% of account per trade
4. **Partial profits work** - Take 50% off at TP1, let rest run to TP2
5. **Let winners run** - Trailing stop helps capture extended moves
6. **Be patient** - Quality over quantity; wait for 70%+ confluence
### Optimal Timeframes
- **Primary Chart**: 1H, 4H, Daily (swing trading)
- **HTF Setting**: One level higher than your chart
- If trading 1H → Set HTF to 4H or D
- If trading 4H → Set HTF to D or W
- If trading Daily → Set HTF to W
### Market Conditions
**Best Performance**:
- Trending markets with healthy pullbacks
- Clear support/resistance zones
- Moderate volatility
**Avoid Trading**:
- Extremely choppy/sideways markets
- Major news events (unless experienced)
- Low confidence scores (<40%)
---
## ⚙️ Advanced Customization
### Aggressive Setup (More Signals)
```
Fast EMA: 12
Slow EMA: 26
RSI Min: 35
RSI Max: 65
Use HTF Confirmation: OFF
Require Volume Spike: OFF
```
### Conservative Setup (Fewer, Higher Quality)
```
Fast EMA: 20
Slow EMA: 50
RSI Min: 45
RSI Max: 55
Use HTF Confirmation: ON
Require Volume Spike: ON
Final TP R: 3.0
```
### Scalping Adaptation (Not Recommended)
```
Fast EMA: 9
Slow EMA: 21
Swing Lookback: 5
TP1 R: 0.5
Final TP R: 1.0
```
---
## ⚠️ Risk Disclaimer
**IMPORTANT**: This indicator is for educational and informational purposes only.
- Past performance does not guarantee future results
- No indicator is 100% accurate
- Always use proper risk management
- Never risk more than you can afford to lose
- Consider using a demo account first
- Seek professional financial advice if needed
Trading involves substantial risk of loss and is not suitable for all investors.
---
## 🔧 Troubleshooting
### "No signals appearing"
- Check if HTF confirmation is enabled but market isn't aligned
- Verify RSI zone isn't too restrictive
- Ensure volume spike isn't filtering out all setups
- Try adjusting EMA lengths for your asset
### "Too many false signals"
- Enable HTF confirmation
- Tighten RSI zone (e.g., 45-55)
- Enable volume spike requirement
- Only trade 70%+ confidence setups
### "Stops too tight/wide"
- Adjust Swing Lookback length
- Modify ATR multiplier for trailing stop
- Consider the asset's volatility
### "Alerts not working"
- Ensure alert is set to "Once Per Bar Close"
- Check indicator is added to the chart
- Verify TradingView notification settings
---
## 📚 Version History
**v1.0 (Current)**
- Initial release
- Multi-timeframe confluence system
- Dynamic risk management
- Real-time HUD dashboard
- Comprehensive alert system
- ATR trailing stops
- Break-even automation
---
## 🤝 Support & Feedback
If you find this indicator helpful:
- ⭐ Star the script on TradingView
- 💬 Share your results and feedback
- 🐛 Report bugs or suggest improvements
- 📖 Share with other traders
---
## 📖 Additional Resources
### Recommended Reading
- "The New Trading for a Living" by Dr. Alexander Elder
- "Swing Trading Using Multiple Timeframes" - Educational articles
- Risk management and position sizing guides
### Learn More About
- Multiple timeframe analysis
- EMA crossover strategies
- RSI divergence and zones
- ATR-based stops
- R-multiple profit management
---
## 📝 License
This indicator is provided as-is for personal trading use.
**Usage Rights**:
- ✅ Use for personal trading
- ✅ Modify for personal use
- ❌ Resell or redistribute
- ❌ Claim as original work
---
## 🎓 Quick Start Checklist
- Add indicator to TradingView chart
- Set your preferred timeframe (1H/4H/Daily)
- Configure HTF setting (one level higher)
- Review default parameters
- Set up entry alerts (HC LONG/SHORT)
- Set up TP and SL alerts
- Test on historical data
- Paper trade first
- Start with small position sizes
- Track your results
---
**Happy Trading! 📊💰**
*Remember: Discipline, patience, and risk management are the keys to long-term success.*

PRO Triple+ Confirmation Overlay SignalsThis script uses the 200 SMA + RSI + MACD confirmations as buy and sell signals. It only give a signal if all three line up. works well for general market direction signals. It also has a higher time frame filter that will filter out 70%-90% of traps and counter trend signals. MACD momentum trigger times entries with momentum shifts. RSI confirmation as well as volume confirmation to remove entries in low volume dead markets.

PRO Live ATR Engine – 1H ATR(1) & ATR(5) for Lower Timeframes✔ Accurate Live ATR(1)
Uses true range formula, not just high-low.
✔ Accurate Live ATR(5)
Rolling ATR that increases/decreases continuously as the hour forms.
✔ Works in Replay on 1m/5m
Does not rely on 1-hour candle closes.
✔ Only flags inside 09:20–09:25
No more random background outside your window.
✔ Correct “Do Not Trade” logic
If price is between midnight and 8:30, background turns red.

Pro: Big Candle Pip Range (Upper Label)Highlights unusually large candles by calculating pip ranges dynamically based on recent volatility. Shows exact pip count above the candle, color-coded by direction (green bullish, red bearish). Features adaptive thresholds, optional histogram, and works on any instrument or timeframe. Ideal for scalpers and intraday traders spotting high-volatility candles quickly.

Pro Trading Signals - Trend + S/R + Risk// ============================================
// PROFESSIONAL TRADING STRATEGY NOTES
// ============================================
// === WHAT THIS STRATEGY DOES ===
// 1. TREND ANALYSIS: Uses multiple EMAs (9, 21, 50, 200) to identify trend direction
// 2. SUPPORT/RESISTANCE: Automatically detects key price levels
// 3. RISK MANAGEMENT: Calculates stop loss and take profit with 2:1+ R:R ratio
// 4. SIGNAL SCORING: Only trades high-quality setups (60/100+ score)
// 5. ENTRY TYPES: Pullbacks, support/resistance bounces, breakouts
// === KEY IMPROVEMENTS FROM BASIC SIGNALS ===
// ✓ Trend alignment required (no counter-trend trades)
// ✓ Support/resistance confirmation
// ✓ Volume and momentum filters
// ✓ Automatic stop loss and take profit levels
// ✓ Signal quality scoring (filters out weak signals)
// ✓ Risk:Reward ratio enforcement (minimum 2:1)
// ✓ Volatility filter (avoids choppy markets)


Pro Market Toolkit (TH) v2.4 — S/R + Zones + ATR Bands + Alertsรายละเอียด (ภาษาไทย):
อินดิเคเตอร์ชุดเครื่องมือครบวงจรสำหรับนักเทรด
คำนวณ แนวรับ–แนวต้าน (Support / Resistance) อัตโนมัติจากสวิง (Pivot High/Low)
สร้าง Supply/Demand Zones จาก ATR เพื่อหาพื้นที่กลับตัวสำคัญ
วาดเส้น Moving Average และ ATR Bands เพื่อประเมินแนวโน้มและความผันผวน
แสดงสัญญาณ Breakout และ Bounce/Reject อย่างชัดเจนบนกราฟ
รองรับ Alerts สำหรับ 4 เงื่อนไขสำคัญ: Breakout ขึ้น/ลง, Demand Bounce, Supply Reject
มีตารางแสดง Trend และค่า ATR ปัจจุบัน
เหมาะสำหรับผู้ที่ต้องการดูแนวโน้ม, หาจุดเข้า/ออก และรับการแจ้งเตือนอัตโนมัติ โดยไม่ต้องเฝ้ากราฟตลอดเวลา
Description (English):
A comprehensive trading toolkit indicator for professional traders.
Automatically detects Support/Resistance levels using swing pivots
Generates Supply/Demand Zones based on ATR to highlight potential reversal areas
Plots Moving Average and ATR Bands for trend and volatility analysis
Displays clear signal markers for Breakouts and Zone Bounces/Rejects
Provides Alerts for 4 key conditions: Breakout Up/Down, Demand Bounce, Supply Reject
Includes an on-chart table showing the current Trend and ATR value
Ideal for traders who want automatic key levels, zones, and signal alerts without the need to monitor the chart constantly.

Pro Trading Art - Head And ShouldersHow the Script Works:
1. The script identifies potential Head and Shoulders patterns by searching for specific pivot highs and pivot lows in the price data.
2. It checks for the presence of a left shoulder, head, and right shoulder based on the conditions defined in the script.
3. If a valid Head and Shoulders pattern is found, the script plots lines and labels on the chart to visualize the pattern.
4. The script also identifies Inverted Head and Shoulders patterns using similar logic but with different conditions.
5. It plots lines and labels for the Inverted Head and Shoulders pattern.
6. The script generates short and long conditions based on the patterns. Short conditions trigger when the close price crosses below the neck level of a Head and Shoulders pattern, while long conditions trigger when the close price crosses above the neck level of an Inverted Head and Shoulders pattern.
7. It plots sell and buy signal shapes on the chart when the short and long conditions are met, respectively.
8. The script can also trigger alerts to notify the user when a valid Head and Shoulders or Inverted Head and Shoulders pattern is detected.
9. The script provides visual cues on the chart to help users identify potential trading opportunities.
10. The logic and parameters of the script can be modified by the user to customize the behavior and adapt it to different trading strategies.
How Users Can Make Profit Using This Script:
1. Identify potential short-selling opportunities: When a valid Head and Shoulders pattern is detected and a short condition is met, it indicates a potential trend reversal. Traders can consider opening short positions to profit from a downward price movement.
2. Identify potential long-buying opportunities: When a valid Inverted Head and Shoulders pattern is detected and a long condition is met, it suggests a potential trend reversal. Traders can consider opening long positions to profit from an upward price movement.
3. Combine with additional analysis: Users can utilize this script as a tool in their overall trading strategy. They can combine the signals generated by the script with other technical indicators, fundamental analysis, or market sentiment to make more informed trading decisions.
4. Define appropriate entry and exit points: Traders can use the lines and labels plotted by the script to determine entry and exit points for their trades. For example, they may choose to enter a short position after the price crosses below the neck level and exit when the price reaches a predetermined target or when the pattern is invalidated.
5. Set risk management measures: It is important for users to implement proper risk management strategies when trading based on the script's signals. They should define stop-loss orders to limit potential losses if the trade goes against them and consider setting profit targets to secure profits when the trade moves in their favor.

Pro Trading Art - Top N Candle's Gainers/Losers(1-40)Top Gainer/Loser Screener.
Explanation :
With the help of this indicator you can filter top Gainer or Loser in comparison with previous selected range. Suppose you select 5 period inside input tab then this indicator will filter top gainer or losers in 5 days.
Input Parameter:
Timeframe: You can change timeframe of chart. Default timeframe is same as chart.
Period: To select range of candle. Default 5. Means how much price changed in previous 5 candle.
Top : Dropdown option to select top Gainer or Losers
Table Location: Where you want to place your table.
Watchlist Group: You can create watchlist for screener.

Pro Trading Art - Candlestick Patterns with alertAll candlestick pattern based on "Japanese candlestick charting techniques".
Currently Supported List of Candlestick Patterns :
Hammer
Hanging Man
Inverted Hammer
Shooting Star
Morning Star
Evening Star
Bullish Engulfing
Bearish Engulfing
Important Points:
1. You can create alert for all patterns.
2. You can modify multiplier(Length Of Shadow) for Hammer, Hanging Man, Inverted Hammer and Shooting Star
3. You can modify EMA length for upward and downward validation of any pattern.

Pro Trading Art - Double Top & Bottom with alertThis indicator is based on ta.pivothigh and ta.pivotlow function. And with the help of different ph and pl I am detecting double top and double bottom.
Features
1. All signal are on realtime means no repaint
2. Able to detect precise double top & bottom
Input Field
Pivot Length : Default 10 => Use to detect pivot point

Pro Trading Art Open Range Breakout StrategyThis strategy is based on Selected Candle High Low Breakout with buffer point.
You can select specific candle from input tab by giving time of that candle.
Default Settings:
Start Hour : Hour of starting candle means from this input you can specify opening candle. Default is 9.
Start Minute: Minute of starting candle. Default is 15. Means Default opening candle is 9:15
Stop Hour : Means After this time no new trade will execute.
End Hour & End Minute & Close All Trade : Means when you specify End Hour and Minute and Close all trade is true then strategy will close all trade on specified time.
Buffer : With the help of this option you can add some point in High and low of Opening Candle
Trade Mode : You can specify Target and Stop Loss in point or Percent
Stop Loss Point or Percent : This will work according to Trade Mode
Target Point Or Percent : This will work according to Trade Mode
