Camerilla PivotsBefore starting special thanks to @QuantNomad for his script "Ultimate Pivot Point Alerts"
Link : -
Please follow and support him for his work.
In this script I'm modifying how time frame factor is imported into the script and removing other types of Pivots and cleaning it further for only CAMs, I've also added the formulas for 5 and 6 numbers, it will help in trading breakout strategies.
Note that this way of importing Time frame produces minor difference in readings/levels from how it is done in QuantNomads script, so before taking your pics you should calculate your levels on separate sheet and compare which ones are working for you and your strategy.
I've been using this CAM setup for almost a year now, so I coded it as per my needs, it is up to users to utilize it to theirs.
Further utility:
1. You can hide/unhide S/R levels 5/6
2. This is MultiTimeframe version, meaning you can change Time-frame of Pivots being displayed on any TF chart.
3. Lines are produced for only level 3 and 4. And you can choose to hide them. Only Pivot line is kept and can not be hidden.
4. You can also choose to hide/unhide level value and only see label if you want.
5. No historical levels are kept to avoid clutter.
I've not included alerts as I don't use them, but if anyone wants it I suggest referring to @QuantNomad script bank. He has published number of excellent scripts in this regard.
There is no restrictions on this script, it can be used and reproduced freely. Its my way of doing little something for community and my first script.
Enjoy.
Buscar en scripts para "pivot"


Rolling Pivot RibbonRolling Pivot Ribbon
This indicator displays historical and developing pivot levels across multiple days,
creating a dynamic "ribbon" effect as pivots roll forward through time.
DESIGNED FOR: Intraday timeframes (≤1D). Shows warning on higher timeframes.
USE CASE: Identify key support/resistance levels, track pivot evolution, and spot
price interaction zones with enhanced visual clarity.
WHY?
There comes a time in every Pinescript developer's evolution, they feel compelled to write a script that draws many lines, possibly triangles, into the future. This is mine. It's both totally useless, and a constant source of comfort to me.
KEY FEATURES:
• Multiple pivot calculation methods (Classic, Camarilla)
• Historical pivot tracking with configurable lookback period (default 4 days)
• Real-time "developing" pivots that update intraday based on current day's HLC
• Gradient fills between adjacent pivot levels for visual depth
• 13 pivot levels: PP, R1-R6, S1-S6
TASTY MODE (Advanced):
• Intelligent filtering: only shows lines that price has recently intersected
• Dynamic transparency: opacity adjusts based on intersection frequency
• Auto-cleanup: removes stale lines that haven't been touched in X days
• Smart extensions: lines that see more action project further into the future
• Focus mode options to reduce chart clutter
VISUAL CONTROLS:
• Toggle individual pivot levels on/off
• Customizable colors and transparency for lines and fills
• Flexible label positioning (left-align or right-align)
• Adjustable projection length for pivot lines (defaults to 1. Set to 0 for just a ribbon)

Swing High/Low Pivots Strategy [LV]The Swing High/Low Pivots Strategy was developed as a counter-momentum trading tool.
The strategy is suitable for any market and the default values used in the input settings menu are set for Bitcoin (best on 15min). These values, expressed in minimum ticks (or pips if symbol is Forex) make this tool perfectly adaptable to every symbol and/or timeframe.
Check tooltips in the settings menu for more details about every user input.
STRTEGY ENTRY & EXIT MECHANISMS:
Trades Entry based on the detection of swing highs and lows for short and long entries respectively, validated by:
- Limit orders placed after each new pivot level confirmation
- Moving averages trend filter (if enabled)
- No active trade currently open
Trades Exit when the price reaches take-profit or stop-loss level as defined in the settings menu. A double entry/second take-profit level can be enabled for partial exits, with dynamic stop-loss adjustment for the remaining position.
Enhanced Trade Precision:
By limiting entries to confirmed swing high (HH, LH) or swing low (HL, LL) pivot points, the strategy ensures that trades occur at levels of significant price reversals. This precision reduces the likelihood of entering trades in the midst of a trend or during uncertain price action.
Risk Management Optimization:
The strategy incorporates clearly defined stop-loss (SL) and take-profit (TP) levels derived from the pivot points. This structured approach minimizes potential losses while locking in profits, which is critical for consistent performance in volatile markets.
Trend Filtering for Better Entry:
The use of a configurable moving average filter adds a layer of trend validation. This prevents entering trades against the dominant market trend, increasing the probability of success for each trade.
Avoidance of Noise:
The lookback period (length parameter) confirms pivots only after a set number of bars, effectively filtering out market noise and ensuring that entries are based on reliable, well-defined price movements.
Adaptability Across Markets:
The strategy is versatile and can be applied across different markets (Forex, stocks, crypto) due to its dynamic use of ticks and pips converters. It adapts seamlessly to varying price scales and asset types.
Dual Quantity Entries:
The original and optionnal double-entry mechanism allows traders to capture both short-term and extended profits by scaling out of positions. This adaptive approach caters to varying risk appetites and market conditions.
Clear Visualization:
The plotted pivot points, entry limits, SL, and TP levels provide visual clarity, making it easy for traders to track the strategy's behavior and make informed decisions.
Automated Execution with Alerts:
Integrated alerts for both entries and exits ensure timely actions without the need for constant market monitoring, enhancing efficiency. Configurable alert messages are suitable for API use.
Any feedback, comments, or suggestions for improvement are always welcome.
Hope you enjoy!

Pivot Point Daily prediction bitcoin - by Simon-RoseThis is an additional Script to my recent Pivot Point indicator scripts which will show you the next days pivot points based on the actual price range.
This is useful if you are trading right before a new day and want to know how the next bdays pivot points may be placed.
If you have any questions or suggestions pls write me :)
Happy trading
Cheers
Daily Pivots:
Weekly Version:
Monthly Version:

Daily Floor PivotsDaily Floor Pivots with Comprehensive Statistical Analysis
Overview
This indicator combines traditional floor pivot levels with golden zone analysis and comprehensive statistical insights derived from 15 years of historical NQ futures data. While the pivot levels and golden zones can be applied to any instrument, the statistical tables are specifically calibrated for NQ/MNQ futures based on analysis of 2,482 NY Regular Trading Hours (RTH) sessions from 2010-2025.
What Makes This Indicator Original
Unlike standard pivot indicators that merely plot levels, this tool provides:
Enhanced Golden Zone Analysis: Calculates not only the main golden zone (0.5-0.618 retracement of previous day's range) but also golden zones between each pivot pair (PP-R1, R1-R2, R2-R3, PP-S1, S1-S2, S2-S3)
Data-Driven Statistical Tables: Two comprehensive tables displaying real statistics from 2,482 trading days of NQ analysis, including:
Probability-based touch rates and continuation patterns
Context-aware statistics based on opening position
Gap analysis and behavioral patterns
First touch dynamics and time-to-reach averages
Granular Customization: Every visual element and statistical section can be independently toggled, allowing traders to focus on what matters most to their strategy
How It Works
Pivot Calculation Methodology
The indicator uses the standard floor pivot formula based on the previous day's price action:
Pivot Point (PP) = (Previous High + Previous Low + Previous Close) / 3
Resistance Levels: R1, R2, R3 calculated from PP and previous range
Support Levels: S1, S2, S3 calculated from PP and previous range
Golden Zone Calculations
Main Golden Zone: The 0.5 to 0.618 Fibonacci retracement of the previous day's range, representing a key reversal and continuation area.
Inter-Pivot Golden Zones: For each adjacent pivot pair, golden zones are calculated as:
Resistance pairs (PP→R1, R1→R2, R2→R3): 0.5-0.618 range from the lower pivot
Support pairs (PP→S1, S1→S2, S2→S3): 0.382-0.5 range from the upper pivot
These zones represent high-probability areas where price tends to react when moving between pivot levels.
Statistical Analysis Source
All statistics displayed in the tables are derived from external Python analysis of 15 years of 1-minute NQ futures data (2010-2025), specifically analyzing NY RTH sessions (9:30 AM - 4:00 PM EST). The analysis tracked:
2,482 complete trading days
Intraday pivot touches and closes
Opening position context
Gap behavior relative to previous day
Time-of-day patterns
Sequential pivot interactions
IMPORTANT: While the pivot levels and golden zones are universally applicable mathematical calculations that work on any instrument, the statistical percentages shown in the tables are specific to NQ/MNQ behavior only. Do not assume these statistics transfer to other instruments.
Configuration Guide
Basic Settings
Number of Periods Back (1-20, default: 3)
Controls how many historical pivot periods are displayed on the chart
Setting to 1 shows only current day's pivots
Higher values show more historical context
Labels Position (Left/Right)
Choose whether pivot labels appear on the left or right side of each level line
Line Width (1-5, default: 2)
Adjust the thickness of all pivot and golden zone lines
Golden Zone Customization
Show Daily Golden Zone (0.5-0.618)
Toggle the main golden zone on/off
When enabled, displays a shaded box between the 0.5 and 0.618 retracement levels
Line Color / Fill Color
Customize the appearance of the main golden zone
Fill color determines the shaded box transparency
Show Labels / Show Prices
Control whether "0.5" and "0.618" labels appear
Control whether price values are displayed on labels
Inter-Pivot Golden Zones
Six toggle options allow you to show/hide individual golden zones:
PP to R1 / PP to S1: Most frequently touched (60.8% / 50.9%)
R1 to R2 / S1 to S2: Moderately touched (25.2% / 24.0%)
R2 to R3 / S2 to S3: Rarely touched (9.4% / 10.5%)
Line Color / Fill Color: Customize appearance of all inter-pivot zones
Show Labels / Show Prices: Control labeling for inter-pivot zones
Usage Tip: Disable outer zones (R2-R3, S2-S3) on lower volatility days to reduce chart clutter.
Pivot Display
Show Support/Resistance Levels: Master toggle for all pivot lines
Show SR Labels / Show SR Prices: Control labeling on pivot levels
Individual level toggles and colors:
PP (Pivot Point): The central reference point
R1/S1: Primary resistance/support (38.9% / 35.4% touch rate)
R2/S2: Secondary levels (15.6% / 16.1% touch rate)
R3/S3: Extended levels (5.1% / 7.3% touch rate)
Color Customization: Each level's color can be independently set
Overall Statistics Table
Show Overall Statistics Table: Master toggle
Table Size: tiny/small/normal/large/huge/auto
Table Position: Top Left/Top Right/Bottom Left/Bottom Right
Section Toggles (enable/disable individual sections):
Current Session Info
Touch & Close Rates
Continue & Reject Rates
First Touch Statistics
Golden Zone Statistics
Daily Close Distribution
Highest/Lowest Levels Reached
Context Statistics Table
Show Context Statistics Table: Master toggle
Table Size: tiny/small/normal/large/huge/auto
Table Position: Top Left/Top Right/Bottom Left/Bottom Right
Section Toggles:
Current Opening Zone
Opening Zone Statistics
Previous Day Gap Context
Understanding the Statistical Tables
TABLE 1: OVERALL STATISTICS
This table presents universal statistics from 2,482 days of NQ analysis.
Current Session Info
Displays real-time context for the active session:
Open: Where the current RTH session opened relative to pivots (e.g., "GZ_TO_R1" means opened between the PP-R1 golden zone and R1)
Now: Current price position relative to pivots
Direction: Bull (close > open), Bear (close < open), or Flat
How to use: This section helps you quickly understand where price opened and where it currently is, providing immediate context for the day's action.
Touch & Close Rates
Shows probability that each pivot level will be reached during RTH:
Touch %: Percentage of days where price touched this level at any point
Example: R1 touched 38.9% of days, PP touched 57.5% of days
Close %: Percentage of days where price closed beyond this level
Example: R1 close beyond happened 39.8% of days
How to interpret:
Higher touch rates indicate more reliable levels for intraday targeting
The difference between touch and close rates shows rejection frequency
PP has the highest touch rate (57.5%), making it the most magnetic level
Outer levels (R3/S3) have low touch rates (5.1%/7.3%), indicating rare extension days
Continue & Reject Rates
When a level is touched, these statistics show what happens next:
Continue %: Probability price continues through the level
Example: When PP is touched, price continues 88.1% of the time
Reject %: Probability price rejects from the level and reverses
Example: When R1 is touched, price rejects 50.9% of the time
How to interpret:
PP shows highest continuation (88.1%), confirming it's a poor reversal level
Support levels (S1/S2/S3) show strong rejection rates (62.5%/60.7%/56.1%), making them better reversal candidates
Continuation rates above 80% suggest the level is better as a target than an entry
First Touch Statistics
Analyzes which pivot is typically touched first during RTH:
1st Touch %: Probability this level is the first pivot encountered
PP is first touched 37.1% of days (most common)
R1 is first touched 26.0% of days
S1 is first touched 10.9% of days
1st→Continue: If this level is touched first, probability of continuation
S1-S3 show 95.6%-100% continuation when touched first
This means when price reaches support first, it usually continues lower
Avg Time: Minutes after 9:30 AM EST before first touch
PP: 1h 6m average
S3: 19m average (when bearish)
R3: 3h 19m average (when bullish)
How to interpret:
Opening away from PP means higher probability of reaching extremes (R2/R3 or S2/S3)
When support is touched first (within first 2 hours), expect continuation lower
Late-day first touches (after 2 PM) often indicate strong trending days
Multi-Touch: Shows how often levels are tested multiple times (92.8%-95.0% across all levels)
Golden Zone Statistics
Main GZ: 58.5% touch rate for the 0.5-0.618 zone
Inter-Pivot zones:
PP-R1: 60.8% (highest probability)
PP-S1: 50.9%
R1-R2: 25.2%
S1-S2: 24.0%
R2-R3: 9.4%
S2-S3: 10.5%
How to interpret:
Main GZ is touched more often than any individual resistance level
PP-R1 and PP-S1 golden zones are high-probability mean reversion areas
Outer golden zones (R2-R3, S2-S3) are only relevant on high volatility days
Daily Close Distribution
Shows where RTH sessions typically close:
Above/Below PP: 58.5% close above, 41.5% below (slight bullish bias)
Above R1: 24.5% of days
Below S1: 18.7% of days
In GZ: Only 6.3% close in the golden zone (typically transits through it)
How to interpret:
Most days (58.5%) have bullish bias (close above PP)
Less than 25% of days are strong trending days (beyond R1/S1)
Golden zone is an action area, not a resting area
Highest/Lowest Levels Reached
Distribution of the most extreme level reached:
High Resist: R1 (26.0%), R2 (10.8%), R3 (5.1%)
Low Support: S1 (35.4%), S2 (1.9%), S3 (0.6%)
How to interpret:
Most days don't reach beyond R1 or S1
R3/S3 are rare events (5.1%/0.6%), indicating major trending days
S1 is reached as lowest level more often than R1 as highest, suggesting downside is more frequently tested
TABLE 2: CONTEXT STATISTICS
This table provides conditional statistics based on how the session opened.
Current Opening Zone
Displays which of 13 possible zones the RTH session opened in:
ABOVE_R3, R2_TO_R3, R1_TO_R2, GZ_TO_R1, IN_GZ, PP_TO_GZ, AT_PP, GZ_TO_PP, S1_TO_GZ, S2_TO_S1, S3_TO_S2, BELOW_S3
How to use: This immediately tells you the market structure and what type of day to expect.
Opening Zone Statistics
Detailed statistics for the current opening zone (only shows for 6 major zones):
For each zone, you see:
Occurs: How often this opening scenario happens
GZ_TO_R1: 38.4% (most common)
AT_PP: 12.8%
S1_TO_GZ: 24.2%
R1_TO_R2: 9.4%
S2_TO_S1: 6.3%
IN_GZ: 3.8%
Bull/Bear %: Close direction probability
Example: GZ_TO_R1 is perfectly balanced (50.0% bull / 49.6% bear)
R1_TO_R2 is bullish (58.1% bull / 41.0% bear)
Levels Hit: Probability of reaching each pivot level from this opening
Helps identify high-probability targets
Example: From GZ_TO_R1, PP is hit 52.9%, R1 is hit 49.0%, S1 is hit 21.6%
How to interpret:
GZ_TO_R1 (most common): Balanced day, watch PP and GZ for direction clues
AT_PP: Slight bullish bias (56.9%), high chance of touching both PP (92.8%) and GZ (90.3%)
R1_TO_R2: Bullish bias (58.1%), expect continuation to R2 (58.1% chance)
S2_TO_S1: Bullish reversal setup (59.9%), very high chance of S1 touch (82.8%)
IN_GZ: Rare opening (3.8%), bullish bias, virtually guaranteed GZ touch (100%)
Previous Day Gap Context
Shows current gap scenario and typical behavior:
Three scenarios:
GAP UP: Opened Above Yesterday's High (20.5% of days)
R1 Touch: 65.9% (high probability)
R2 Touch: 42.1%
S1 Touch: 15.0% (low probability)
Bias: Bullish continuation
GAP DOWN: Opened Below Yesterday's Low (11.3% of days)
S1 Touch: 71.5% (high probability)
S2 Touch: 55.2%
R1 Touch: 12.1% (low probability)
Bias: Bearish continuation
NO GAP: Opened Within Yesterday's Range (68.2% of days)
PP Touch: 69.5%
GZ Touch: 71.7%
R1 Touch: 35.2%
Bias: Balanced (watch for direction at PP/GZ)
How to interpret:
Gap days (up or down) tend to continue in the gap direction
When gapping, fade trades are low probability (15.0% and 12.1%)
Most days (68.2%) open within previous range, making PP and GZ critical decision zones
The "bias" line provides clear directional guidance for trade selection
Practical Application Examples
Example 1: Standard Day Setup
Scenario: RTH opens at 20,450
PP: 20,400
GZ: 20,390-20,395
R1: 20,425
Previous day high: 20,460
What the tables tell you:
Opening Zone: "GZ_TO_R1" (38.4% occurrence)
Gap Context: "NO GAP" (68.2% occurrence)
Expected behavior: Balanced (50/50 bull/bear)
High probability: PP touch (52.9%), GZ touch (56.8%)
Moderate probability: R1 touch (49.0%), S1 touch (21.6%)
Trade plan:
Wait for price to reach PP (52.9% chance) or GZ (56.8% chance)
Look for directional confirmation at these levels
First target R1 if bullish, S1 if bearish
Avoid assuming direction without confirmation (perfectly balanced opening)
Example 2: Gap Up Day
Scenario: RTH opens at 20,510
Previous day high: 20,460
R1: 20,425
R2: 20,475
What the tables tell you:
Gap Context: "GAP UP" (20.5% occurrence)
R1 touch: 65.9% probability
R2 touch: 42.1% probability
S1 touch: Only 15.0% probability
Bias: Bullish continuation
Trade plan:
Favor long setups
Target R1 first (65.9% chance), then R2 (42.1%)
If R1 breaks, R2 becomes likely target
Shorting is low probability (only 15.0% reach S1)
Example 3: Opening in Golden Zone
Scenario: RTH opens at 20,393
PP: 20,400
GZ: 20,390-20,395
What the tables tell you:
Opening Zone: "IN_GZ" (rare, only 3.8% occurrence)
Bullish bias: 58.1%
GZ touch: 100% (guaranteed - already there)
PP touch: 75.3%
R1 touch: 41.9%
Trade plan:
Expect price to test PP (75.3% chance)
Slight bullish bias suggests long setups better than shorts
Watch how price reacts at PP - likely to continue to R1 (41.9%)
This is an uncommon opening, suggesting potential for larger moves
Best Practices
Match Your Instrument: Remember, statistics are NQ-specific. If trading other instruments, use the levels but disregard the statistical percentages.
Combine with Price Action: Use the statistics for probability context, not as standalone signals. Always confirm with price action, volume, and your trading methodology.
Adapt Table Display: Don't display all sections all the time. Toggle based on your trading phase:
Pre-market: Focus on "Gap Context" to understand the setup
Market open: Watch "Opening Zone Statistics" for directional bias
Intraday: Monitor "Current Session Info" for position tracking
Understand Context: A 60% touch rate doesn't mean guaranteed—it means 40% of days don't touch. Use these probabilities to size positions and manage expectations.
Inter-Pivot Golden Zones: These are most useful when price is already in motion toward a level. For example, if price breaks above PP heading to R1, the PP-R1 golden zone (60.8% touch rate) becomes a high-probability pullback area.
Time Awareness: The "Avg Time" statistics help you understand urgency. If it's 10:30 AM and S1 hasn't been touched (average is 55 minutes), the window for bearish moves is closing.
Technical Notes
Time Zone: All times referenced are NY/EST
Session Definition: RTH is 9:30 AM - 4:00 PM EST
Calculation Period: Pivots update daily based on previous 24-hour period (18:00 previous day to 17:00 current day)
Data Source: Statistics derived from 12 years of NQ 1-minute futures data (2013-2025)
Sample Size: 2,482 complete RTH trading sessions
Disclaimer
This indicator provides statistical probabilities based on historical NQ futures data. Past performance does not guarantee future results. The statistical tables are educational tools and should not be the sole basis for trading decisions. Always:
Use proper risk management
Combine with your own analysis
Understand that probabilities are not certainties
Remember that statistics are instrument-specific (NQ/MNQ only)
Credits
Statistical analysis performed using Python analysis of 12 years of historical NQ futures data. All pivot and golden zone calculations use standard mathematical formulas applicable to any instrument.

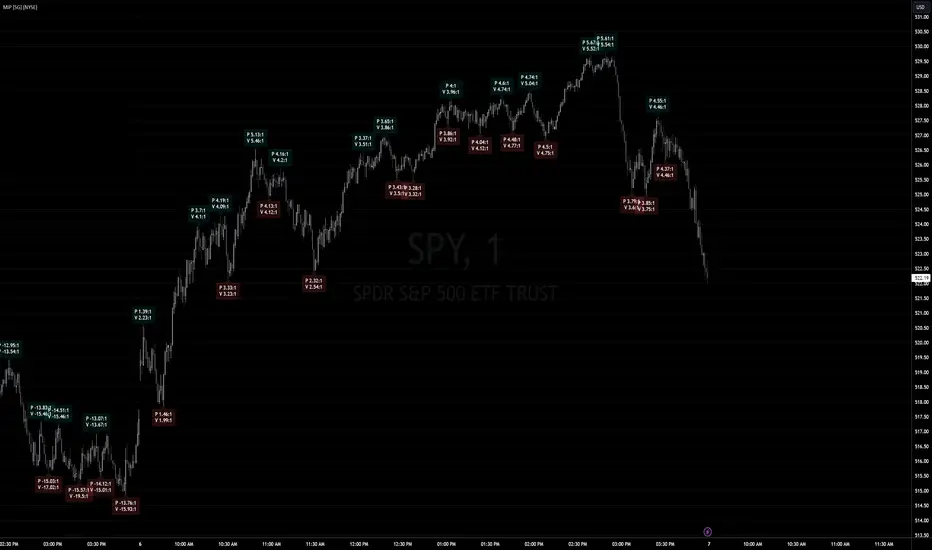
Pivot Channel LevelsPivot Channel Levels
Indicator Description
“Pivot Channel Levels” is an advanced technical analysis tool that identifies key price pivots (highs and lows) and creates dynamic support and resistance levels based on the wicks of candles at these points (or bodies if wicks are minimal). The indicator analyzes the volume at the time of a pivot’s formation, displaying its value and percentage change relative to the volume’s simple moving average (SMA).
It does not generate buy/sell signals but provides a clear visualization of market structure, helping traders identify potential price reaction zones and assess the strength of market movements.
Why Are Wicks Important?
Candle wicks at price pivots indicate significant market reactions in key areas. Depending on the context, they may signal rejection, testing, or absorption of a support or resistance level. Long wicks often appear where large players are active, and the marked zones are frequently retested. The indicator allows for quick identification and observation of their impact on future price action.
Why Use It?
- Precise Support and Resistance Levels: The indicator draws price channels based on candle wicks at pivots (or bodies if wicks are absent), enabling better identification of zones where price may react.
- Volume Analysis: It shows how the volume at a pivot differs from the average, indicating potential activity by large players or key market moments.
- Visual Clarity: Colored lines, channel fills, and clear labels facilitate quick chart analysis, even on short timeframes.
- Flexibility: Adjustable pivot length, volume average, and label colors allow customization to various trading strategies.
How It Works
- Pivot Detection: Automatically identifies local highs and lows based on the “Pivot Length” parameter (default: 20 candles). This means a pivot appears on the chart with a 20-candle delay. Reducing this value allows faster pivot detection (after fewer candles), increasing their number but potentially generating more noise.
- Channel Creation: Draws support and resistance levels based on the wicks of candles at pivot points (or bodies if wicks are minimal) with a delay to confirm zones. A pivot channel is drawn until the next pivot is identified, but if not previously broken, it remains valid as active support or resistance.
- Volume Analysis: Displays the volume at the pivot’s formation and its percentage change relative to the volume’s SMA.
- Visualization: Pivot and channel levels are shown as lines with fills, and labels display volume and its deviation from the average.
Trading Applications
- Swing Trading: Use pivot levels and channels to identify price reversal points or consolidation zones.
- Scalping: Monitor price reactions to channels on short timeframes, especially with high volume.
- Faster Pivot Identification: Switch to a lower timeframe (e.g., from H1 to M15) to identify pivots more quickly, allowing earlier reactions to price changes.
- Market Context Analysis: High volume at pivots may indicate significant levels likely to be retested.
- Combining with Other Tools: The indicator pairs well with Fibonacci retracement, supply/demand zones, or oscillators like RSI.
Settings and Customization
- Pivot Length: Determines how many candles back and forward are analyzed to detect pivots (default: 20). A smaller value increases sensitivity, a larger one enhances stability.
- Volume Average: Length of the SMA for volume (default: 20). Adjust to better reflect market characteristics.
- Label Colors: Choose colors for bullish and bearish pivot labels to match your chart style.
Usage Examples
- Identifying Key Zones: If the price approaches a pivot level with high volume (e.g., +50% relative to SMA), it may signal strong support or resistance.
- Breakout Confirmation: A channel breakout with high volume can indicate trend continuation.
- Price Reaction Analysis: Long wicks at pivots with high volume may signal level rejection by large players.
Notes for Users
- The indicator performs best on highly liquid markets (e.g., Forex, indices, cryptocurrencies).
- On short timeframes (e.g., M1, M5), it may generate more noise—adjust “Pivot Length” to suit your needs.
- Consider combining with other indicators to confirm signals derived from pivot and volume analysis.

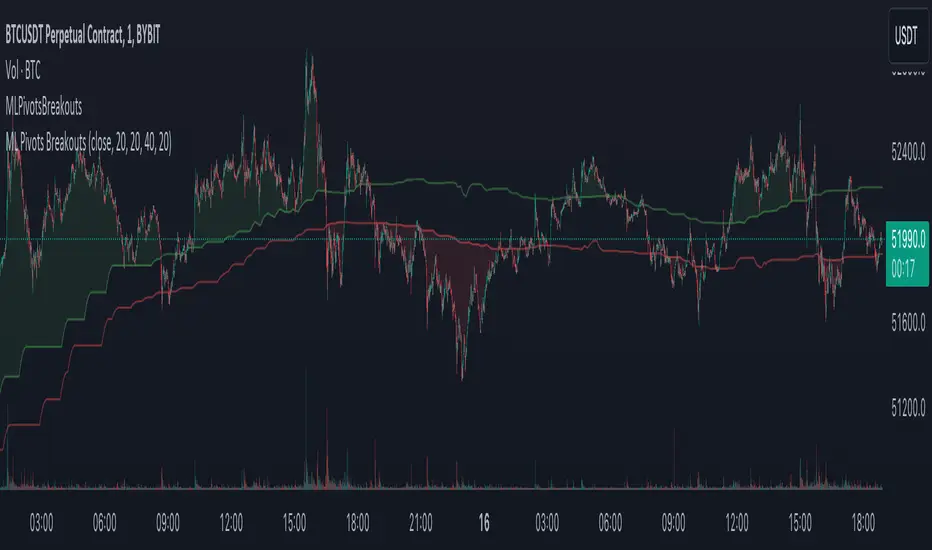
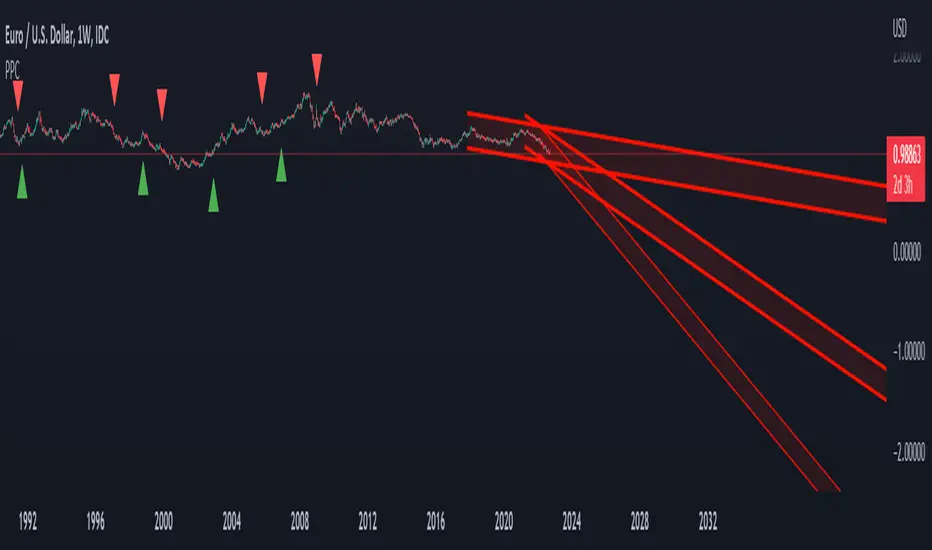
Machine Learning Breakouts (from Pivots)I developed the 'Machine Learning Breakouts (from Pivots)' indicator to revolutionize the way we detect breakout opportunities and follow trend, harnessing the power of pivot points and machine learning. This tool integrates the k-Nearest Neighbors (k-NN) method with the Euclidean distance algorithm, meticulously analyzing pivot points to accurately forecast multiple breakout paths/zones. "ML Pivots Breakouts" is designed to identify and visually alert traders on bullish breakouts above high lines and bearish breakouts below low lines, offering essential insights for breakout and trend follower traders.
For traders, the instruction is clear: a bullish breakout signal is given when the price crosses above the forecasted high line, indicating potential entry points for long positions. Conversely, a bearish breakout signal is provided when the price breaks below the forecasted low line, suggesting opportunities to enter short positions. This makes the indicator a vital asset for navigating through market volatilities and capitalizing on emerging trends, designed for both long and short strategies and adeptly adapting to market shifts.
In this indicator I operate in a two-dimensional space defined by price and time. The choice of Euclidean distance as the preferred method for this analysis hinges on its simplicity and effectiveness in measuring and predicting straight-line distances between points in this space.
The Machine Learning Breakouts (from Pivots) Indicator calculations have been transitioned to the MLPivotsBreakouts library, simplifying the process of integration. Users can now seamlessly incorporate the "breakouts" function into their scripts to conduct detailed momentum analysis with ease.
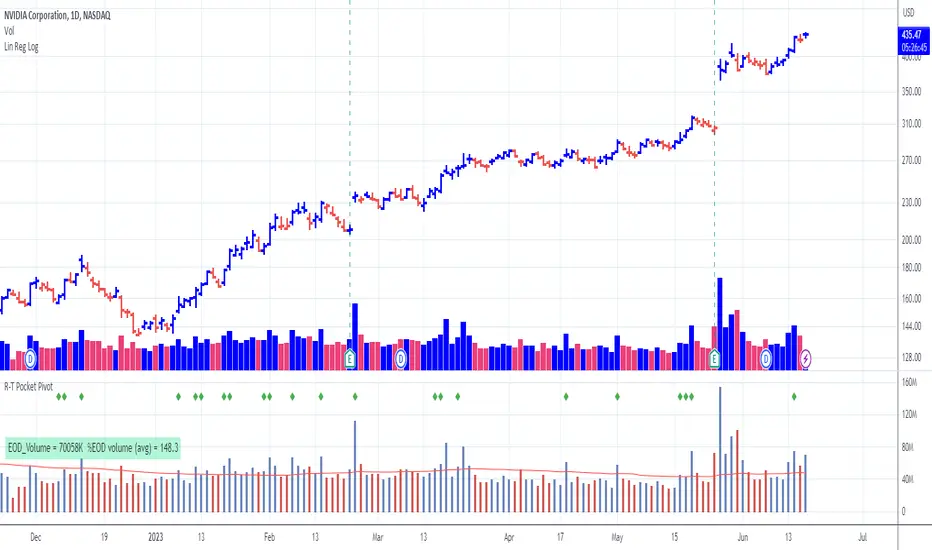
Pocket Pivot with extrapolated Volume and Moving AveragesThe script shows historical pocket pivots, much as other scripts with a green diamond shape on the volume pane.
When the market is open, the current bar, however, is extrapolated to the end of the day using a sixth-order polynomial.
Thus real-time pocket pivots are shown. To work properly, the user must input a time-zone offset parameter; the default is west coast USA.
Time-zone offset is -12 hours to +12 hours compared to the NYSE exchange time zone (USA west coast: -3.)
The volume extrapolation polynomial is based on a historical NASDAQ intraday volume model developed locally by a team.
Only ten-day lookback pocket pivots are computed as defined initially by Dr. Chris Kacher. (The default lookback can be changed by the user.)
Only pocket pivots are shown where the low of the daily bar is within user-defined proximity to the 50-day moving average or 10-day moving average (for continuation pocket pivots.)
On-chart Wavetrend Divergence with PivotsThis is an OnChart WaveTrend Divergence Indicator with Pivots and Alerts
LazyBears WaveTrend Indicator or also known as "Market Cipher" is an Indicator that is based on Moving Averages, therefore its an "lagging indicator". Lagging indicators are best used in combination with leading indicators. In this script the "leading indicator" component are Daily, Weekly or Monthly Pivots. These Pivots can be used as dynamic Support and Resistance, Stoploss, Take Profit etc.
This indicator combination is best used in larger timeframes. For lower timeframes you might need to change settings to your liking.
What are those circles?
-These are the WaveTrend Divergences. Red for Regular-Bearish. Orange for Hidden-Bearish. Green for Regular-Bullish. Aqua for Hidden-Bullish.
Please keep in mind that this indicator is a tool and not a strategy, do not blindly trade signals, do your own research first! Use this indicator in conjunction with other indicators to get multiple confirmations.

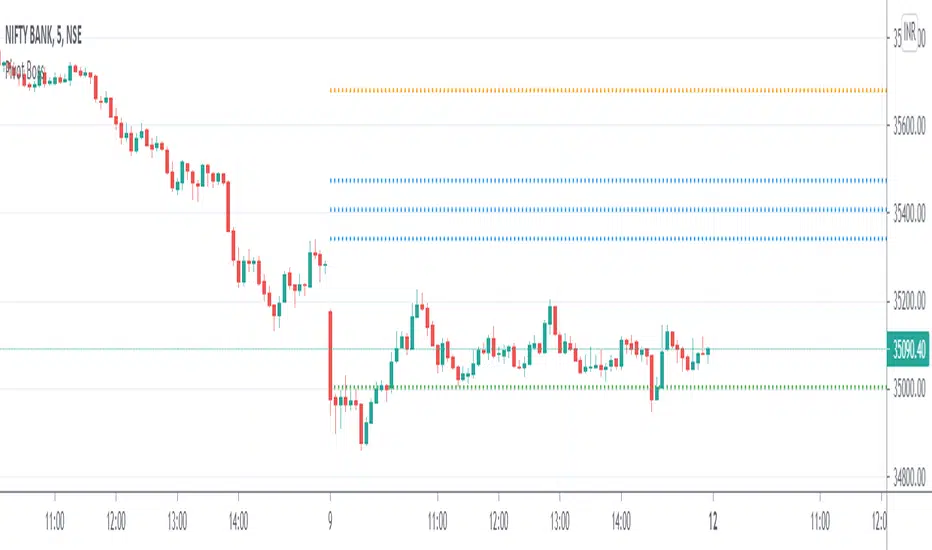
Pivot Boss - CPRThe Central Pivot Range (CPR) is used to identify key price points to set up trades. CPR is beneficial for intraday trading. This indicator can plot:
1. Daily Pivots and Daily Support/Resistance
2. Tomorrow Pivots and Support/Resistance
3. Weekly Pivots and Weekly Support/Resistance
4. Monthly Pivots and Monthly Support/Resistance
5. Previous Day High/Low
6. Previous Week and Month High/Low
Derivative Pivot HL Points Hello.
This script aims to take into account mutable variable Pivot Points' periods.
While doing this, it takes the period between 2 signals that I use in the script:
And these periods in my Pivot HL function integrated into len length (Mutable variables) :
The cornerstone of the script is these facts.
Pivot can be optimized by playing with reversal periods.
These pre-formed levels can be used as Supply and Demand levels.
Regards.

Montly Pivot Points indicatorA pivot point indicator that has possibility to see even the monthly or the weekly pivot points.
Pivot points are very powerful if used in correct way.
most of the time the price can be rejected from the pivot point or if the price break it it will be a nice entry if retest the pivot
R2/S2 are a very strong pivots to break but of course you need a certain distance between the pivot.

AperonFx Pivot Points 1.1This indicator plots ATR-based pivot levels with a clean, institutional layout.
The central pivot (P) is calculated from the selected timeframe and price formula, while support and resistance levels are placed at equal distance steps above and below the pivot.
Users can choose between an automatic step based on ATR or a fixed price step for fully controlled, symmetric levels.
All levels are drawn as continuous segments that align precisely with the active pivot period.
Price annotations are displayed in a minimal, unobtrusive style and always match the exact level values.
The indicator is designed to remain consistent across chart timeframes without recalculation drift.
It is intended for traders who want clear, structured reference levels rather than reactive signals.

Intraday Pivot Highs & Lows (Asia London NY)Intraday Pivot Highs & Lows (Asia London NY)
Script Description
This TradingView indicator is optimized for Forex, scalping, intraday, and day trading strategies. It accurately plots Pivot Points and levels, high/low, support and resistance levels. These are clearly identified to aid the trader during killzone sessions and session opens. Ideal for scalp trading, intraday sessions, and leveraging SMT (Smart Money Techniques). Utilize these Price Levels effectively during London Open, NY Open, and the Asia Session, utilizing Market Structure to pinpoint key levels and reversal zones for successful trading. Improve your Trade Setups, recognize reliable Chart Patterns, identify critical Price Pivots, and trade confidently off Institutional Levels.
This script marks the intraday pivot highs, lows and midpoints retracement levels for
Asia
London
New York
It also plots the previous day's high, low, midpoint, and 0.618 Fibonacci retracement levels, providing traders with critical price reference points for making intraday trading decisions.
Originality & Usefulness
This indicator uniquely integrates pivot calculations across three major Forex sessions (Asia, London, NY), clearly delineating session boundaries.
It enhances visibility by using distinct styling
solid for New York
dashed for London
dotted lines for Asia
And colour co-ordinated labeling, improving traders' ability to identify important intraday price action zones efficiently. Unlike standard pivot indicators, this script emphasizes session-specific trading dynamics.
### Key Features ###
Session-Based Levels: Automatically plots high, low, midpoint, and Fibonacci (.618) levels for each major session (Asia, London, NY).
Distinct Visual Cues: Lines and labels use session-specific styles and colors to easily differentiate between sessions.
Previous Day Reference: Clearly plots and labels yesterday's high, low, midpoint, and Fibonacci levels.
Flexible Visibility: Traders can set timeframe visibility to maintain clean charts on higher timeframes.
### How It Works
At the start of next day's session, previous session lines are cleared, ensuring the chart remains uncluttered.
High, low, midpoint, and Fibonacci retracement levels (.618) are dynamically calculated and displayed at the close of each session.
All session levels remain visible until the start of the next respective session, providing continuous actionable insights.
Trading Application:
Session highs and lows act as strong intraday support and resistance zones.
Midpoints and Fibonacci levels are effective for identifying potential reversal zones and retracements.
Daily levels provide a broader context, useful for gauging intraday volatility and range.
### Limitations and Considerations ##
Best used on liquid assets with clear session-based price action, such as Forex major pairs, if used on indexes make sure they contain 24 hour price action not just New York session.
This indicator is designed to streamline intraday trading by clearly marking essential pivot points and session-based levels, significantly improving traders' market context and decision-making accuracy. Can be used to enhance SMT decision making when scalping killzones.

Market Internal Pivots by SyntaxGeekThis indicator combines simple pivot detection with market breadth ratios.
The thought was to show market breadth strength or weakness where price was making potential pivots.
Lookback can be adjusted and currently it supports NYSE and NASDAQ market breadth.
Configuration is limited given the simplicity but live breadth printout can be displayed at current candle.
Max label count is at 500 but the indicator makes use of the visible chart library and will redraw old pivot labels when scrolling back, up to 500.
Considering that market breadth data is only available during RTH, do not expect data during ETH sessions. I've only tested this up to 1hr timeframe so I can't guarantee higher timeframes will present correctly.
Feel free to leave feedback, happy trading!
Pivot Parallel Channel by [livetrend]This script draws parallel channels using pivot points for trend analysis.
Script draws maximum 4 parallel channels if suitable up or down trend already exists on the chart according to chosen Pivot Length and Multiplier.
You can change Multiplier to draw Higher Time Frame Channels.
Good luck!
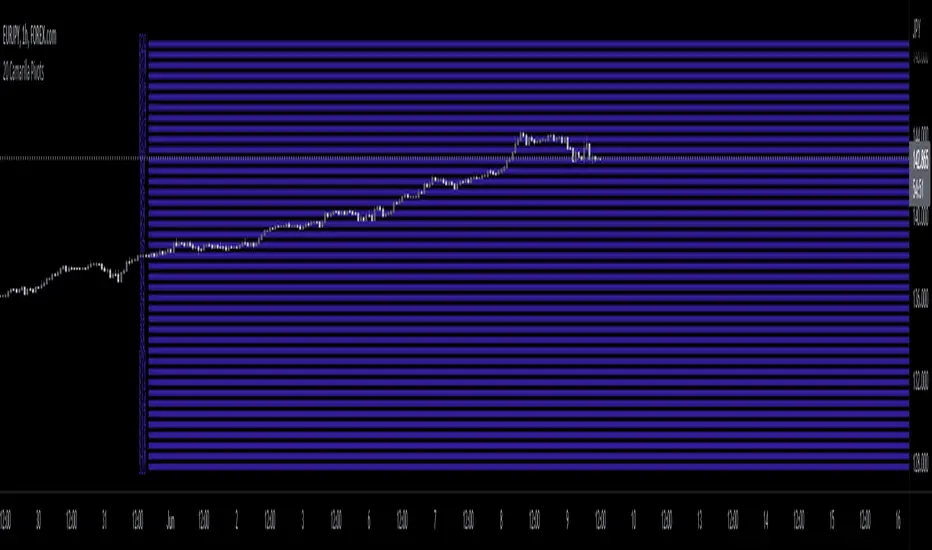
20 Camarilla Pivot PointsThis indicator plots 20 Camarilla pivot points above and below the pivot based on the selected time frame. This is useful when price goes between the standard 3 and 4 pivots and above 4. Note that the normal 4 pivot point is labeled as 6 in this indicator. You can change the color of each set of pivots so you can mark the standard Camarilla pivots if you wish. The image is using monthly Camarilla pivots on a 1 hour time frame.
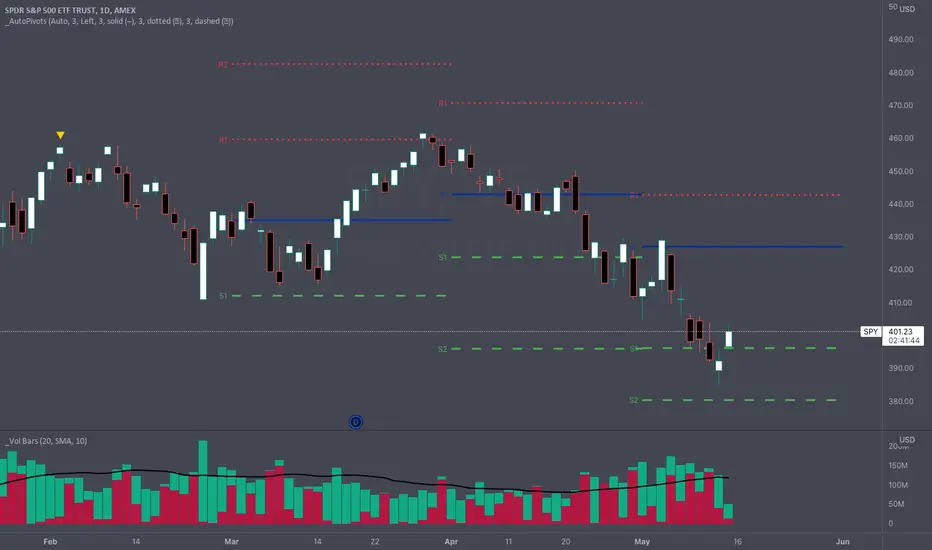
_Auto Pivot PointsOne of the main drawbacks to displaying Pivot Points on a chart is that many times the more extreme pivots (R/S3, R/S4, R/S5) aren't anywhere close to the price action during a timeframe. These extreme pivot points clutter up your chart and make it hard to use the "auto" zoom feature of TradingView.
The " _Auto Pivot Points " indicator solves these problems by automatically only displaying the pivot points if the price has crossed the pivot during the timeframe or it is the next closest pivot . For example, on monthly pivots if the price has only crossed the R1 Pivot then this indicator will display the R2 Pivot and any pivots below but it won't display the R3, R4, R5 pivots . The R3, R4, & R5 pivots are not very useful to the trader because the price hasn't even crossed the R2 Pivot . But as soon as the price crosses the R2 Pivot then this indicator will display the R3 Pivot because it is the next closest. And the same logic applies to the S Pivots .
If you need to see all the Pivots then there is a convenient toggle to display all the pivots by turning off the intelligent auto pivots . But as soon as you don't need to display all the pivots the toggle will turn on the automatic pivots .
This indicator has many style and logic options. This script allows you to control:
Number of past timeframes to display
Displaying Pivot labels
Label position (left/right)
Line color
Line width
Note: TradingView has a limit of 40 security calls per script. Due to this limitation this indicator can only display pivots a max of 7 time periods back.
Note 2: This indicator uses the Traditional pivot calculations.
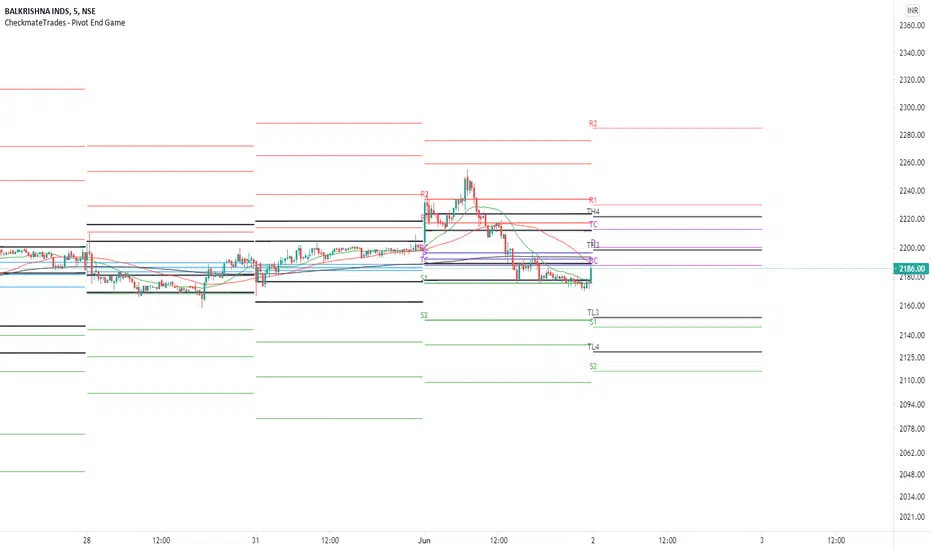
CheckmateTrades - Pivots End GameThis indicator is based on the Pivot study. Traders will be able to plot CPR, Standard floor pivots as well as Camarilla Pivots on multiple timeframes.
Why pivots from multiple timeframes are relevant and included in this one indicator?
We can analyse pivots on multiple timeframes for different trading setups. As in, Daily floor pivots are best suited for analysing the market trend for Day trading. Similarly, Weekly and Monthly floor pivots can be analysed for Swing and positional trading entries. Whereas yearly pivot is best suited for trend analysis for investment purpose.
What is the relevance of plotting tomorrow's pivot level in advance?
Pivot are calculated based on the price happened on a previous day. And hence trader can plot tomorrow pivots in advance to shortlist stocks for tomorrow's trading session.
TimeFrames Available to traders are –
1. Daily
2. Weekly
3. Monthly
A) Daily Pivots
Present Day –
1. Trader can plot Daily CPR
2. Trader can plot Daily R1, R2, R3 and R4 pivot resistance levels
3. Trader can plot Daily S1, S2, S3 and S4 pivot support levels
4. Trader can plot Daily Camarilla levels
Future Day –
1. Trader can plot Tomorrow CPR
2. Trader can plot Tomorrow R1, R2, R3 and R4 pivot resistance levels
3. Trader can plot Tomorrow S1, S2, S3 and S4 pivot support levels
4. Trader can plot Tomorrow Camarilla levels
5. Previous Day High and Low
B) Weekly Pivots
Present Week –
1. Trader can plot Present week CPR
2. Trader can plot Present week R1, R2, R3 and R4 pivot resistance levels
3. Trader can plot Present week S1, S2, S3 and S4 pivot support levels
4. Trader can plot Present week Camarilla levels
Next Week –
1. Trader can plot Next week CPR
2. Trader can plot Next week R1, R2, R3 and R4 pivot resistance levels
3. Trader can plot Next week S1, S2, S3 and S4 pivot support levels
4. Trader can plot Next week Camarilla levels
5. Previous Week High and Low
C) Monthly Pivots
Present Month –
1. Trader can plot Present Month CPR
2. Trader can plot Present Month R1, R2, R3 and R4 pivot resistance levels
3. Trader can plot Present Month S1, S2, S3 and S4 pivot support levels
4. Trader can plot Present Month Camarilla levels
Next Month –
1. Trader can plot Next Month CPR
2. Trader can plot Next Month R1, R2, R3 and R4 pivot resistance levels
3. Trader can plot Next Month S1, S2, S3 and S4 pivot support levels
4. Trader can plot Next Month Camarilla levels
5. Previous Month High and Low
Moreover, I have also included SMA (Simple moving averages) study in this indicator. Trader can add 20,50 & 200 SMA on there charts.
Why is it relevant? Trader can get a visual confirmation of an up-trending or an down-trending move by looking at rising or falling 20 & 50 SMA respectively
Usually in an uptrending stocks. 20 & 50 SMA will move in parallel to each other and will rise upwards. Price will tend to trade above the 20 SMA and 20 SMA will continue to act as a support.
Higher Order PivotsFirst order pivot points are defined as 3 or 5 bar "V" shaped patterns. For example a high with a lower high either side of the peak and in the case of the 5 bar variant with lower highs adjacent to a high below the peak.
Second order pivot points are defined by three first order pivots in the same manner. For example a peak pivot high with a lower pivot high to either side.
Third order pivots follow the same pattern, a peak second order pivot high with two adjacent second order pivot highs.
As it can take a significant and variable amount of time before higher order pivots are confirmed, it is generally inadvisable to use higher order pivots for live trading!
However they can be used for historical analysis. For example to delineate market structure of major market inflections.
For example :
Delineating market structure using 2nd order pivots derived from 3 bar, 1st order pivots
Major market inflections from 3rd order pivots derived from 5 bar, 1st order pivots

Dynamic Pivot Point Backtest This Pivot points is calculated on the current day.
Pivot points simply took the high, low, and closing price from the previous period and
divided by 3 to find the pivot. From this pivot, traders would then base their
calculations for three support, and three resistance levels. The calculation for the most
basic flavor of pivot points, known as ‘floor-trader pivots’, along with their support and
resistance levels.
You can change long to short in the Input Settings
WARNING:
- For purpose educate only
- This script to change bars colors.

Operación con Pivotes V.1.0 -BETA-Permite identificar puntos pivote diario, semanal y mensual e implementa la estrategia de Day of Reversal con RSI para identificar puntos de inflexión (compra o venta) en los instrumentos.
