MTF High and Low FractionsMTF High and Low Fractions
Description
An experimental script that prints 1/3, 1/4 and 1/8 levels of the previous timeframe's high and low to the current timeframe. The idea is quite simple. It mirrors the the previous high and low with user selected levels. The default setting is the previous daily high and low but can be customized on user discretion.
New levels are printed after the close of the previous timeframe and open of the new timeframe (user's timeframe setting).
How To Use
Levels should not be used blindly. Levels can be used as confluence when aligned with high probability supply and demand zones, support, resistance, order blocks, and so on.
Buscar en scripts para "mtf"
MTF fair value gap v2 thigh gaps yumwell load in 2 FVG indicators one for current chart then one for MTF of interest.
Higher timeframe FVGs are more important and can be used for bias or even targets for internal liquidity.
big thanks @shanxia for basically re-doing the FVGs into arrays hehehe..
Can now delete mitigated or change mitigated color..
I dont know who uses extensions but if you want to suffer in your private time then go ahead...
pre sure this is the sexiest FVG indicator validate me in the description pls
MTF DSS (Double Smoothed Stochastic) [TH]The Double Smoothed Stochastic indicator was created by William Blau.
The DSS ranges from 0 to 100, like the standard Stochastic Oscillator.
The same rules of interpretation apply to Stochastics can be applied to DSS, although the DSS offers a much smoother curve than the raw Stochastic.
How it works:
It applies Exponential Moving Averages (EMAs) of two different periods to a standard Stochastic %K.
The components that construct the Stochastic Oscillator are first smoothed with the two EMAs.
Then, the smoothed components are plugged into the standard Stochastic formula to calculate the indicator.
Calculation:
EMA of the ( EMA of the (Close – Lowest Low for the specified period) )
Divided by
EMA of the ( EMA of the (Highest High for the specified period – Lowest Low for the specified period) )
X 100
How to add alerts:
Check off each piece of criteria you want for the alerts, then select Okay.
Then go to 'Create Alert' and set the condition to 'MTF DSS', select create.

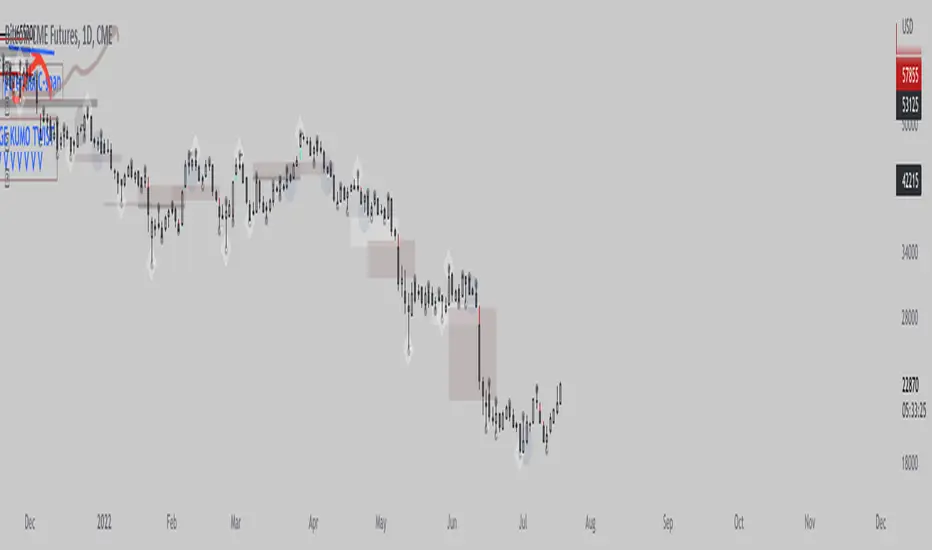
MTF Ichimoku Analysis[tanayroy]Ichimoku can state market conditions better than any indicator or group of indicators(My own perspective). Ichimoku works seamlessly in different timeframes. Analysis of Ichimoku in different timeframes can give you the bigger picture of the market.
This indicator analyzes six different timeframes with Ichimoku in depth. Default timeframes are 5M, 30M, 60M, D, W, and M. You can change the default timeframes from the setting.
As we are dealing with many relations, we can define the relationship with a simple score to get the trend strength.
Ichimoku Analysis:
Relationship of Price(P) with Ichimoku indicators: Here we are analyzing the current price and Ichimoku indicators. The position of price with respect to Ichimoku indicators states the market condition clearly.
Price(P) and Kumo(C): P > C = Bullish (↑). P < C = Bearish (↓). P <> C = consolidation or no trend(↔). Score: ±2
Price(P) and Tenkan Sen(T): P >= T = Bullish (↑). P < T = Bearish (↓). Score: ±0.5
Price(P) and Kijun Sen(K): P >= K = Bullish (↑). P < T = Bearish (↓). Score: ±0.5
Price(26 bars ago) and Chiku(L): L >= P(26) = Bullish (↑). L < P(26) = Bearish (↓). Score: ±0.5
Tenkan Sen and Kijun Sen Relation. Tenkan Sen depicts short-term trends and Kijun depicts mid-term trends. So this relationship is important for analyzing the current trend of the market.
Tenkan Sen(T) and Kijun Sen(K): T >= K = Bullish (↑). T < K = Bearish (↓). Score: ±2
Direction of Ichimoku indicators.
The direction of Ichimoku indicators helps us to understand the trend strength.
Tenkan Sen's(T) direction: Upward slope = Bullish (↑). Downward slope = Bearish (↓). Flat=consolidation or no trend(↔). Score: ±0.5
Kijun Sen's(K) direction: Upward slope = Bullish (↑). Downward slope = Bearish (↓). Flat=consolidation or no trend(↔). Score: ±0.5
Senkou A(A) direction: Upward slope = Bullish (↑). Downward slope = Bearish (↓). Flat=consolidation or no trend(↔). Score: ±0.5
Senkou B(A) direction: Upward slope = Bullish (↑). Downward slope = Bearish (↓). Flat=consolidation or no trend(↔). Score: ±0.5
Cloud and other Ichimoku indicators:
Kumo or Cloud is very important in the Ichimoku system. Analyzing its relation with other indicators is important to detect the overall market condition.
Kumo(C) and Tenkan Sen(T): T >= C = Bullish (↑). T < C = Bearish (↓). T <> C = consolidation or no trend(↔). Score: ±0.5
Kumo(C) and Kijun Sen(K): K >= C = Bullish (↑). K < C = Bearish (↓). K <> C = consolidation or no trend(↔). Score: ±0.5
Kumo(C) and Chiku(L): L >= C = Bullish (↑). L < C = Bearish (↓). L <> C = consolidation or no trend(↔). Score: ±0.5
Kumo(C) Shadow: By analyzing the last 252 bars(you can change this option) we are analyzing the Kumo shadow behind the current price. If Kumo shadow is present behind the price, trend strength will be weakened. Score: ±0.5
Kumo(C) Future (Senkou A(A) and Senkou B(B)): A >= B = Bullish (↑). A < B = Bearish (↓). Score: ±0.5
Chiku(L) Analysis:
Vertical and Horizontal Chiku analysis will tell us about the possible consolidation of the price.
Chiku Vertical: if the price consolidates for the next 5 bars(You can change this option) will it run into the price. Please remember we are placing the current price 26 bars ago and we are interested to see the current price in open space for a clear trend. Score: ±0.5
Chikou Horizontal: If Chiku is in open space (Not running into the price), we want to review Chiku vertically i.e how much percentage of fall or rise of the current price can cause Chiku to run into the price.
So, the maximum trend score is ±10.5.
Ichimoku signals:
We know, that the crossover of Ichimoku indicators provides important signals. In this section, you can see all the crossover i.e when they happened (Bars ago)
Distance between price and Tenkan Sen and Kijun Sen: We know, the price come back to Tenkan/Kijun if it goes far away from Tenkan/Kijun. So it is important to note the distance between Tenkan and Price.
Please note that this indicator is not a strategy or buy/sell signal. It just shows you the picture of Ichimoku in multiple timeframes. I am working on some strategies of Ichimoku and will publish the same when my research is complete.
If you want to analyze Ichimoku in a single timeframe, please review the following indicator.
To maintain the table size you can use the shorthand notation from the setting.
Table with detailed analysis:
Table with shorthand notation:
Please comment if you want any clarification or found any bugs to report.

MTF 3 Moving Averages (EMA & SMA)Hi, for those of you that like trading with Moving averages, here's a script to view 3 of them at once on MTF scale.
I added the option to switch between EMA and SMA or to view all of them at the same time.
I use the 1D moving averages to look for support and resistance levels on smaller timeframes (1H,4H)
Enjoy!
MM :)

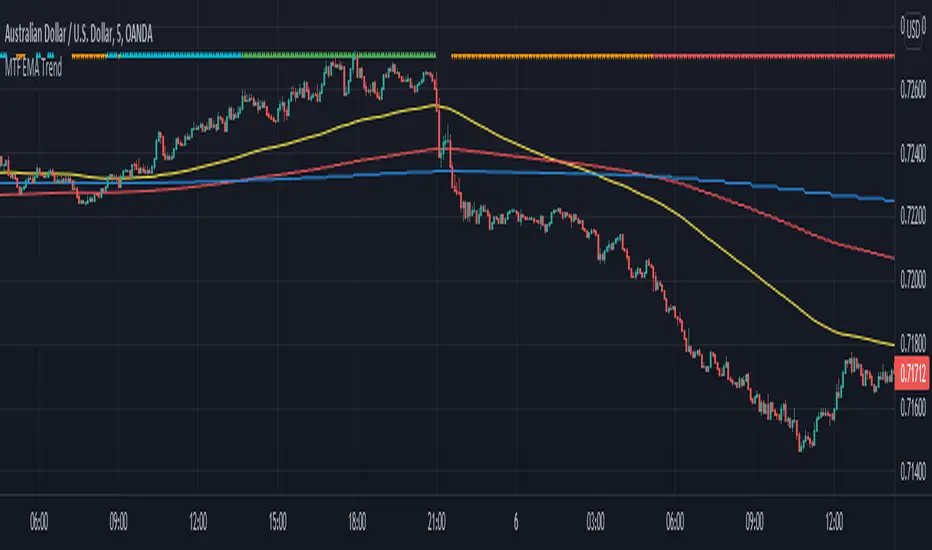
MTF EMA TrendThe indicator plots directional arrows on top of the chart to visualize the market's price trend. The plots are based on candle closing below all three multitimeframe EMAs, downtrend, when the EMAs are also in order (1 below 2 and 2 below 3). Opposite situation is uptrend.
It also marks a breakdown when the price closes under the third (supposedly always the slowest) EMA outside of aforementioned downtrend situation. Opposite is true for breakup to be marked.
Please always make sure, that the three EMAs are in order of EMA 1 being the fastest and 3rd the slowest. Default settings are used on the 5 minute timeframe.
Indicator can be used to quickly check the overall trend of the market as told by three MTF EMAs without needing to clutter the chart with the actual EMA plots. This is useful, for example, if you mainly base your scalping trades on other types of indicators, but you want a quick peek of the market direction or indecision.
MTF Market Structure Highs and LowsThe indicator marks the last fractal highs and lows (W,D,4H and 1H options) to help determine current market structure. The script was created to help with directional bias but also as a MTF visual aid for stop hunts/liquidity raids.
Liquidity areas are where we assume trader's stop losses would be when buying or selling. Liquidity lies above and below swing points and institutions need liquidity to fill large orders.
Monitor price action as it hits these areas for a potential reversal trade.

MTF StochRSI indicator by noop42Here is a custom x3 timeframes Stochastic RSI indicator.
Main Features (can be disabled)
Average mode : for each timeframe, a single line corresponding to the average value between K and D is printed
Repaint mode : if enabled: values are updated in live, if disabled: values are updated once the concerned candle is closed
Default parameters
Timeframes: 1, 5, 15
Mode : Average value
Repaint mode: enabled

MTF WatchList Charts [Anan]█ OVERVIEW
I am happy to present this script with a nice idea!
You can now customize a watchlist with your preferred time frame and any symbol from any market.
The main purpose is to be aware of any moves and watch a brief overview of the chart.
█ FEATURES
- 8 customizable symbols with the option to show/hide anyone
- Multi time frame support
- 3 Types of charts (Candles / Heikin Ashi / Line)
- Displaying up to 10 candles for every chart
- Customizable chart colors
- Option to Show/hide Price
- Option to Show/hide Price Line
- Option to change Labels and Text Size
- Show Symbol name and used time frame
- Option to change gaps between charts
- Hover over on the top of any candle to see (Open/High/Low/Close) Prices
█ SCREENSHOTS
-----------------------------------------------
Special thanks to @dgtrd for inspiration and for the amazing framework used here ( HTF Candles by DGT )
Special thanks to Pine Chat @fareidzulkifli @Bjorgum @JohnBaron @fpainchaud

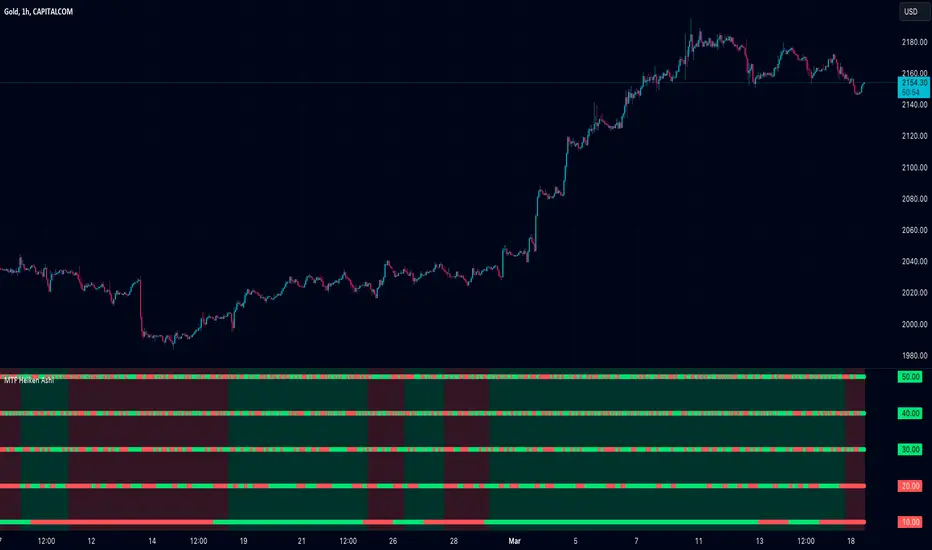
MTF Heiken Ashi (No Repaint)Hi there. This indicator is inspired by Heiken Ashi MTF (by @jdmonto0).
The problem with that indicator was that it repaints and I tried to solve that.
I figured that the reason the other version repaints was because the heiken ashio calculation is based on the close of the candle, and since the higher timeframe candle hasn't closed yet, the value of previous candles on a lower timeframe can change.
This version bases the calculation on the previous bar, which solves the repainting problem.
Please tell me what you think about it.
MTF VWAPA simple wavetrend oscillator based off WaveTrend Oscillator by @LazyBear to visualise 4 different timeframe vwap under 1 chart.
Timeframe can be changed in indicator settings in minutes. Unnecessary waves can be removed by unchecking said TF wave in Style settings.

MTF Bars Back FunctionDesigning higher timeframe tools is challenging. Particularly when you want to apply the higher timeframe lookback to the viewing timeframe.
Here are the problems you run into when you want to use a higher timeframe input:
The output is a string.
On the daily, weekly, or monthly timeframes, the output of the input.resolution variable is "1D", "1W", and "1M".
The 1 minute, 1 day, 1 week, and 1 month timeframes all have an output of 1. Same for the 2m, 2d, 2w, 2m and so on.
I designed this function to automatically calculate the number of candles back that you would need to go back on the timeframe you're viewing to cover the lookback distance on the higher.
It checks if there's a letter on the end of the string and cuts it off, leaving just the number, then converts it from a string to a number.
From there it converts the viewing timeframe and higher timeframe into minutes, divides the two to determine their relationship to one another, then it multiplies the lookback distance of the higher timeframe with the factor and the output is the higher timeframe lookback distance converted into the equivalent bar count on the lower timeframe.
I tried to write it in a way that would make what the function does clear to coders and non-coders so it can be modified to suit your purpose. My initial use case was to us this as way of determining a lower timeframe offset for lines that were cast based on previous high timeframe bars. You could use it for any kind of MTF indicator where you want to know how many bars back you need on the low timeframe to achieve the higher timeframe equivalent. For example, if you wanted to create a multi-timeframe moving average, you would use the output as the length of the moving average.
I used a tuple output for the purpose of demonstration, but this can be reduced to a single relevant output.
Hope you find it useful. It's nice when you don't have to fight against multiple resolutions.
Let me know what you think. Is there a better way to go about it?
Trade well.
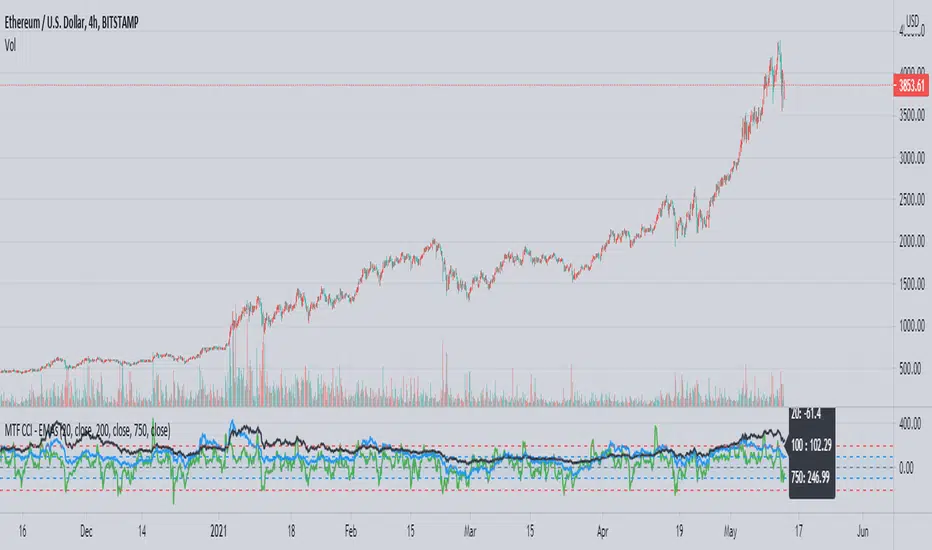
MTF CCI using EMAsThis is a CCI script adapted from 'CCI w EMA by Rick3712' which removes the EMA of the CCI and adds different sized CCI results to the same plot. An info box is also added for easy reference of current values.
CCI is a useful way to see the price's relation to moving averages in a different way, and being able to see the trend strength over time using the larger CCI allows a trader to make better informed decisions when reaching oversold or overbought conditions in relation to the shorter EMAs, such as the 20. You can also see patterns in a trend's strength easier by comparing the movements and levels to find likely areas of a pullback or buying opportunity.
In the example you can see a common level in ETH's parabolic movement on the 4h 750 EMA and 200 EMA that indicates a likely correction area.
Squeeze Momentum Indicator MTF with alerts [lazy bear]MTF version of the popular squeeze momentum indicator, created and shared by Lazy Bear

MTF Oscillator Framework [PineCoders]This framework allows Pine coders to quickly build a complete multi-timeframe oscillator from any calculation producing values around a centerline, whether the values are bounded or not. Insert your calculation in the script and you have a ready-to-publish MTF Oscillator offering a plethora of presentation options and features.
█ HOW TO USE THE FRAMEWORK
1 — Insert your calculation in the `f_signal()` function at the top of the "Helper Functions" section of the script.
2 — Change the script's name in the `study()` declaration statement and the `alertcondition()` text in the last part of the "Plots" section.
3 — Adapt the default value used to initialize the CENTERLINE constant in the script's "Constants" section.
4 — If you want to publish the script, copy/paste the following description in your new publication's description and replace the "OVERVIEW" section with a description of your calculations.
5 — Voilà!
═════════════════════════════════════════════════════════════════════════
█ OVERVIEW
This oscillator calculates a directional value of True Range. When a bar is up, the positive value of True Range is used. A negative value is used when the bar is down. When there is no movement during the bar, a zero value is generated, even if True Range is different than zero. Because the unit of measure of True Range is price, the oscillator is unbounded (it does not have fixed upper/lower bounds).
True Range can be used as a metric for volatility, but by using a signed value, this oscillator will show the directional bias of progressively increasing/decreasing volatility, which can make it more useful than an always positive value of True Range.
The True Range calculation appeared for the first time in J. Welles Wilder's New Concepts in Technical Trading Systems book published in 1978. Wilder's objective was to provide a reliable measure of the effective movement—or range—between two bars, to measure volatility. True Range is also the building block used to calculate ATR (Average True Range), which calculates the average of True Range values over a given period using the `rma` averaging method—the same used in the calculation of another of Wilder's remarkable creations: RSI.
█ CONCEPTS
This oscillator's design stems from a few key concepts.
Relative Levels
Other than the centerline, relative rather than absolute levels are used to identify levels of interest. Accordingly, no fixed levels correspond to overbought/oversold conditions. Relative levels of interest are identified using:
• A Donchian channel (historical highs/lows).
• The oscillator's position relative to higher timeframe values.
• Oscillator levels following points in time where a divergence is identified.
Higher timeframes
Two progressively higher timeframes are used to calculate larger-context values for the oscillator. The rationale underlying the use of timeframes higher than the chart's is that, while they change less frequently than the values calculated at the chart's resolution, they are more meaningful because more work (trader activity) is required to calculate them. Combining the immediacy of values calculated at the chart's resolution to higher timeframe values achieves a compromise between responsiveness and reliability.
Divergences as points of interest rather than directional clues
A very simple interpretation of what constitutes a divergence is used. A divergence is defined as a discrepancy between any bar's direction and the direction of the signal line on that same bar. No attempt is made to attribute a directional bias to divergences when they occur. Instead, the oscillator's level is saved and subsequent movement of the oscillator relative to the saved level is what determines the bullish/bearish state of the oscillator.
Conservative coloring scheme
Several additive coloring conditions allow the bull/bear coloring of the oscillator's main line to be restricted to specific areas meeting all the selected conditions. The concept is built on the premise that most of the time, an oscillator's value should be viewed as mere noise, and that somewhat like price, it only occasionally conveys actionable information.
█ FEATURES
Plots
• Three lines can be plotted. They are named Main line , Line 2 and Line 3 . You decide which calculation to use for each line:
• The oscillator's value at the chart's resolution.
• The oscillator's value at a medium timeframe higher than the chart's resolution.
• The oscillator's value at the highest timeframe.
• An aggregate line calculated using a weighed average of the three previous lines (see the Aggregate Weights section of Inputs to configure the weights).
• The coloring conditions, divergence levels and the Hi/Lo channel always apply to the Main line, whichever calculation you decide to use for it.
• The color of lines 2 and 3 are fixed but can be set in the "Colors" section of Inputs.
• You can change the thickness of each line.
• When the aggregate line is displayed, higher timeframe values are only used in its calculation when they become available in the chart's history,
otherwise the aggregate line would appear much later on the chart. To indicate when each higher timeframe value becomes available,
a small label appears near the centerline.
• Divergences can be shown as small dots on the centerline.
• Divergence levels can be shown. The level and fill are determined by the oscillator's position relative to the last saved divergence level.
• Bull/bear markers can be displayed. They occur whenever a new bull/bear state is determined by the "Main Line Coloring Conditions".
• The Hi/Lo (Donchian) channel can be displayed, and its period defined.
• The background can display the state of any one of 11 different conditions.
• The resolutions used for the higher timeframes can be displayed to the right of the last bar's value.
• Four key values are always displayed in the Data Window (fourth icon down to the right of your chart):
oscillator values for the chart, medium and highest timeframes, and the oscillator's instant value before it is averaged.
Main Line Coloring Conditions
• Nine different conditions can be selected to determine the bull/bear coloring of the main line. All conditions set to "ON" must be met to determine the bull/bear state.
• A volatility state can also be used to filter the conditions.
• When the coloring conditions and the filter do not allow for a bull/bear state to be determined, the neutral color is used.
Signal
• Seven different averages can be used to calculate the average of the oscillator's value.
• The average's period can be set. A period of one will show the instant value of the oscillator,
provided you don't use linear regression or the Hull MA as they do not work with a period of one.
• An external signal can be used as the oscillator's instant value. If an already averaged external value is used, set the period to one in this indicator.
• For the cases where an external signal is used, a centerline value can be set.
Higher Timeframes
• The two higher timeframes are named Medium timeframe and Highest timeframe . They can be determined using one of three methods:
• Auto-steps: the higher timeframes are determined using the chart's resolution. If the chart uses a seconds resolution, for example,
the medium and highest resolutions will be 15 and 60 minutes.
• Multiples: the timeframes are calculated using a multiple of the chart's resolution, which you can set.
• Fixed: the set timeframes do not change with the chart's resolution.
Repainting
• Repainting can be controlled separately for the chart's value and the higher timeframe values.
• The default is a repainting chart value and non-repainting higher timeframe values. The Aggregate line will thus repaint by default,
as it uses the chart's value along with the higher timeframes values.
Aggregate Weights
• The weight of each component of the Aggregate line can be set.
• The default is equal weights for the three components, meaning that the chart's value accounts for one third of the weight in the Aggregate.
High Volatility
• This provides control over the volatility filter used in the Main line's coloring conditions and the background display.
• Volatility is determined to be high when the short-term ATR is greater than the long-term ATR.
Colors
• You can define your own colors for all of the oscillator's plots.
• The default colors will perform well on both white and black chart backgrounds.
Alerts
• An alert can be defined for the script. The alert will trigger whenever a bull/bear marker appears in the indicator's display.
The particular combination of coloring conditions and the display of bull/bear markers when you create the alert will thus determine when the alert triggers.
Once the alerts are created, subsequent changes to the conditions controlling the display of markers will not affect the existing alert(s).
• You can create multiple alerts from this script, each triggering on different conditions.
Backtesting & Trading Engine Signal Line
• An invisible plot named "BTE Signal" is provided. It can be used as an entry signal when connected to the PineCoders Backtesting & Trading Engine as an external input.
It will generate an entry whenever a marker is displayed.
Look first. Then leap.

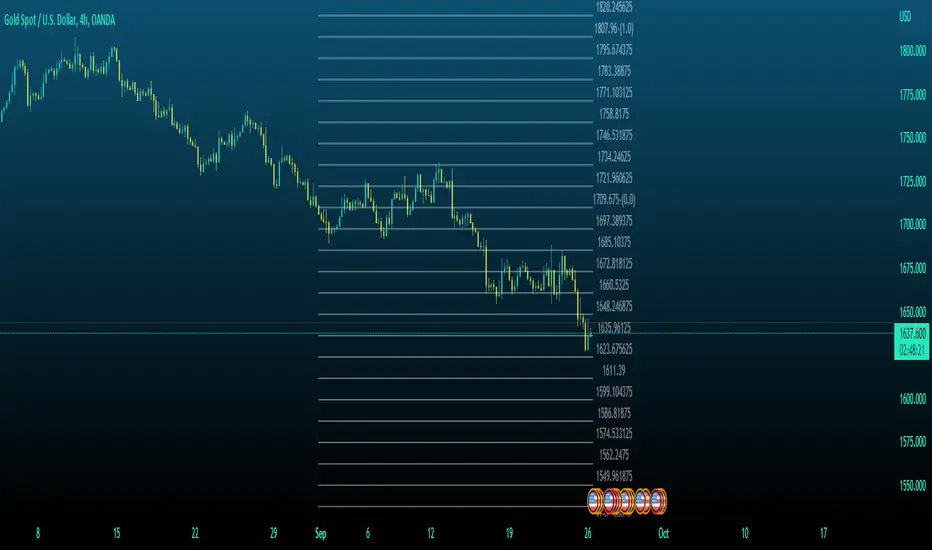
MTF VWAP + Fibo Incremental deviationsI made a Fibo variant of my first script "VWAPs + devs" :
This new indicator give you the possibility to plot multi timeframes VWAP (D, W, M, 3M and 12M ) and Fibo deviations for each one.
VWAP is a powerfull indicator which is used by big players to get informations if the price is "overbought" or "oversold". Deviations give the opportunity to have supports and resistances in those "over"-zones.
I searched for better results and found those defaults values :
Fib 1 level : 0.618
Fib 2 level : 0.786
Fib 3 level : 1.000
Fib 4 level : 1.618
Fib 5 level : 2.618
In the thumbnail, we can see that the 1.618 deviation level made a great support on the last uptrend for BTCUSDT .
You can change each values but low ones as 0.382 and 0.5 don't give really interesting supports/resistances.
I made this script as clear and simple as possible with only one menu in the parameters.
Some examples of what you can do :
BTCUSDT (Binance) H4 / D, W, M, 3M ,12M VWAP without devs
BTCUSDT (Binance) M5 / Daily VWAP + Fibo devs
Hope this will be useful for you !

MTF Stoch RSI ScreenerDisplays when multiple timeframes of Stochastic RSI are overbought/oversold. Multiple consecutive timeframes being overbought/oversold can signify a short term top or bottom.
Thanks to Micse in Pinescripters telegram who helped remove a few errors from this.

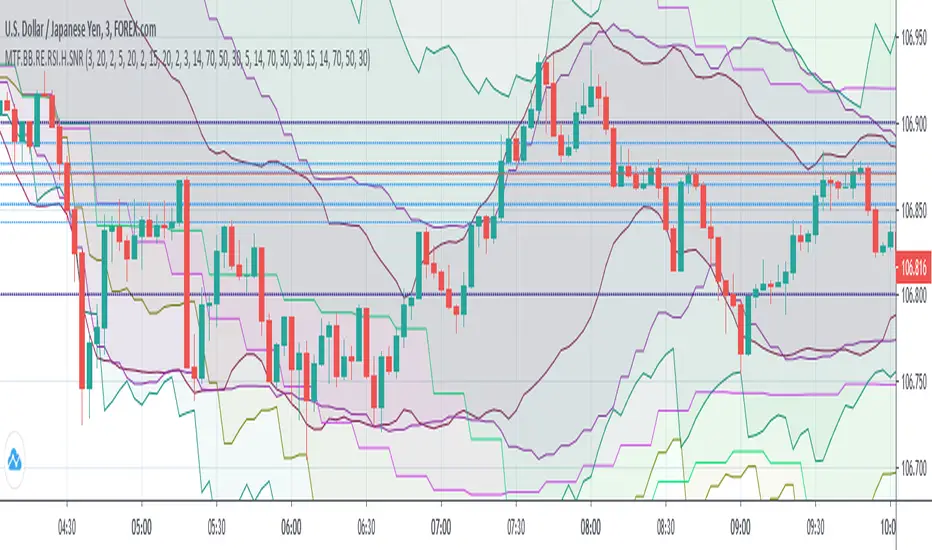
(MTF) Bollinger Bands + RE RSIs + Hidden Supports & ResistancesI merged some of my previous written indicators, because a combination of multi-timeframe Bollinger Bands, RE RSI and Resistance/Support levels could help a lot.
Don't forget to add my other useful indicator (Classical SnR) to the chart to maximize your profit!
mtf nori spThis is an indicator of nori_nosuke's technique.
If you check the check box of EMA ?, it becomes EMA .
If it is not checked, it is SMA .
Added multi-time flame.
If you put a chuck in the chuck box of 'mtf?', It will be changed to the time displayed below.

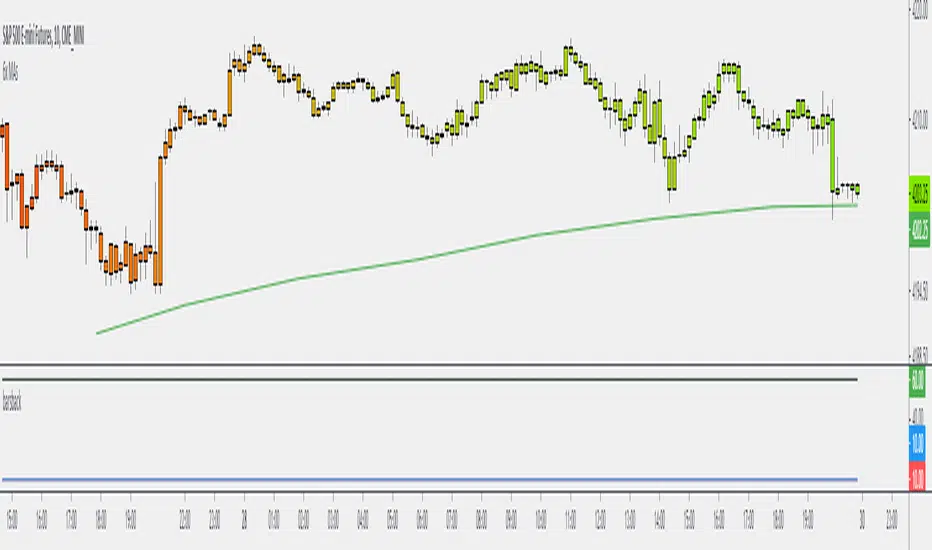
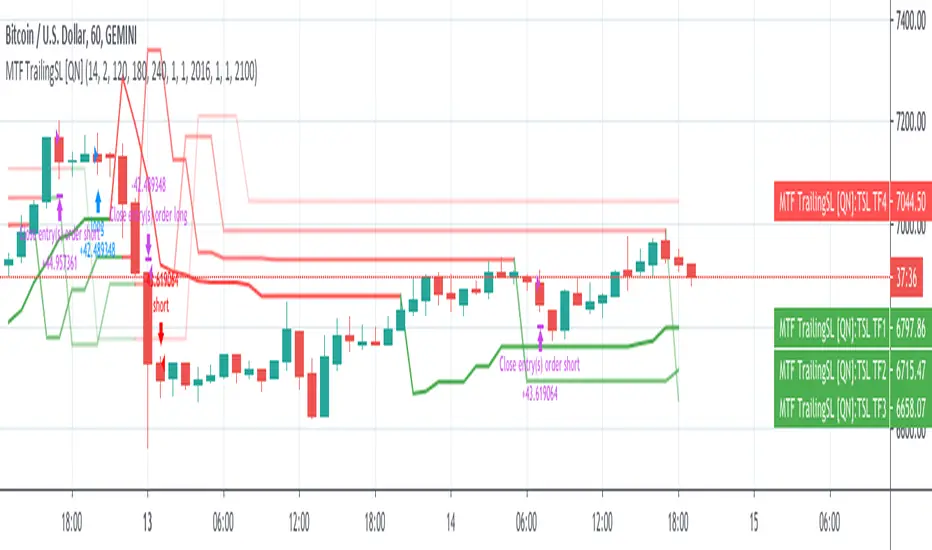
MTF Trailing SL Strategy [QuantNomad]This is a Multi-Timeframe version of my Trailing SL Strategy.
Few weeks ago I published Trailing SL Strategy. There I used only basic Trailing SL to enter positions.
It worked pretty well so I tried to work on it a bit. I thought what if you can use the same ATR TSL on different timeframes and combine them into one signal.
In this strategy you can use only ATR stops and choose 3 other higher timeframes in addition to your current timeframe.
You'll see Trailing SL plotted on the chart form all these timeframes.
Entry Long position if all 4 time-frames agree on long signal.
Exit Long positions when at least 2 time-frames disagree on long signal.
Entry to Short position if all 4 time-frames agree on Short signal.
Exit from Short positions when at least 2 time-frames disagree on Short signal.
Here is the link to my basic Trailing SL Strategy:
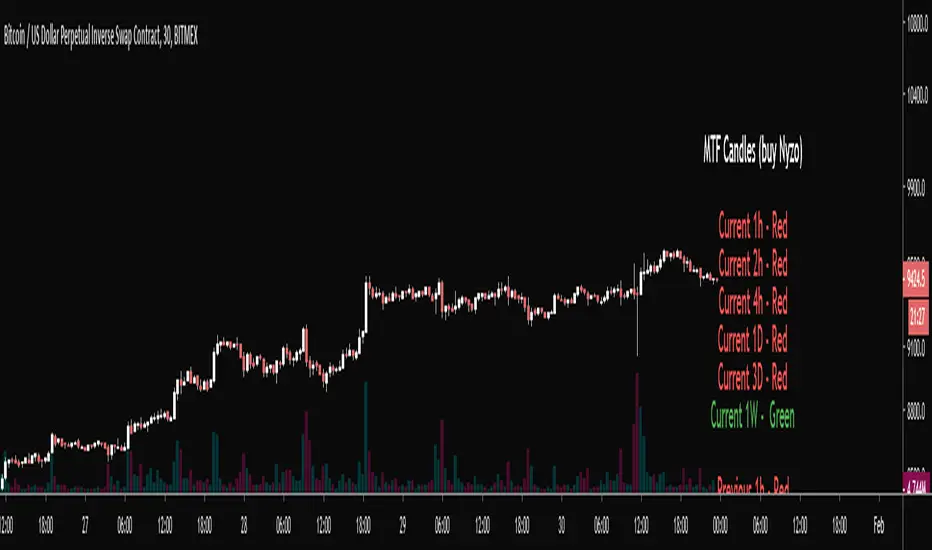
MTF Candles (Nyzo Style)This script is straight forward.
Just practicing using the security function cause I'm terrified of it.
Thanks, Daveatt for the infopanel function with the color switcher
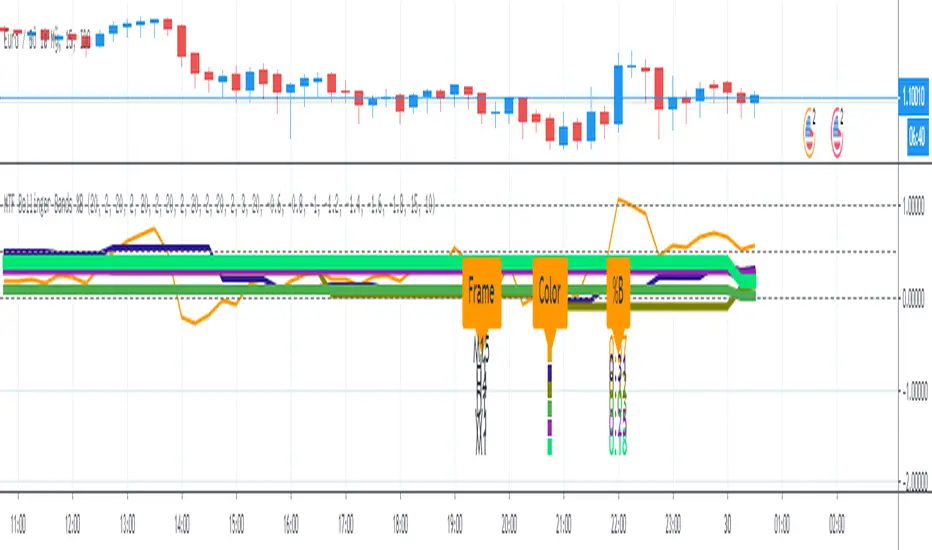
MTF Bollinger Bands %BMulti Time Frame (MTF) Bollinger Bands %B option:
1. On/ Off Bollinger Bands %B - M15 (15-Minute)
2. On/Off Bollinger Bands %B - H1 (1-Hour)
3. On/Off Bollinger Bands %B - H4 (4 Hour)
4. On/Off Bollinger Bands %B - D1 (Daily)
5. On/Off Bollinger Bands %B - W1 (Weekly)
6. On/Off Bollinger Bands %B - M1 (Monthly)
7. On/Off Panel Info: Color note & %B value
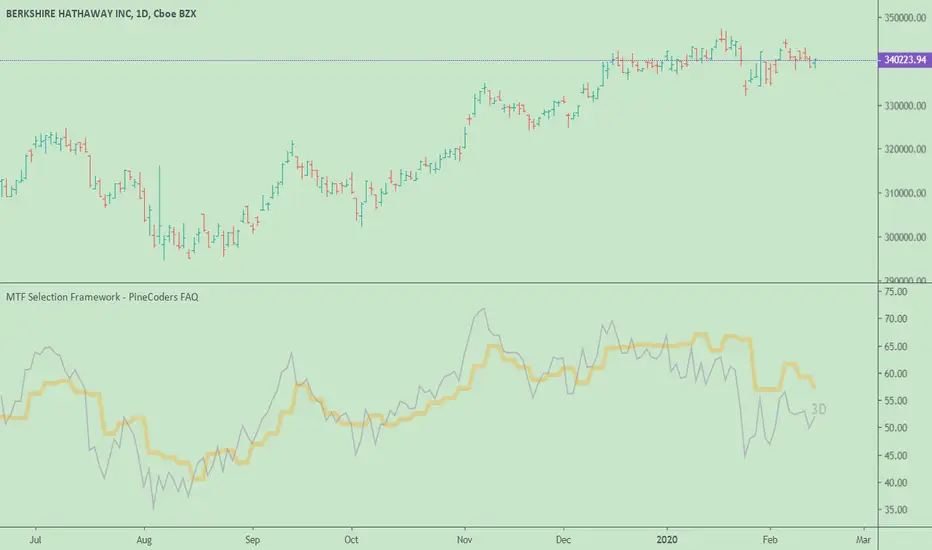
MTF Selection Framework - PineCoders FAQOur MTF Selection Framework allows Pine coders to add multi-timeframe capabilities to their script with the following features:
► Timeframe selection
The higher timeframe can be selected using 3 different ways:
• By steps (60 min., 1D, 3D, 1W, 1M, 1Y).
• As a multiple of the current chart's resolution, which can be fractional, so 3.5 will work.
• Fixed.
► Non-repainting or Repainting mode can be selected.
► Smoothing of the HTF line
Can be turned on/off and a smoothing factor allows the user to select the degree of smoothing he requires.
The framework is used here to create a higher timeframe version of a simple RSI line, but it can be used to access HTF information for almost any signal.
Functions used
f_resInMinutes()
Converts the current timeframe.multiplier plus the TF into minutes of type float.
• In Pine, the timeframe.multiplier is an integer representing the resolution, but a value of 1 can mean one day or one minute. This function converts that information in a standard fractional float minutes format that can then be used by the other functions in the framework.
• If the chart's current resolution is 15 seconds, the function will return 0.25 . If the chart's resolution is one day, it will return 1440 .
f_tfResInMinutes(_resolution)
Returns resolution of _resolution period in minutes.
• This function does the same as f_resInMinutes() , but on the target resolution supplied as a parameter in the timeframe.period string format.
f_resNextStep(_res)
Given a current resolution in fractional float minutes, returns its corresponding stepped HTF in the timeframe.period string format.
• This allows the implementation of the step HTF selection mode.
f_multipleOfRes(_res, _mult)
Given a current resolution in fractional float minutes and a fractional multiplier, returns a multiple of the resolution as a string in "timeframe.period" format usable with "security()".
• A multiple like 3.5 is allowed.
• Note that with seconds resolutions, the result returned is constrained by the discrete seconds resolutions available on TV.
f_htfLabel(_txt, _y, _color)
Used to display a label showing either:
• A warning when the chart's resolution is not lower than the HTF.
• The HTF resolution currently used.
The y position used to position the label will require adaptation to the signal you are using. For use in "overlay = true" mode, a technique that works well is commented out in the code.
Look first. Then leap.