High/Low last 1-3 candlesHere you can display the high and low of the last 1, 2 or 3 candles. The whole thing is updated with every new candle. you can also switch the lines on or off as you wish and adjust the colour of the lines. have fun with it
Buscar en scripts para "low"

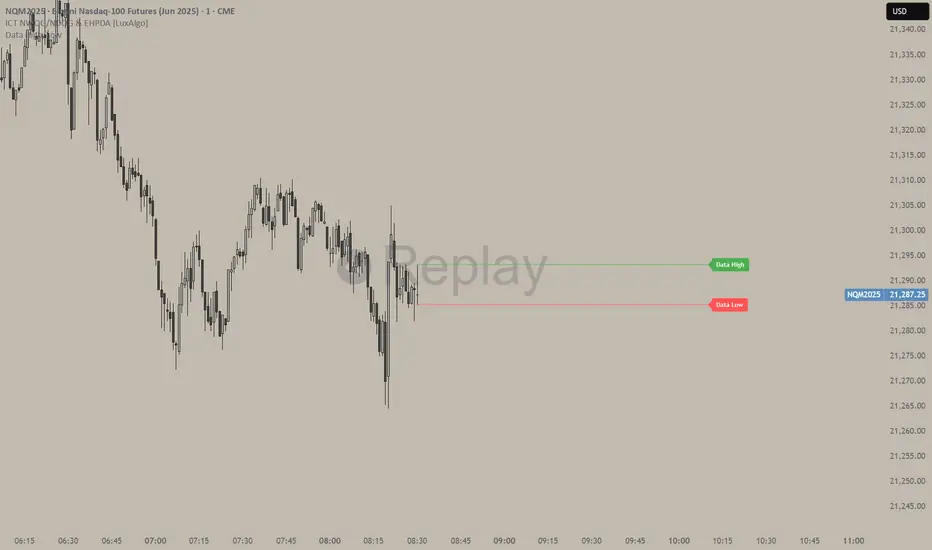
Data High/LowMarks out High and Low of a specified candle.
Intended use for news candle's data high and low.
Time, line color, and line length are customizable in settings options.
Lines are only draw on 1m timeframe and lower.
Range Filter + ATR Strategy (Low Drawdown)Key Features for Low Drawdown:
Range Filter: Identifies trends while filtering out market noise
ATR-based Position Sizing: Adjusts position size based on volatility to risk a fixed percentage of capital
Trailing Stops: Uses ATR-based trailing stops to lock in profits and limit losses
Conservative Risk Parameters: Defaults to 1% risk per trade (adjustable)
Trend Confirmation: Requires two consecutive closes above/below the range filter
How to Use:
The strategy enters long when price is above the upper range filter for two consecutive bars
Enters short when price is below the lower range filter for two consecutive bars
Uses ATR to size positions appropriately for current volatility
Implements trailing stops based on ATR to protect profits
Optimization Tips:
Adjust the Range Filter period based on your timeframe
Modify the risk percentage (1% is conservative)
Tweak the ATR multiple for trailing stops (1.5 is moderate)
Consider adding a time-based exit if drawdown is still too high

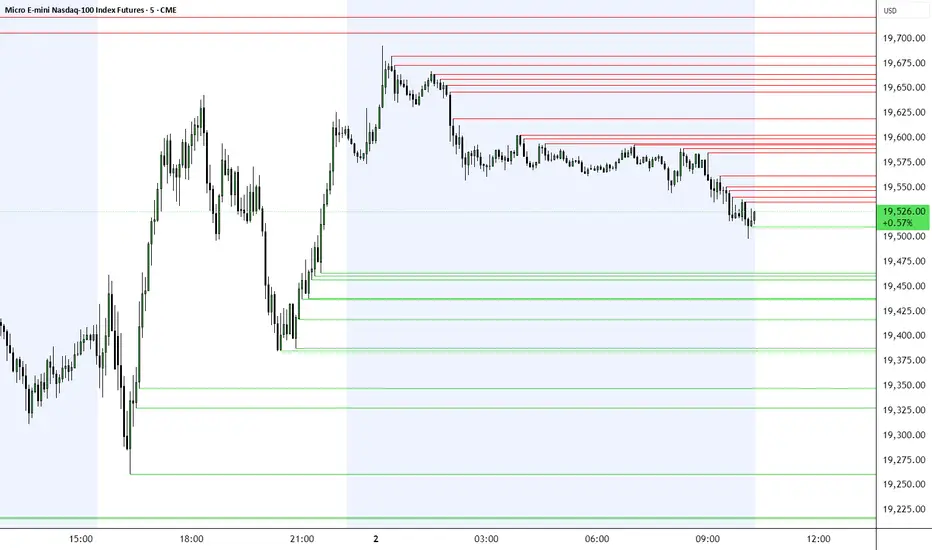
HTF High/Low Targets This script plots the previous Highs and Lows of the 1HR, 4HR, Daily, and Weekly timeframes.
Each level is color-coded, extends across the chart, and includes labels to help you spot key areas of past support and resistance.
Use this tool to:
- Confirm intraday price reactions at HTF zones
- Identify high-probability reversal or breakout areas
- Get notified with built-in alerts when price crosses a level
You can toggle each timeframe level on/off in the settings panel.
Great for:
- Day traders and scalpers who trade off 1-minute or 5-minute charts
-Swing traders looking for confluence with HTF zones
- Anyone using a multi-timeframe analysis approach
Created by @mychaellesliemedia.

High/Low Digit SumNAMAN SHAH
Its about the high low total of a candle only for gold where if highs total is 9 then its a chance that it will not break the high for a long time and it will be a good opportunity for short
And vise versa

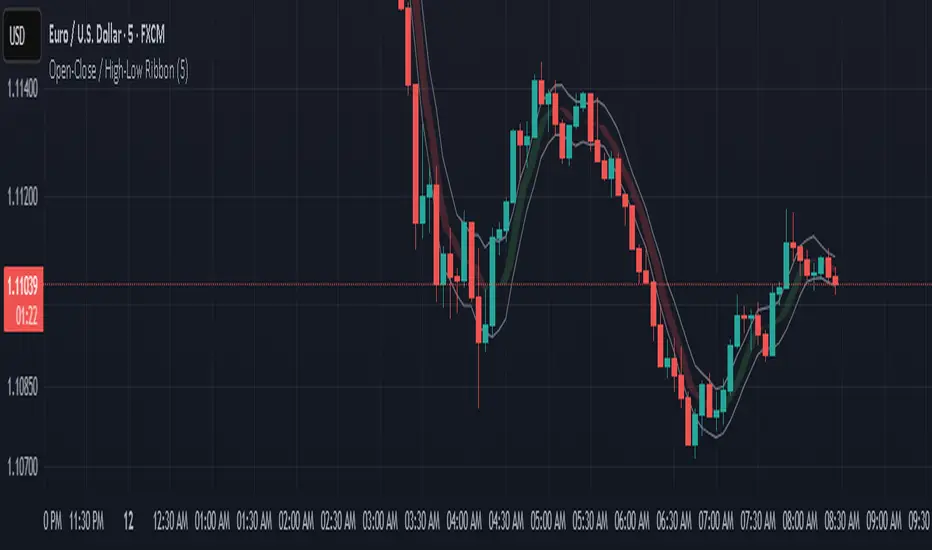
Open-Close / High-Low RibbonThis indicator visualizes smoothed Open, Close, High, and Low price levels as continuous lines, helping users observe underlying price structure with reduced noise. The Open and Close values are shaded to highlight bullish (green) or bearish (red) zones based on their relationship. Smoothing is applied using a simple moving average (SMA) over a user-defined length to make trends easier to interpret. This tool can be useful for identifying directional bias, trend shifts, or areas of support and resistance on any timeframe.
5m Gold Strategy - Session Break + Previous Day High/LowHere is your complete Pine Script v5 code for TradingView that:
Implements your 5-minute Gold breakout strategy.
Uses previous day high/low levels.
Confirms entry based on 15-minute SMA trend (SMA 9 > SMA 21).
Marks session time.
Filters news time (pause trading 15 minutes before/after major red news from ForexFactory).

Bearish Highs & Bullish Lows (Untouched Levels)As the indicator-name already states:
This indicator draws rays from every untouched high of a bear candle and every untouched low of a bull candle.
Levels which are touched are deleted, not on touch, but on the start of the new candle.
Head Hunter HHHead Hunter HH - Advanced Market Structure & Volume Analysis Indicator
This indicator combines volume analysis, price action, and VWAP to identify high-probability trading opportunities across multiple timeframes.
Key Features:
• Smart Volume Analysis: Detects institutional volume patterns using dynamic thresholds
• VWAP-Based Market Structure: Multiple standard deviation bands for precision entry/exit
• Daily Level Integration: Previous day's high, low, close, and current day's open
• Advanced Signal Classification: Regular, Super Strong, and Scalp signals
Signal Types:
1. Regular Signals (White/Purple Triangles)
• Volume-confirmed reversals
• Institutional price levels
• Technical momentum alignment
2. Super Strong Signals (Green/Red Diamonds)
• High-volume breakouts
• Strong momentum confirmation
• Multiple timeframe alignment
3. Scalp Signals (Green/Magenta Circles)
• Quick reversal opportunities
• VWAP deviation analysis
• Volume surge confirmation
Visual Components:
• VWAP with Standard Deviation Bands
• 50 MA (optional)
• Daily Reference Levels
• Color-coded signals based on strength
• Bar color changes on confirmed signals
Best Practices:
• Most effective on higher timeframes (1H+)
• Use with major pairs/instruments
• Combine signals with support/resistance
• Monitor volume confirmation
• Wait for candle close confirmation
This indicator helps identify institutional order flow and high-probability reversal zones by analyzing volume patterns, price action, and market structure, providing traders with multiple confirmation layers before entry.
Note: Results may vary based on market conditions and timeframe selection. Always use proper risk management.

Pre-Market High/Low (Static Lines + Labels)
Pre-Market Range ✅
Draws the Pre-Market High & Low from 4:00 AM to 9:30 AM ET using accurate 1-minute intraday data.
Static Lines 📏
Plots dashed horizontal lines that remain visible all day across all timeframes — including 1m, 5m, 15m, 1h, 4h, and Daily.
Price Labels 🔖
Includes real-time price labels so you can easily reference exact pre-market levels on the chart.
Session Lock 🕒
Lines are locked in after 9:30 AM and remain visible even if you switch timeframes or turn off extended hours.
Trading Utility 🎯
Ideal for identifying key breakout levels, intraday support/resistance zones, and setting risk parameters.

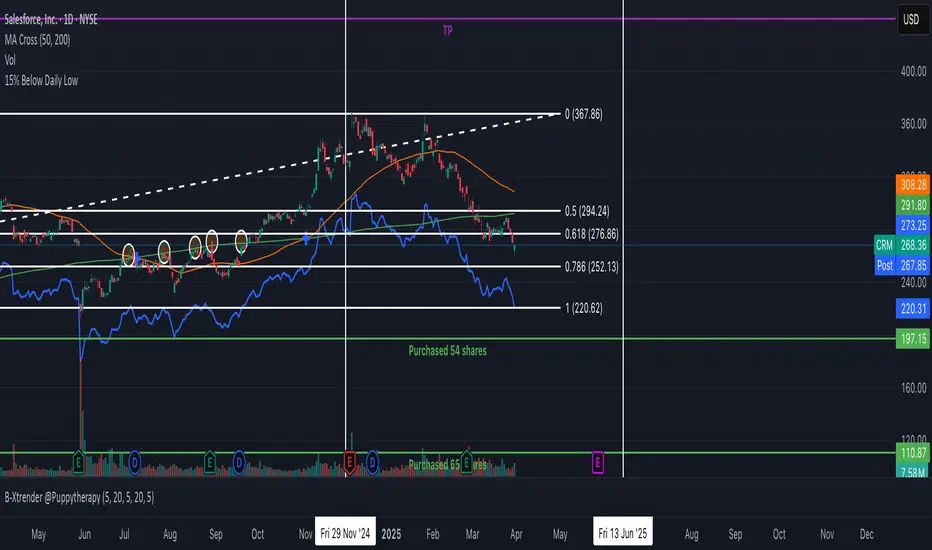
15% Below Daily LowESPP discount pricing (15%) - Line chart that follows the daily low of the chart to show what price you could buy a company stock with the typical discount of 15%.
Cumulative New Highs - New Lows IndicatorThis indicator is designed to track market momentum by calculating and plotting the cumulative sum of 52 weeks High-Low for different indices, alongside a customizable moving average.
Index Selection:
Users can choose from multiple indices, including:
Total Stock Market (default)
NYSE Composite
Nasdaq Composite
S&P 500
Nasdaq 100
Russell 2000
Moving Average Customization:
The script allows you to select between a Simple Moving Average (SMA) or an Exponential Moving Average (EMA) for smoothing the cumulative data. The window length of the moving average is also adjustable, letting you tailor the sensitivity of the trend analysis.
Dynamic Background Plotting:
With the background plot option enabled, the indicator changes the chart's background color dynamically:
Green: When the cumulative sum is above its moving average, suggesting bullish momentum.
Red: When it is below the moving average, indicating bearish conditions.
Visual Representation:
Two key lines are plotted:
Cumulative Index Line: Displayed in a subtle blue, representing the aggregated market movement.
Moving Average Line: Shown in an orange tone, offering a smoothed perspective that aids in identifying trend shifts.
Inspiration:
I took inspiration from the indicator made by YoxTrades (I can't put links, but you can check their profile) and added a few features I wanted on top of it.

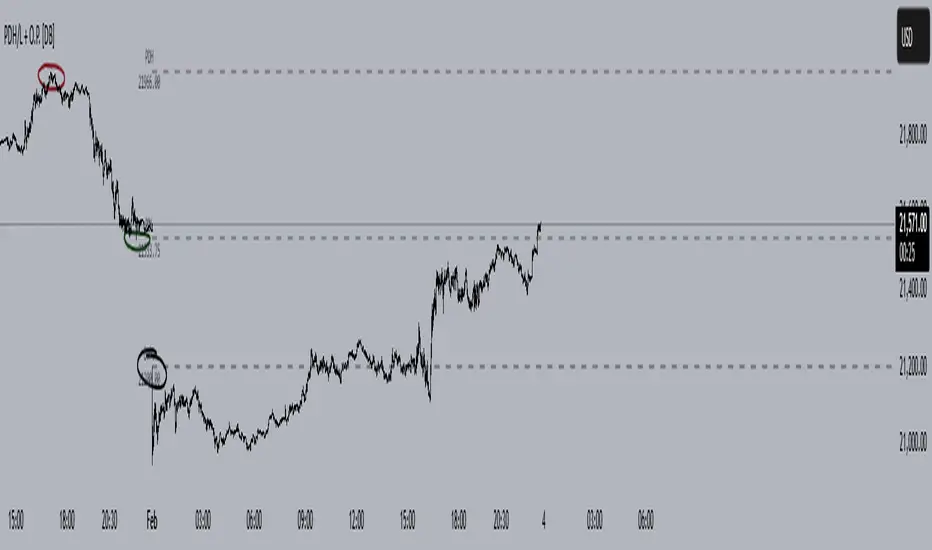
Previous Day High, Low + Today's Opening Price [DB]This indicator plots horizontal reference lines showing three price levels:
Previous Day's High (PDH) – Dark red line by default
Previous Day's Low (PDL) – Dark green line by default
Today's Opening Price (O.P.) – Black line by default
Settings & Customization
Adjust line colors, width (default: 2px), and transparency (30% by default).
Choose line styles: Solid, Dashed, or Dotted.
Labels:
Toggle labels (PDH/PDL/O.P.) on/off.
Optional price values below labels.
The goal of this indicator is to simplify tracking potentionally important daily levels without manual drawing.
Works on all timeframes (from 1-minute to weekly charts). The levels auto-update daily at market open and they are non-repainting (historical levels stay fixed).
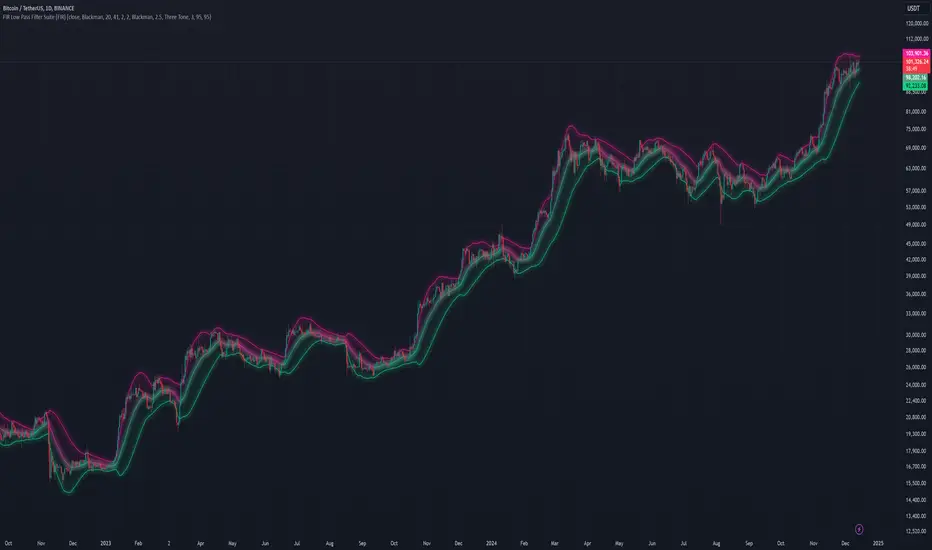
FIR Low Pass Filter Suite (FIR)The FIR Low Pass Filter Suite is an advanced signal processing indicator that applies finite impulse response (FIR) filtering techniques to price data. At its core, the indicator uses windowed-sinc filtering, which provides optimal frequency response characteristics for separating trend from noise in financial data.
The indicator offers multiple window functions including Kaiser, Kaiser-Bessel Derived (KBD), Hann, Hamming, Blackman, Triangular, and Lanczos. Each window type provides different trade-offs between main-lobe width and side-lobe attenuation, allowing users to fine-tune the frequency response characteristics of the filter. The Kaiser and KBD windows provide additional control through an alpha parameter that adjusts the shape of the window function.
A key feature is the ability to operate in either linear or logarithmic space. Logarithmic filtering can be particularly appropriate for financial data due to the multiplicative nature of price movements. The indicator includes an envelope system that can adaptively calculate bands around the filtered price using either arithmetic or geometric deviation, with separate controls for upper and lower bands to account for the asymmetric nature of market movements.
The implementation handles edge effects through proper initialization and offers both centered and forward-only filtering modes. Centered mode provides zero phase distortion but introduces lag, while forward-only mode operates causally with no lag but introduces some phase distortion. All calculations are performed using vectorized operations for efficiency, with carefully designed state management to handle the filter's warm-up period.
Visual feedback is provided through customizable color gradients that can reflect the current trend direction, with optional glow effects and background fills to enhance visibility. The indicator maintains high numerical precision throughout its calculations while providing smooth, artifact-free output suitable for both analysis and visualization.
Equal High and Low FinderThe Matching Close / Equal High Low Finder indicator identifies candles within a specified lookback period that have matching close prices while satisfying specific conditions:
Matching Candle Types:
Only matches bullish candles (close > open) with other bullish candles.
Only matches bearish candles (close < open) with other bearish candles.
Intermediate Candle Condition:
Bullish matches: No intermediate candle between the two matching candles can have a higher close price than the first candle.
Bearish matches: No intermediate candle between the two matching candles can have a lower close price than the first candle.
Gap Between Matches: Ensures at least one intermediate candle exists with a close price different from the matched candles.
Customizable Features:
Adjustable lookback period.
Configurable line style, width, and colors for bullish and bearish matches.
This indicator visually connects the matching candles with lines, offering a clear visual cue for price behavior.

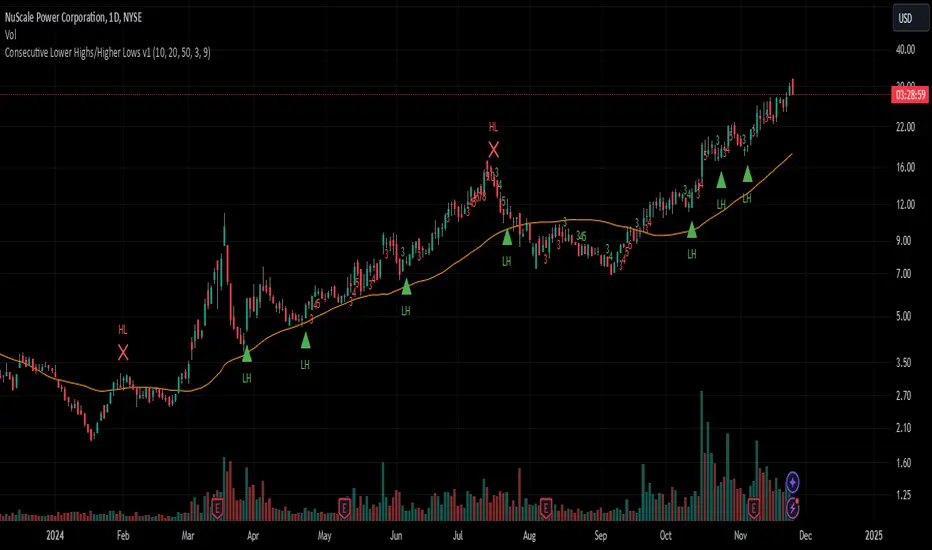
Consecutive Lower Highs/Higher Lows v1 [tradinggeniusberlin]This indicator counts the lower highs and higher low streaks. If the streak is above a certain threshold a buy or exit arrow is shown.
Idea:
The probability of a reversal is rising the more lower highs the asset had already because if mean reversion tendencies of asset prices. Especially in uptrend above the 20ma and/or 50ma.
How to use it:
In Uptrends, lower high streak of 3 or more, enter at first new high.
High/Low Location Frequency [LuxAlgo]The High/Low Location Frequency tool provides users with probabilities of tops and bottoms at user-defined periods, along with advanced filters that offer deep and objective market information about the likelihood of a top or bottom in the market.
🔶 USAGE
There are four different time periods that traders can select for analysis of probabilities:
HOUR OF DAY: Probability of occurrence of top and bottom prices for each hour of the day
DAY OF WEEK: Probability of occurrence of top and bottom prices for each day of the week
DAY OF MONTH: Probability of occurrence of top and bottom prices for each day of the month
MONTH OF YEAR: Probability of occurrence of top and bottom prices for each month
The data is displayed as a dashboard, which users can position according to their preferences. The dashboard includes useful information in the header, such as the number of periods and the date from which the data is gathered. Additionally, users can enable active filters to customize their view. The probabilities are displayed in one, two, or three columns, depending on the number of elements.
🔹 Advanced Filters
Advanced Filters allow traders to exclude specific data from the results. They can choose to use none or all filters simultaneously, inputting a list of numbers separated by spaces or commas. However, it is not possible to use both separators on the same filter.
The tool is equipped with five advanced filters:
HOURS OF DAY: The permitted range is from 0 to 23.
DAYS OF WEEK: The permitted range is from 1 to 7.
DAYS OF MONTH: The permitted range is from 1 to 31.
MONTHS: The permitted range is from 1 to 12.
YEARS: The permitted range is from 1000 to 2999.
It should be noted that the DAYS OF WEEK advanced filter has been designed for use with tickers that trade every day, such as those trading in the crypto market. In such cases, the numbers displayed will range from 1 (Sunday) to 7 (Saturday). Conversely, for tickers that do not trade over the weekend, the numbers will range from 1 (Monday) to 5 (Friday).
To illustrate the application of this filter, we will exclude results for Mondays and Tuesdays, the first five days of each month, January and February, and the years 2020, 2021, and 2022. Let us review the results:
DAYS OF WEEK: `2,3` or `2 3` (for crypto) or `1,2` or `1 2` (for the rest)
DAYS OF MONTH: `1,2,3,4,5` or `1 2 3 4 5`
MONTHS: `1,2` or `1 2`
YEARS: `2020,2021,2022` or `2020 2021 2022`
🔹 High Probability Lines
The tool enables traders to identify the next period with the highest probability of a top (red) and/or bottom (green) on the chart, marked with two horizontal lines indicating the location of these periods.
🔹 Top/Bottom Labels and Periods Highlight
The tool is capable of indicating on the chart the upper and lower limits of each selected period, as well as the commencement of each new period, thus providing traders with a convenient reference point.
🔶 SETTINGS
Period: Select how many bars (hours, days, or months) will be used to gather data from, max value as default.
Execution Window: Select how many bars (hours, days, or months) will be used to gather data from
🔹 Advanced Filters
Hours of day: Filter which hours of the day are excluded from the data, it accepts a list of hours from 0 to 23 separated by commas or spaces, users can not mix commas or spaces as a separator, must choose one
Days of week: Filter which days of the week are excluded from the data, it accepts a list of days from 1 to 5 for tickers not trading weekends, or from 1 to 7 for tickers trading all week, users can choose between commas or spaces as a separator, but can not mix them on the same filter.
Days of month: Filter which days of the month are excluded from the data, it accepts a list of days from 1 to 31, users can choose between commas or spaces as separator, but can not mix them on the same filter.
Months: Filter months to exclude from data. Accepts months from 1 to 12. Choose one separator: comma or space.
Years: Filter years to exclude from data. Accepts years from 1000 to 2999. Choose one separator: comma or space.
🔹 Dashboard
Dashboard Location: Select both the vertical and horizontal parameters for the desired location of the dashboard.
Dashboard Size: Select size for dashboard.
🔹 Style
High Probability Top Line: Enable/disable `High Probability Top` vertical line and choose color
High Probability Bottom Line: Enable/disable `High Probability Bottom` vertical line and choose color
Top Label: Enable/disable period top labels, choose color and size.
Bottom Label: Enable/disable period bottom labels, choose color and size.
Highlight Period Changes: Enable/disable vertical highlight at start of period

Previous Day Max 15-Mins Move High/LowIntroduction
This TradingView script is designed to help traders quickly identify significant price movement levels from the previous trading day based on the 15-minute time frame. It finds the largest high-to-low range of any 15-minute candle from the prior day and draws horizontal lines at those levels. These levels can help traders set potential support and resistance zones, aiding in intraday trading decisions and market analysis.
In many trading strategies, significant levels from previous sessions are crucial for determining potential support and resistance points. By identifying the largest price move from the prior day’s 15-minute candles, this script can highlight areas of market interest where volatility was at its highest. Traders can use these levels to:
Anticipate potential reversal points.
Plan entries and exits based on key support and resistance.
Gauge market sentiment by observing how the price reacts to these levels during the current session.
This can be especially valuable in fast-paced trading environments or when analyzing shorter time frames. The lines extend across all time frames, so you can use this script on higher time frames as well to see previous-day levels while zooming out.

High and Low in Selected Time Window (Chart's Timezone)Simple indicator for finding the high and low in any selected time period. to use enter the start time by selecting the hour and minute and enter the end time the same.
a line will be drawn along with the price and a timestamp of when it occurred. shows multiple days of the same time period. Useful for observing ICT Macros, 6VS10 etc.

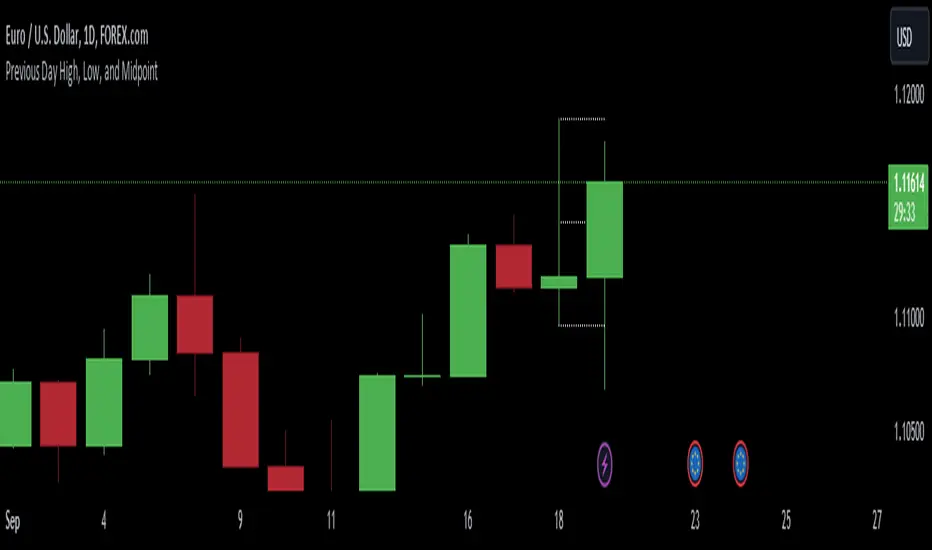
Previous Day High, Low, and Midpointshows yesterdays high low and midpoint elimainating the need to use the fib tool every day
High Low Lines (500 candle 5min)This TradingView script is designed to visualize the highest high and the lowest low from the previous 576 candles on the chart. It draws horizontal lines representing these values and updates them at a specific time each day.

Previous Day High and LowPlots previous and the day before days' high and low for all days, not just today.

Cumulative New Highs - New LowsIndicator that plots the cumulative number of 52-Week New Highs minus New Lows with an added moving average. Settings allow the choice between S&P 500, Nasdaq 100 or the Overall Market as Index. You can also customize the length of the moving average.
