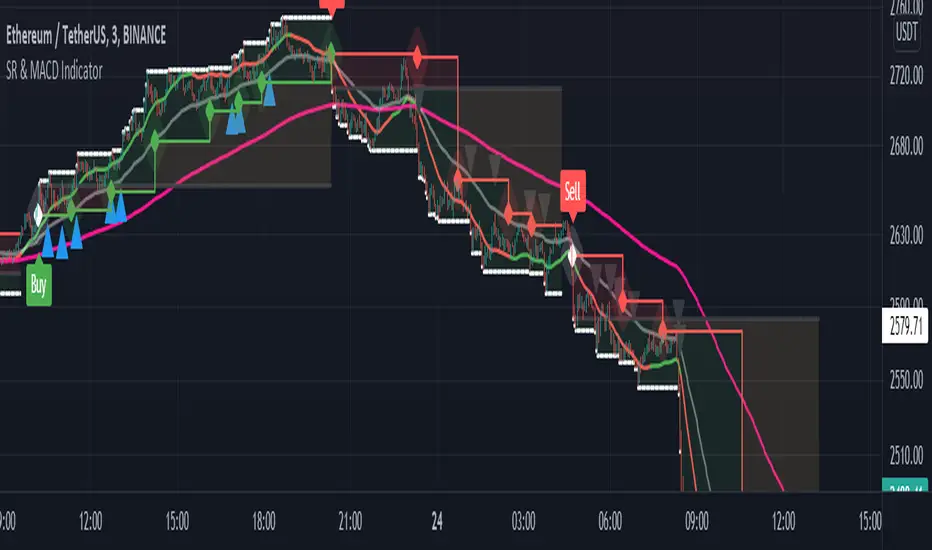
Support and Resistance with MACD IndicatorOriginal script from ©akpaswaniitk. I just added MACD to filter out bad trades and alert function so that we get notified whenever indicator gives us an entry signal. Most of the false breakout has been removed but the remaining ones only pop up during consolidation, so it's wait for the retest before entry. Works better in continuous market. Also look at the color of EMA for further confirmation, only focus on buy side when EMA is green and sell when EMA is red or when after the buy signal EMA changes color from red to green. These are the highly profitable setups I've found with this indicator.
Signals
Red or Green solid line with diamond are trailing stoploses
dotted black line is entry level
dotted white line is optimal exit
Buscar en scripts para "indicator"
20 SMA based Bull/Bear sentiment indicatorThis script is only doing one thing, plots the 20 SMA and based on whether the asset's price is above or below of the SMA it changes the color of the SMA and the background's color.
Helping it to visualize whether from the 20 SMA's point of view we are in a Bull or a Bear trend.
I created this because I myself use this SMA with Bitcoin on the weekly time frame to identify the macro trend on the weekly.
IMO this is a good crypto market sentiment indicator.

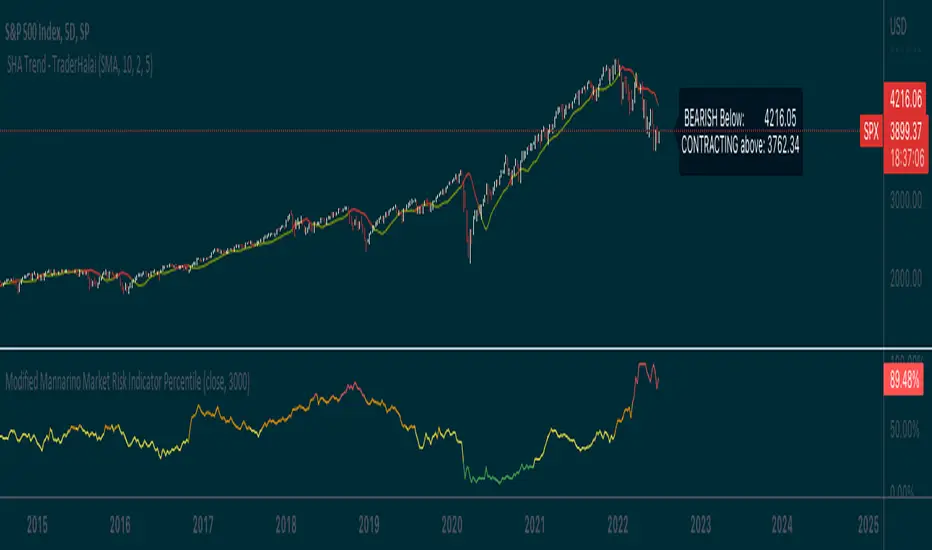
Modified Mannarino Market Risk IndicatorThis indicator is meant to give an overall indication of risk and a very basic implementation of the modified mannarino market risk indicator. I take no credit for the original formula, and just decided to hack this together so that it could be useful to the community
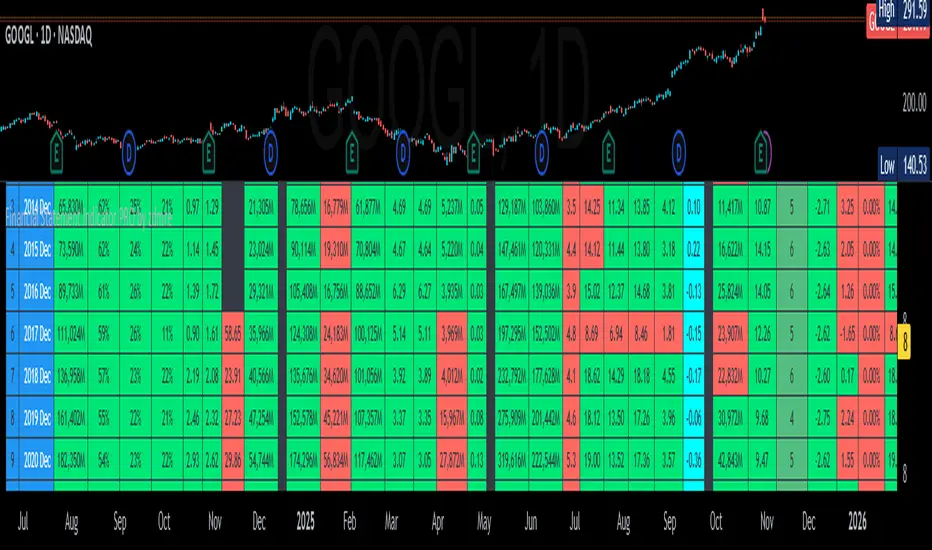
Financial Statement Indicator by zdmreKnowing how to work with the datas in a company's financial statements is an essential skill for stock investors. The meaningful interpretation and analysis of balance sheets, income statements, and cash flow statements to discern a company's investment qualities is the basis for smart investment choices.
You can access to the financials tables of the companies as a summary with this indicator.
3 Tables;
Income Statement Table:
Revenue
Net Profit
EPS
EPS-D
P/E
Balance Sheet Table:
Current Asset
Total Asset
Total Equity
Book Value per Share
Total Debt
Debt/Equity
Statistics & Cash Flow Table:
Return On Equity
Return On Asset
Return On Invested Capital
Quick Ratio
Free Cash Flow
[blackcat] L2 Intraday R-Breaker IndicatorLevel: 2
Background
The famous R-Breaker is a short-term intraday trading strategy that combines trend and reversal trading methods.
Function
-1) When the intraday highest price exceeds the observed selling price, and the intraday price drops and further breaks below the support line constituted by the reverse selling price, a reversal strategy is adopted, that is, at this point (backhand, open position) ) Short;
-2) When the intraday lowest price is lower than the observed purchase price, and the intraday price rebounds and further exceeds the resistance line constituted by the reverse purchase price, a reversal strategy is adopted, that is, at this point (backhand, open position) ) Long;
-3) In the case of a short position, if the intraday price exceeds the breakthrough buying price, a trend strategy is adopted, that is, open a long position at that point;
-4) In the case of a short position, if the intraday price breaks below the selling price, a trend strategy is adopted, that is, open a short position at that point.
Key Signal
pivot --> pivot pionts
reverse_sell_price --> pivot points,reverse selling prices: senter
observe_sell_price --> bserve selling price: ssetup
break_bid_price --> breakthrough bid price: bbreak1
reversal_bid_price --> reversal bid price: bbreak2
observe_buy_price --> observe buy price: bsetup
break_sell_price --> break sell price: sbreak
Remarks
This is a Level 2 free and open source indicator.
Feedbacks are appreciated.

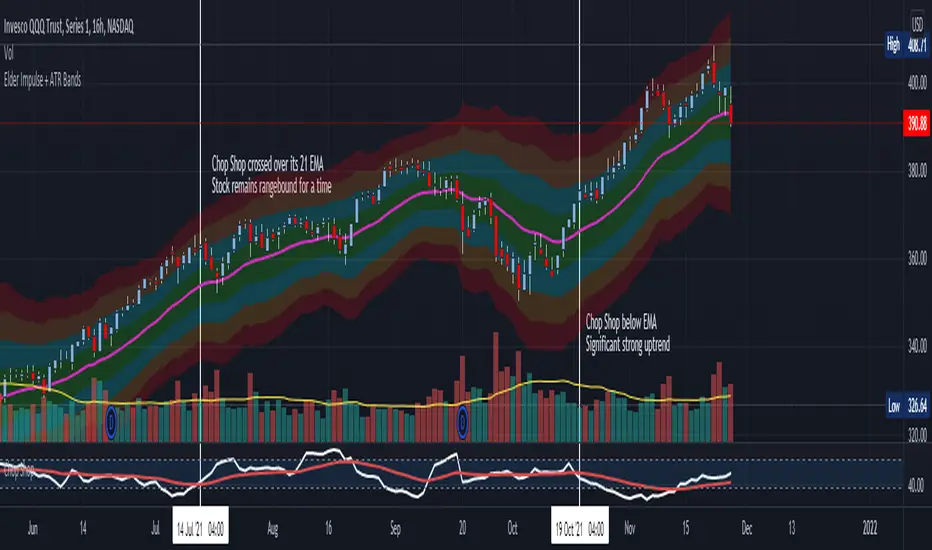
Chop Shop Indicator for Options TradersAs always, this is not financial advice and use at your own risk. Trading is risky and can cost you significant sums of money if you are not careful. Make sure you always have a proper entry and exit plan that includes defining your risk before you enter a trade.
This is for all of you options traders out there who choose to write options and collect premium. Since we seem to be a neglected bunch when it comes to indicators, I figured I would write a script that helps identify when underlyings are in a range and a good time to sell some premium when we are waiting for the next directional setup. This is the choppiness index modified to include a 21-period exponential moving average as a trigger, which I am calling the Chop Shop. The choppiness index , at its most basic, takes a log-scaled version of the summed Average True Range (ATR --- a volatility measurement) and converts it into an oscillator. The higher the oscillator value, the higher level of "chop" the stock is experiencing. This is often referred to as the stock is trading in a range. Most traders are advised to stay out of range trading because it is difficult. However, for an options trader this is an opportune time to collect some premium using bracketed short strike trades such as strangles, straddles, iron condors, or iron butterflies that are profitable when the stock stays rangebound and realizes a drop in volatility .
The indicator is extremely basic. You should look to collect premium and write these types of bracketed trades when Chop Shop crosses over its 21-period EMA . You should look to avoid writing bracketed trades when the Chop Shop trades below its 21-period EMA as this is when a stock is seeing a strong directional movement and can be considered trending. These are usually times when you want to get out of the way of the runaway train and make sure you are on the correct side of the trade or you can quickly get smoked. Use a combination of other indicators to help assist you define the most likely continued direction of the trend and you can then write directional premium trades such as credit spreads, directional Iron Condors, and butterflies to capture this and avoid stepping in front of that moving train.
Baekdoo compressed multi EMA box and its crossover indicatorHi forks,
I'm trader Baekdoosan who trading Equity from South Korea. This Baekdoo compressed multi EMA box and its crossover indicator tells us good trading time for swing trading.
Here is the idea. As you can see formula, I put ema of 5 days to 100 days.
and draw box when all disparity of the EMAs are less than 5%
I put those value in input variable as 105 (100 means same as max/min disparity ratio, 105 means max is 5% greater than min). This can be used 110 (10% of box) based on your needs.
Once box are drew, I put indicator when it crossover the box with 5 times larger than 60 days' highest volume. Then I put triangle indicator. This will be good trading point for short-mid term trading. you can check historical chart to evaluate this.
Hope this will help your trading on equity as well as crypto. I didn't try it on futures . Best of luck all of you. Gazua~!

MACD Infinity Indicator(MACDI)MACDI is the macd of macd indicators and macd of macd indicators of macd indicatrs and so on...!!
I used macd algo to find slopes of macd of price and it can helpfull when we want to find best signalls it can make amazing shapes that can be usable to everyone!
author: Masoud Azizi
github: mablue
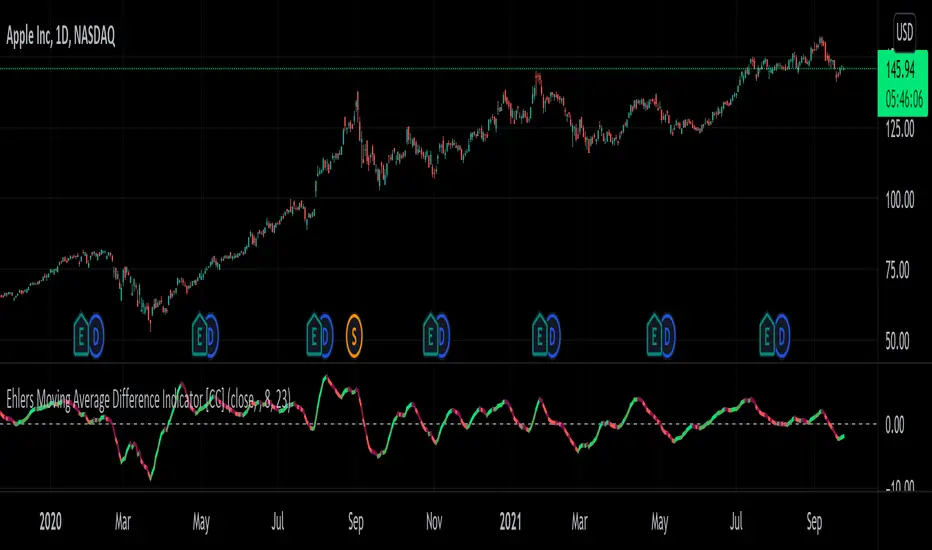
Ehlers Moving Average Difference Indicator [CC]The Moving Average Difference Indicator was created by John Ehlers (Stocks and Commodities Oct 2021 pg 23) and this is essentially his version of the famous MACD indicator. He calls this indicator the "thinking mans" MACD because his thought process for creating the lengths is based on half of the period of the dominant cycle. These are the default lengths that he created but feel free to test it out with your own variations and please let me know if you come up with a better one. I'm sorry for my long delay from TV. Sometimes I just need to step away and collect my thoughts before I burn myself out with the many scripts I keep publishing daily. I will try to get back into publishing daily again because I have a personal backlog of over 50 scripts ready to go that I haven't published yet. As always I have included strong buy and sell signals in addition to normal ones so darker colors are strong and lighter colors are normal. Buy when the line turns green and sell when it turns red.
Let me know if there are any other scripts you would like to see me publish!
MTF StochRSI indicator by noop42Here is a custom x3 timeframes Stochastic RSI indicator.
Main Features (can be disabled)
Average mode : for each timeframe, a single line corresponding to the average value between K and D is printed
Repaint mode : if enabled: values are updated in live, if disabled: values are updated once the concerned candle is closed
Default parameters
Timeframes: 1, 5, 15
Mode : Average value
Repaint mode: enabled

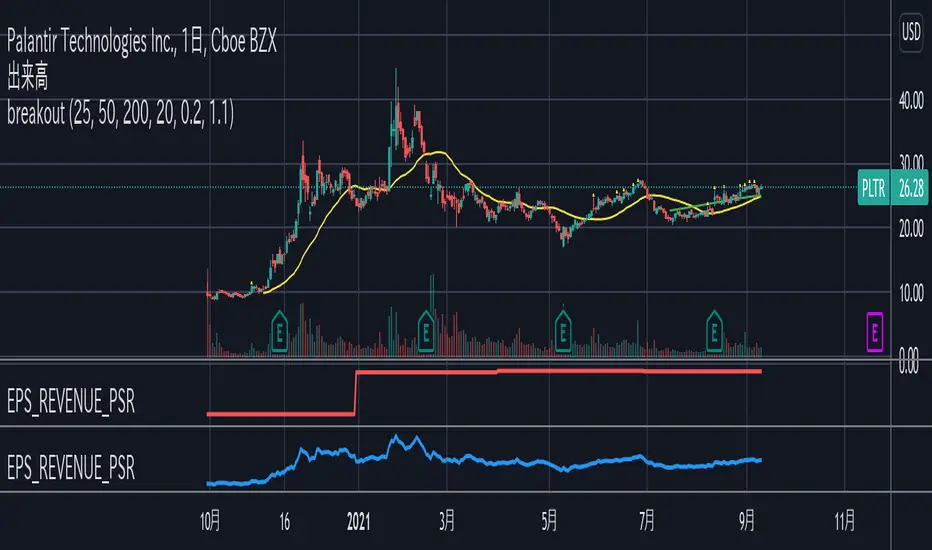
EPS_REVENUE_PSR indicatorQuarterly EPS, PER, total revenue(FQ) (in million unit), PSR can be shown as an indicator.
Check only one indicator for the chart visibility.
四半期毎のEPS, PER, 年間売上, PSRをインジケーターとして表示することができます。
チャートを見やすくするために1つのインジケーターを選択してください。
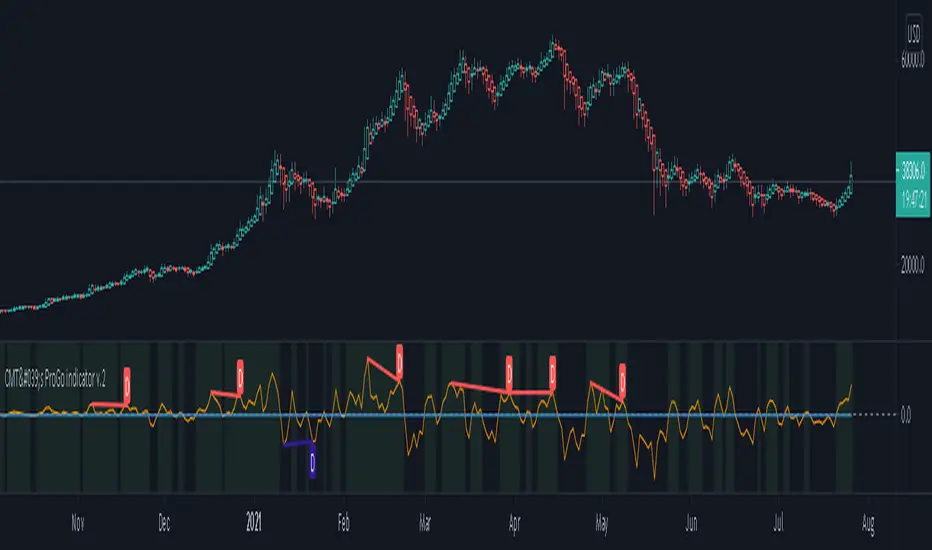
CMT's ProGo indicator v.2This was inspired by William's ProGo, which is an oscillator with a fast line based on today's open minus close compared to a slow line derived from yesterday's open minus close. These are tied to the 14 day SMA in both cases. William's hypothesis is that smart money makes its decisions based on what's happening now and dumb money makes their decisions slower. My hypothesis is that smart money reacts faster and in a more straightforward manner based on current price action while dumb money takes even longer than WIlliam's factored due to overthinking things. To reflect this, I've tied the pro line to the 1 SMA and the amateur line to the 21 SMA then changed the formula for the amateur line to open divided by close. That's a really cute story and all, but let's throw out all of the smart money/dumb money stuff and strap our boots to reality.
How to use:
1.) What we're looking at in the end is an examination of the relationship between price action and the 21 SMA. Since we're exploring rate of change and momentum, divergences should be relevant, right? And divergences are relevant in this indicator. These divergences are pretty good and tend to work in harmony with the trend, though can signal reversal points.
2.) This is not a real time oscillator. It involves three levels of derivation. Sometimes it'll provide leading signals and sometimes it'll show lagging signals because we're comparing the present against the past through a filter.
3.) I've noticed that this oscillator can be used to generate angled trend lines in some cases before they become evident through price action. This is interesting. What you'll do is slap some trend lines onto the oscillator, copy those then paste them onto the price action chart, copy them a few times to create a channel and see what's what. Horizontal support and resistance on the oscillator seems to translate into future price action S/R as well. THAT's interesting.
4.) On lower time frames, this indicator will do a pretty good job of letting you know whether you're in a bearish or bullish trend.
5.) Because of how the oscillator is formulated, it only recognizes Bitcoin as either bullish or ranging on higher time frames and will only ever register bearish on lower time frames. I don't think this will ever change, but if it does register BTC as bearish on higher time frames, I'd be real worried about Bitcoin.
6.) You'll notice that over time, volatility in the oscillator increases. Neat, huh? Yeah, it'll increase as market cap does. Take care and have fun with that.
v2.0 Improvements:
Divergences have been added.
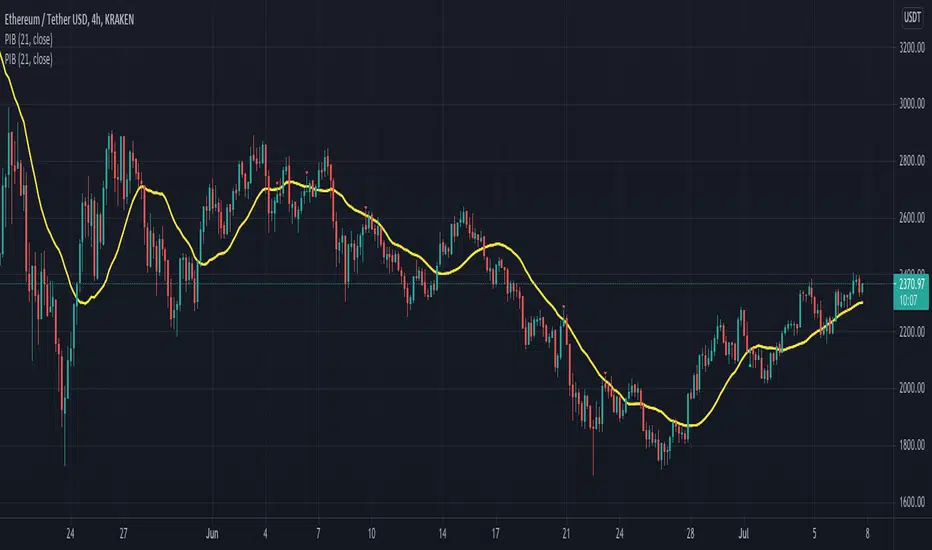
Pinbar-Rejection-IndicatorThis indicator allows you to filter noisy pin bar chart, with pin bars which have been rejected from dynamic support/resistance level also named as 21 Moving Average.
I would consider to work only on higher time frames like 1H and higher, so you really can find only best entries.
Have fun, write your feedback in the comments section:)
P.S This is the first version of the indicator, so be free to contribute, and soon I'm going to improve this indicator.
Ocean Indicator [CC]The Ocean Indicator was created by Jim Sloman (Ocean Theory pgs 39-47). Sadly he passed away a few years ago so it is extremely hard to find his code or more information about his trading system other than through his books so I did my best to replicate all of his work and I will be publishing his indicators over the next few weeks. Big thanks to @altcoinz for giving me all of the information I needed to replicate his work. Since this is his basic foundation for everything else he has done, I will be publishing it first. I had to change things a bit to provide clear buy and sell signals so let me know your thoughts.
This is essentially his version of a momentum indicator and the basics of it are to buy when momentum is increasing and sell when it is decreasing. I have included strong buy and sell signals in addition to normal ones and darker colors are for strong signals and lighter colors are for normal signals. Buy when the line turns green and sell when it turns red.
Let me know if there are any other indicators you would like to see me publish!

Alchemy - Bubble Finder - Daily IndicatorThis is the beginning of my bubble indicator.
This was just getting down the price component next update will include:
- Volume cross-verification - average volume peak increasing?
- Bars since high - most important piece
- Bubble ending alert, increased spacing between new highest bars.

VixFixLinReg-IndicatorSame as VixFixLinearRegression strategy published earlier - but as indicator for those who want to use it as indicator.
Strategy can be found here:
Concept is simple:
Based on VixFix script by Chris Moody. VIX-Fix can sometime give early signal. Hence, apply linear regression for better estimation of market bottom. Area above 0 shows VixFix whereas the below 0 area is linear regression of VixFix. To estimate market bottom:
First wait for VixFix to turn lime
Then wait for linear regression to turn lime from green.
VixFix may no longer be lime by linear regression chages. But, that's ok.
Have also added option candle color to highlight bottom and alert condition for those who want to use it.

RSI Trend Indicator [paRSI]The Relative Strength Index ( RSI ) is a measurement used by traders to assess the price momentum. It is scaled from 0 to 100. when RSI reads below 30, it is usually interpreted as oversold and when RSI is above 70 it is usually interpreted as overbought. However, it is usually not profitable to trade based on overbought and oversold signal.
RSI Trend Indicator or as I like to call it "paRSI" ("Parsa (my name) + RSI") shows that when RSI is above a specific number (default value = 60) it indicates bullish trend and when RSI is below a specific number (default value = 40 ) it indicates bearish trend. Lastly when RSI is below the 2 specified numbers it indicates a neutral trend.
I don't recommend trading based on this single indicator. If you're a trend trader this might be useful tool in addition to your own strategy
Usage:
If the created pattern has worked previously on the chart, you could enter on the first stages of the green or red section (depending on the market's trend).
It is not recommended to trade in any direction when there is no color
*THIS IS A TREND FOLLOWING STRATEGY AND DOES NOT WORK ON ALL MARKETS*

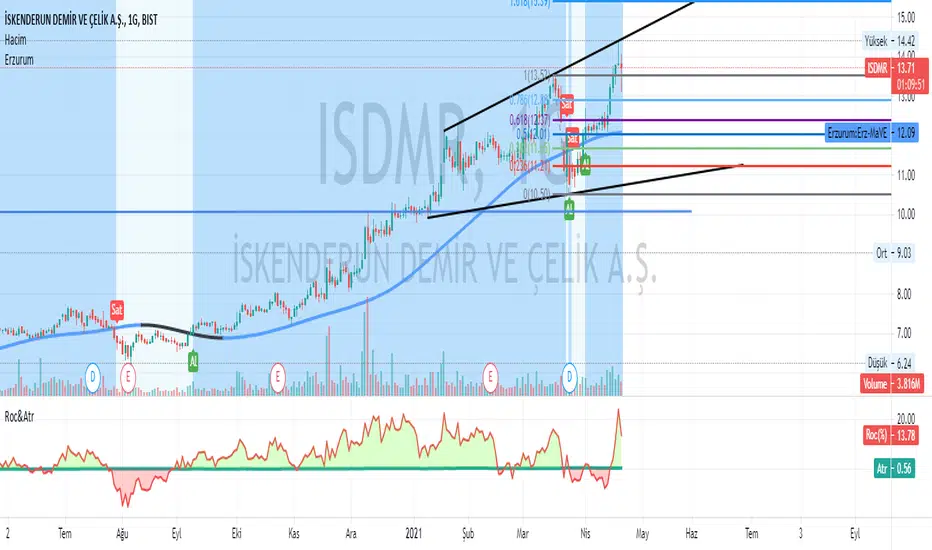
Erzurum Indicators (By DadashKadir)Erzurum Indicators (By DadashKadir)
An indicator in which you will keep track of the buying and selling movements by adding the movements of the three moving averages together. The parameters were determined as Moving Average (SMA), Exponential Moving Average (EMA), Weighted Moving Average (WMA) and Volume Weighted Moving Average (VWMA). Its constant value was taken as WMA. It is used to calculate the averages of 3 - 5 and 7. You can include the standard deviation (STDEV) in these moving averages.
The name of the indicator is taken from our city of Erzurum, the pearl of Eastern Anatolia.
Jetto's Custom Indicator V.1I have added few lines of code to the wave trend oscillator to give you guys the most accurate copy of my personal indicator.

ELIA MULTI INDICATORS STRATEGYExperimental multi indicators strategy, to catch right entry and avoid noise.
Each indicator included in the strategy, assume a value based on its status and because is a trend-follow strategy, some indicator value are higher then the other
Backtested on ETHUSDTPERP
BINANCE:ETHUSDTPERP

Altered True Strength Indicator (TSI) Reupload-
Altered TSI provides a slightly more volatile signal that demonstrates extremities in price action with greater success than standard TSI. In addition, I added bull/bear cross indicators (green/red) to make it easier to notice the crosses to save time when the market is moving fast (I couldn't find a regular TSI script with this addition). Finally, the signal also has overextension parameters (red and green lines)
I think this is best used on Intraday time frames as the signals respond to volatility very well and using Heikin Ashi candles, trend is more visual. In this particular example, I am showing SPY on the 3m time chart (my favorite short time frame) and the signal alone provided many opportunities for trades when using simple divergences and countering overextension direction when short term (blue) signal crosses either
In the first example (purple lines), SPY ramps but it was a dull signal given the signal strength flatlining- we would be looking for a short entry. When the signal fires, it provides a clean $1.50 move down in spy.
In the second example (orange), the blue signal provides a nice V shape (rebound signal) in which we are looking for a long entry. 390.50 is a strong SPY support in confluence with 2nd std dev VWAP extension, but disregarding that bull signal fires resulting in a 2 dollar move upwards. Exit is provided when blue line crosses green overextension.
In the third example (white), we are searching for a short entry at 392.5 resistance in confluence with divergently higher highs. Bear cross signal when fired and a significant cross is visible provides a $2.50 move to the downside with a potential exit provided when blue line crosses red overextension line in confluence with previous LOD area.
In the fourth example (green), we watch as the blue line provides a V pattern, we are searching for a long entry. If you didn't take a riskier long at 2nd std dev VWAP overextension with V recovery on blue line at red overextension for a ride to vwap, then you are looking for a secondary entry long as you wouldn't take the trade at resistance (vwap). Bullishly divergent lows provide this entry and the signal does not bear cross at all (but looking for significant crosses is more important even if the signal were to make a minor bear cross). Bullishly divergent double bottom provides a long entry to end of day with a nice clean signal for a $5.00 move until eod or when signal crosses overextension range.
Ideally, close to the money options or SPY/SPXS/SPXL are best used in the intraday time frame.
Again, this is not a standalone indicator but it's best used in conjunction with other indicators/trading strategies
Any questions feel free to comment

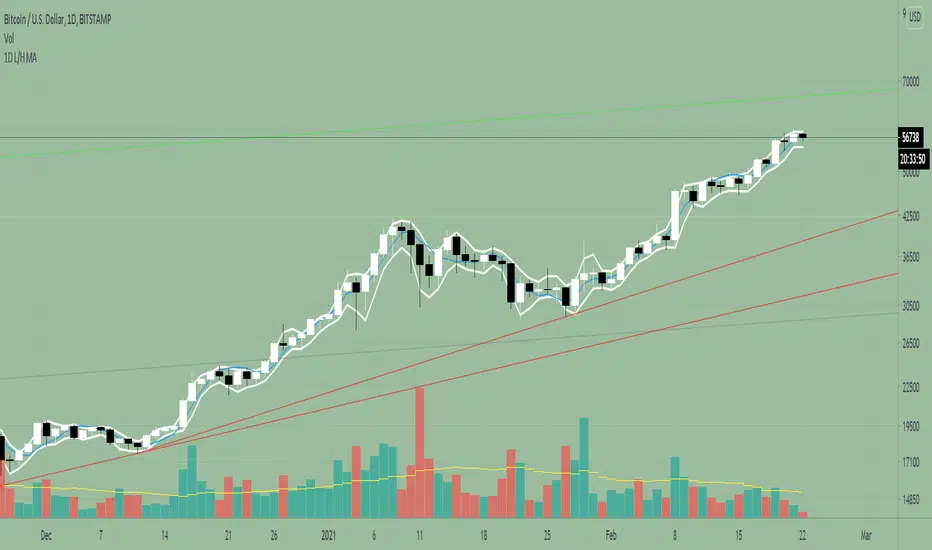
1D Low/High MA + Least Square Mean (3 indicators in 1)This indicator is a combination of 3 public indicators being:
* a standard Simple Moving Average with the source as the candle low & length of 2
* a standard Simple Moving Average with the source as the candle high & length of 2
* the Least Square Mean with a source of high + low /2 and length of 9
This combo was inspired by Tyler Coates who crafted EMASAR.
He regularly uses the a SMA with source of Low / High and length of 2 for defining trading daily ranges as well as the Least Square Mean for calculations in the his trading which he teaches via youtube.
I hope this indicator will reduce time spent on setting up charts.
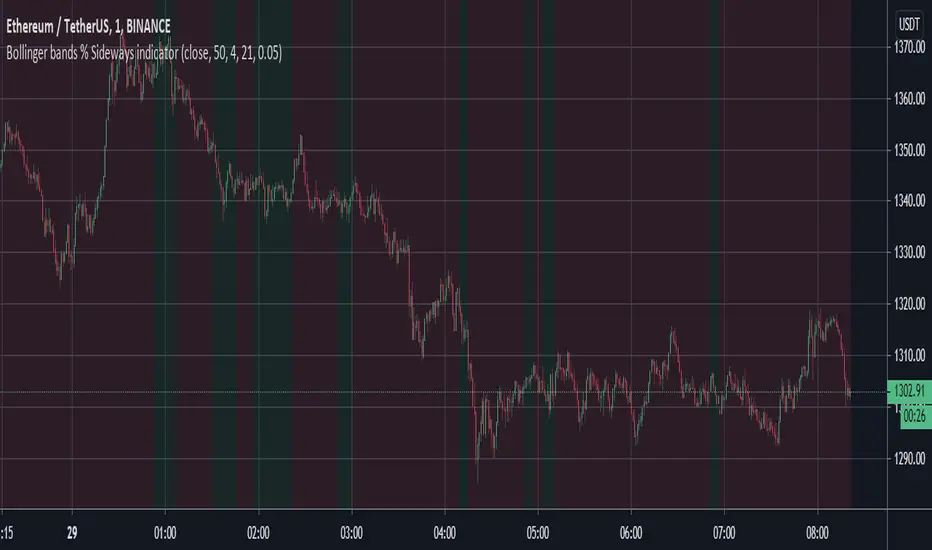
Bollinger bands % Sideways indicatorDetect sideways markets (green background) vs. trending markets (red background) with this indicator. It makes use of the Bollinger bands % as its base.