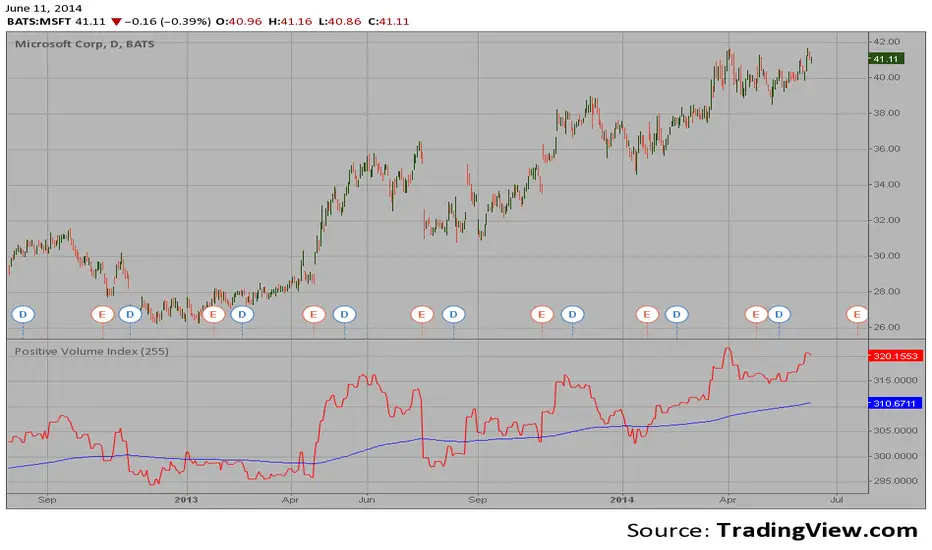
Positive Volume Index (PVI) The theory behind the indexes is as follows: On days of increasing volume,
you can expect prices to increase, and on days of decreasing volume, you can
expect prices to decrease. This goes with the idea of the market being in-gear
and out-of-gear. Both PVI and NVI work in similar fashions: Both are a running
cumulative of values, which means you either keep adding or subtracting price
rate of change each day to the previous day`s sum. In the case of PVI, if today`s
volume is less than yesterday`s, don`t add anything; if today`s volume is greater,
then add today`s price rate of change. For NVI, add today`s price rate of change
only if today`s volume is less than yesterday`s.
Buscar en scripts para "index"
Briese CoT Movement IndexThis Briese CoT (Commitments of Traders) Movement Index histogram indicator was built based on the formula by Stephen Briese in his book "The Commitments of Traders Bible":
"...difference between the COT Index and its reading of one or several weeks prior. I use six." —Chapter 7, page 75.
The code is a bit of a remix of the "ICT Commitment of Traders°" indicator by toodegrees and is meant for use in a new pane below a Weekly Chart .
The upper and lower thresholds are +40/-40. Some context: "A ± 40 point surge in the COT Index within a six-week period frequently marks the end of a counter-trend price reaction"
40 Point CoT Surge Rules (Commercials) from page 76
"During a correction from a prevailing uptrend, a +40 point movement in the CoT Index within a six-week period often marks the end of a corrective pullback, and the resumption of the major uptrend."
"During a reaction in a prevailing downtrend, a -40 point movement in the CoT Index within a six-week period frequently marks the end of a price reaction, and the resumption of the established downtrend."
"The failure of a ± point CoT Movement Index signal to restart the prevailing trend is a tip-off to a major trend change"
I'd recommend reading Briese's book for examples on how to properly interpret this indictor.
This indicator can be used in conjunction with another one I've published called the "Williams x Briese Hybrid CoT Index" which can be found on my scripts page.

Blockunity Excess Index (BEI)Identify excess zones resulting in market reversals by visualizing price deviations from an average.
The Excess Index (BEI) is designed to identify excess zones resulting in reversals, based on price deviations from a moving average. This moving average is fully customizable (type, period to be taken into account, etc.). This indicator also multiplies the moving average with a configurable coefficient, to give dynamic support and resistance levels. Finally, the BEI also provides reversal signals to alert you to any risk of trend change, on any asset.
The Idea
The goal is to provide the community with a visual and customizable tool for analyzing large price deviations from an average.
How to Use
Very simple to use, this indicator plots colored zones according to the price's deviation from the moving average. Moving average extensions also provide dynamic support and resistance. Finally, signals alert you to potential reversal points.
Elements
The Moving Average
The Moving Average, which defaults to a gray line over 200 periods, serves as a stable reference point. It is accompanied by an Index, whose color varies from yellow to orange to red, offering an overview of market conditions.
Extensions
These dynamic lines can be used to determine effective supports and resistances.
Signals
Green and red triangles serve as clear indicators for buy and sell signals.
Settings
Mainly, the type of moving average is configurable. The default is an SMA.
A Simple Moving Average (SMA) calculates the average of a selected range of prices by the number of periods in that range.
But you can also, for example, switch the mode to EMA.
The Exponential Moving Average (EMA) is a moving average that places a greater weight and significance on the most recent data points:
You also have WMA.
A Weighted Moving Average (WMA) gives more weight on recent data and less on past data:
And finally, the possibility of having a PCMA.
PCMA takes into account the highest and lowest points in the lookback period and divides this by two to obtain an average:
You can change other parameters such as lookback periods, as well as the coefficient used to define extension lines.
You can refer to the tooltips directly in the indicator parameters.
For those who prefer a minimalist display, you can activate a "Bar Color" in the settings (You must also uncheck "Borders" and "Wick" in your Chart Settings), and deactivate all other elements as you wish:
Finally, you can customize all the different colors, as well as the parameters of the table that indicates the Index value and the asset trend.
How it Works
The Index is calculated using the following method:
abs_distance = math.abs(close - base_ma)
bei = (abs_distance - ta.lowest(abs_distance, lookback_norm)) / (ta.highest(abs_distance, lookback_norm) - ta.lowest(abs_distance, lookback_norm)) * 100
Signals are triggered according to the following conditions:
A Long (buy) signal is triggered when the Index falls below 100, when the closing price is lower than 5 periods ago, and when the price is under the moving average.
A Short (sell) signal is triggered when the Index falls below 100, when the closing price is greater than 5 periods ago, and when the price is above the moving average.

Advanced Volatility-Adjusted Momentum IndexAdvanced Volatility-Adjusted Momentum Index (AVAMI)
The AVAMI is a powerful and versatile trading index which enhances the traditional momentum readings by introducing a volatility adjustment. This results in a more nuanced interpretation of market momentum, considering not only the rate of price changes but also the inherent volatility of the asset.
Settings and Parameters:
Momentum Length: This parameter sets the number of periods used to calculate the momentum, which is essentially the rate of change of the asset's price. A shorter length value means the momentum calculation will be more sensitive to recent price changes. Conversely, a longer length will yield a smoother and more stabilized momentum value, thereby reducing the impact of short-term price fluctuations.
Volatility Length: This parameter is responsible for determining the number of periods to be considered in the calculation of standard deviation of returns, which acts as the volatility measure. A shorter length will result in a more reactive volatility measure, while a longer length will produce a more stable, but less sensitive measure of volatility.
Smoothing Length: This parameter sets the number of periods used to apply a moving average smoothing to the AVAMI and its signal line. The purpose of this is to minimize the impact of volatile periods and to make the indicator's lines smoother and easier to interpret.
Lookback Period for Scaling: This is the number of periods used when rescaling the AVAMI values. The rescaling process is necessary to ensure that the AVAMI values remain within a consistent and interpretable range over time.
Overbought and Oversold Levels: These levels are thresholds at which the asset is considered overbought (potentially overvalued) or oversold (potentially undervalued), respectively. For instance, if the AVAMI exceeds the overbought level, traders may consider it as a possible selling opportunity, anticipating a price correction. Conversely, if the AVAMI falls below the oversold level, it could be seen as a buying opportunity, with the expectation of a price bounce.
Mid Level: This level represents the middle ground between the overbought and oversold levels. Crossing the mid-level line from below can be perceived as an increasing bullish momentum, and vice versa.
Show Divergences and Hidden Divergences: These checkboxes give traders the option to display regular and hidden divergences between the AVAMI and the asset's price. Divergences are crucial market structures that often signal potential price reversals.
Index Logic:
The AVAMI index begins with the calculation of a simple rate of change momentum indicator. This raw momentum is then adjusted by the standard deviation of log returns, which acts as a measure of market volatility. This adjustment process ensures that the resulting momentum index encapsulates not only the speed of price changes but also the market's volatility context.
The raw AVAMI is then smoothed using a moving average, and a signal line is generated as an exponential moving average (EMA) of this smoothed AVAMI. This signal line serves as a trigger for potential trading signals when crossed by the AVAMI.
The script also includes an algorithm to identify 'fractals', which are distinct price patterns that often act as potential market reversal points. These fractals are utilized to spot both regular and hidden divergences between the asset's price and the AVAMI.
Application and Strategy Concepts:
The AVAMI is a versatile tool that can be integrated into various trading strategies. Traders can utilize the overbought and oversold levels to identify potential reversal points. The AVAMI crossing the mid-level line can signify a change in market momentum. Additionally, the identification of regular and hidden divergences can serve as potential trading signals:
Regular Divergence: This happens when the asset's price records a new high/low, but the AVAMI fails to follow suit, suggesting a possible trend reversal. For instance, if the asset's price forms a higher high but the AVAMI forms a lower high, it's a regular bearish divergence, indicating potential price downturn.
Hidden Divergence: This is observed when the price forms a lower high/higher low, but the AVAMI forms a higher high/lower low, suggesting the continuation of the prevailing trend. For example, if the price forms a lower low during a downtrend, but the AVAMI forms a higher low, it's a hidden bullish divergence, signaling the potential continuation of the downtrend.
As with any trading tool, the AVAMI should not be used in isolation but in conjunction with other technical analysis tools and within the context of a well-defined trading plan.

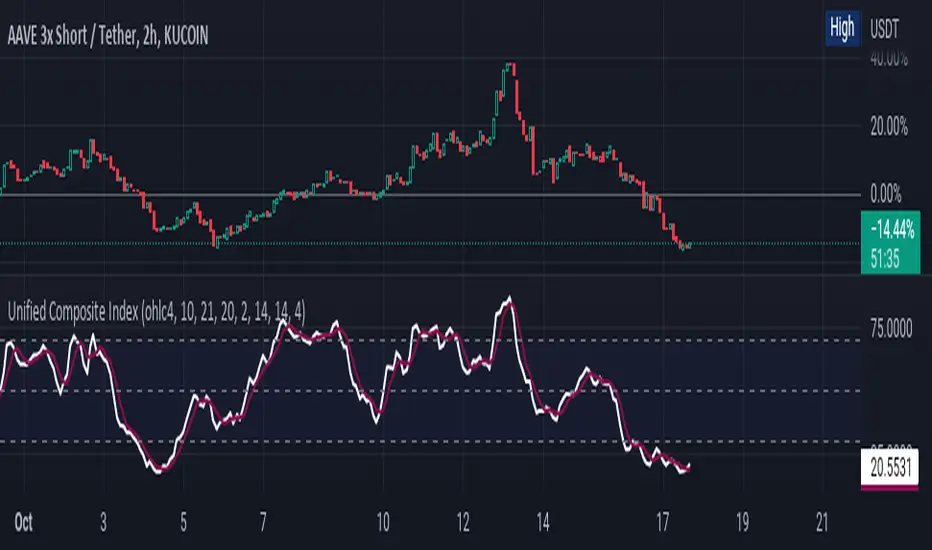
Unified Composite Index [UCI] [KuraiBlu] [LazyBear]The purpose of this indicator is to combine the four basic types of indicators (Trend, Volatility, Momentum and Volume) to create a singular, composite index in order to provide a more holistic means of observing potential changes within the market, known as the Unified Composite Index . The indicators used in this index are as follows:
Trend - Trend Composite Index
Volatility - Bollinger Bands %b
Momentum - Relative Strength Index
Volume - Money Flow Index
The average price source can’t be altered as I’ve made it an average between ((open + close) / 2) and ((high + low) / 2).
The best way to use this is by observing several of the indicators at once in conjunction with the average, rather than simply using the average produced to determine the right moment to enter, or exit a trade by itself. I've found when one indicator goes way out of bounds relative to the other three (and subsequently, the average array), then it presents a good buying, or selling opportunity.
Some adjustments were made to several of the indicators in order to standardize them on a scale of 1-100 so that they could better accommodate the average array that was finally produced. Thanks to LazyBear for letting me strip down the WaveTrend Oscillator.
Comparison (Malaysia Index & Sector)This is just a simple tool for convenient to compare and showing a clear image of all sector and index in Malaysia. They are just in one indicator. From this indicator, you can predict momentum of each sector in Malaysia, which is currently in bull or bear trend.
STRUCTURE
In the setting, the first line with the option of the following index (Malaysia Index) :
1. FBMKLCI
2. FTSEMYX:FBMSCAP
3. FTSEMYX:FBMACE
4. FTSEMYX:FBM70
5. FTSEMYX:FBMT100
6. FTSEMYX:FBMFLG
7. FTSEMYX:FBMEMAS
8. FTSEMYX:FA40
9. FTSEMYX:FBMMSCS
10. FTSEMYX:FBMAPMYR
11. FTSEMYX:FBMMSCAP
The rest of lines is all of the following sector (Malaysia Sector):
1. Technology
2. Telecommunication
3. Health
4. Consumer Product
5. Industrial Product
6. Construction
7. Property
8. Plantation
9. Utilities
10. Transportation
11. Energy
12. REIT
13. Finance
The last line (Line 15) is provided for other stock/index which is not available in option to manually fill.
All sector and index price are smoothen by Moving Average (MA). The default moving average is Relative Moving Average (RMA) which is used in Relative Strength Index ( RSI ) Oscillator. But the range is different from RSI , it is from -100 to 100 instead of 0 to 100. In the end, result and interpretation are just the same as RSI . Green area indicates oversold area, while red area is overbought.
Other choice of Moving Averages are available to change.
The problem of putting all together is the script may take longer to process. It is just for convenient use.
Bottom-Up or Top-Down Invest?

Skew Index Rank-Buschi
English:
a quick and simple tampering with the SKEW Index (also known as the "Black Swan Index")
Personally, I find it quite difficult to use the SKEW Index as a reliable indicator. Nevertheless I implemented a ranking system (from 0 to 100) with the option to include a certain time period (default: 252 trading days (units)) and a moving average (default: 21 days (units)).
Feedback is most welcome to modify / improve the script.
Deutsch:
eine schnelle und einfache Bearbeitung des SKEW Index (auch als "Schwarzer Schwan Index" bekannt)
Persönlich finde ich es recht schwierig, den SKEW Index als verlässlichen Indikator zu verwenden. Trotzdem habe ich hier einfach einmal ein Ranking-System (von 0 bis 100) aufgesetzt mit der Option, einen gewissen Zeitrahmen (Standardwert: 252 Handelstage (Einheiten)) und einen gleitenden Durchschnitt (Standardwert: 21 Tage (Einheiten)) einzubinden.
Feedback ist sehr willkommen, um das Skript zu überarbeiten / zu verbessern.

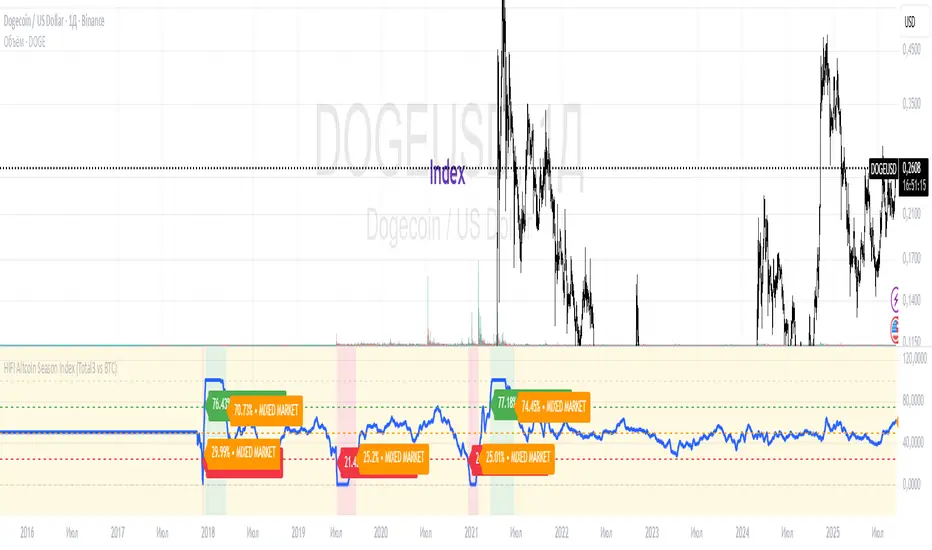
HIFI Altcoin Season Index (Total3 vs BTC)This indicator helps you determine whether the crypto market is in an "altcoin season" or a "bitcoin season." It doesn't compare every single altcoin to Bitcoin individually; instead, it uses a more efficient approach.
Methodology
The index calculates the difference in price performance over a selected period (default 90 days) between the total market capitalization of altcoins without Ethereum (TOTAL3) and Bitcoin (BTC).
Interpretation
Value above 75: TOTAL3 is showing significantly stronger growth than BTC, indicating an ALTCOIN SEASON. 🚀
Value below 25: BTC is outperforming TOTAL3, indicating a BITCOIN SEASON. 👑
Value between 25 and 75: The market is in a mixed or neutral phase. 🤷
Benefits
This method avoids the technical limitations of Pine Script when requesting data for a large number of symbols, making the indicator stable and reliable.
Disclaimer: This indicator is a tool for market analysis and should not be considered financial advice.
COT3 - Flip Strength Index - Invincible3This indicator uses the TradingView COT library to visualize institutional positioning and potential sentiment or trend shifts. It compares the long% vs short% of commercial and non-commercial traders for both Pair A and Pair B, helping traders identify trend strength, market overextension, and early reversal signals.
🔷 COT RSI
The COT RSI normalizes the net positioning difference between non-commercial and commercial traders over (N=13, 26, and 52)-week periods. It ranges from 0 to 100, highlighting when sentiment is at bullish or bearish extremes.
COT RSI (N)= ((NC - C)−min)/(max-min) x100
🟡 COT Index
The COT Index tracks where the current non-commercial net position lies within its 1-year and 3-year historical range. It reflects institutional accumulation or distribution phases.
Strength represents the magnitude of that positioning bias, visualized through normalized RSI-style metrics.
COT Index (N)= (NC net)/(max-min) x100
🔁 Flip Detection
Flip refers to the crossovers between long% and short%, indicating a change in directional bias among trader groups. When long positions exceed shorts (or vice versa), it signals a possible market flip in sentiment or trend.
For example, Pair B commercial flip is calculated as:
Long% = (Long/Open Interest)×100
Short% = (Short/Open Interest)×100
Flip = Long%−Short%
A bullish flip occurs when long% overtakes short%, and vice versa for a bearish flip. These flips often precede price trend changes or confirm sentiment breakouts.
Flip captures how far current positioning deviates from historical norms — highlighting periods of institutional overconfidence or exhaustion, often leading to significant market turns.
This combination offers a multi-layered edge for identifying when smart money is flipping direction, and whether that flip has strong conviction or is likely to fade.
..........................................................................................................................................................

Absolute Strength Index [ASI] (Zeiierman)█ Overview
The Absolute Strength Index (ASI) is a next-generation oscillator designed to measure the strength and direction of price movements by leveraging percentile-based normalization of historical returns. Developed by Zeiierman, this indicator offers a highly visual and intuitive approach to identifying market conditions, trend strength, and divergence opportunities.
By dynamically scaling price returns into a bounded oscillator (-10 to +10), the ASI helps traders spot overbought/oversold conditions, trend reversals, and momentum changes with enhanced precision. It also incorporates advanced features like divergence detection and adaptive signal smoothing for versatile trading applications.
█ How It Works
The ASI's core calculation methodology revolves around analyzing historical price returns, classifying them into top and bottom percentiles, and normalizing the current price movement within this framework. Here's a breakdown of its key components:
⚪ Returns Lookback
The ASI evaluates historical price returns over a user-defined period (Returns Lookback) to measure recent price behavior. This lookback window determines the sensitivity of the oscillator:
Shorter Lookback: Higher responsiveness to recent price movements, suitable for scalping or high-volatility assets.
Longer Lookback: Smoother oscillator behavior is ideal for identifying larger trends and avoiding false signals.
⚪ Percentile-Based Thresholds
The ASI categorizes returns into two groups:
Top Percentile (Winners): The upper X% of returns, representing the strongest upward price moves.
Bottom Percentile (Losers): The lower X% of returns, capturing the sharpest downward movements.
This percentile-based normalization ensures the ASI adapts to market conditions, filtering noise and emphasizing significant price changes.
⚪ Oscillator Normalization
The ASI normalizes current returns relative to the top and bottom thresholds:
Values range from -10 to +10, where:
+10 represents extreme bullish strength (above the top percentile threshold).
-10 indicates extreme bearish weakness (below the bottom percentile threshold).
⚪ Signal Line Smoothing
A signal line is optionally applied to the ASI using a variety of moving averages:
Options: SMA, EMA, WMA, RMA, or HMA.
Effect: Smooths the ASI to filter out noise, with shorter lengths offering higher responsiveness and longer lengths providing stability.
⚪ Divergence Detection
One of ASI's standout features is its ability to detect and highlight bullish and bearish divergences:
Bullish Divergence: The ASI forms higher lows while the price forms lower lows, signaling potential upward reversals.
Bearish Divergence: The ASI forms lower highs while the price forms higher highs, indicating potential downward reversals.
█ Key Differences from RSI
Dynamic Adaptability: ASI adjusts to market conditions through percentile-based scaling, while RSI uses static thresholds.
█ How to Use ASI
⚪ Trend Identification
Bullish Strength: ASI above zero suggests upward momentum, suitable for trend-following trades.
Bearish Weakness: ASI below zero signals downward momentum, ideal for short trades or exits from long positions.
⚪ Overbought/Oversold Levels
Overbought Zone: ASI in the +8 to +10 range indicates potential exhaustion of bullish momentum.
Oversold Zone: ASI in the -8 to -10 range points to potential reversal opportunities.
⚪ Divergence Signals
Look for bullish or bearish divergence labels to anticipate trend reversals before they occur.
⚪ Signal Line Crossovers
A crossover between the ASI and its signal line (e.g., EMA or SMA) can indicate a shift in momentum:
Bullish Crossover: ASI crosses above the signal line, signaling potential upside.
Bearish Crossover: ASI crosses below the signal line, suggesting downside momentum.
█ Settings Explained
⚪ Absolute Strength Index
Returns Lookback: Sets the sensitivity of the oscillator. Shorter periods detect short-term changes, while longer periods focus on broader trends.
Top/Bottom Percentiles: Adjust thresholds for defining winners and losers. Narrower percentiles increase sensitivity to outliers.
Signal Line Type: Choose from SMA, EMA, WMA, RMA, or HMA for smoothing.
Signal Line Length: Fine-tune the responsiveness of the signal line.
⚪ Divergence
Divergence Lookback: Adjusts the period for detecting divergence. Use longer lookbacks to reduce noise.
-----------------
Disclaimer
The information contained in my Scripts/Indicators/Ideas/Algos/Systems does not constitute financial advice or a solicitation to buy or sell any securities of any type. I will not accept liability for any loss or damage, including without limitation any loss of profit, which may arise directly or indirectly from the use of or reliance on such information.
All investments involve risk, and the past performance of a security, industry, sector, market, financial product, trading strategy, backtest, or individual's trading does not guarantee future results or returns. Investors are fully responsible for any investment decisions they make. Such decisions should be based solely on an evaluation of their financial circumstances, investment objectives, risk tolerance, and liquidity needs.
My Scripts/Indicators/Ideas/Algos/Systems are only for educational purposes!

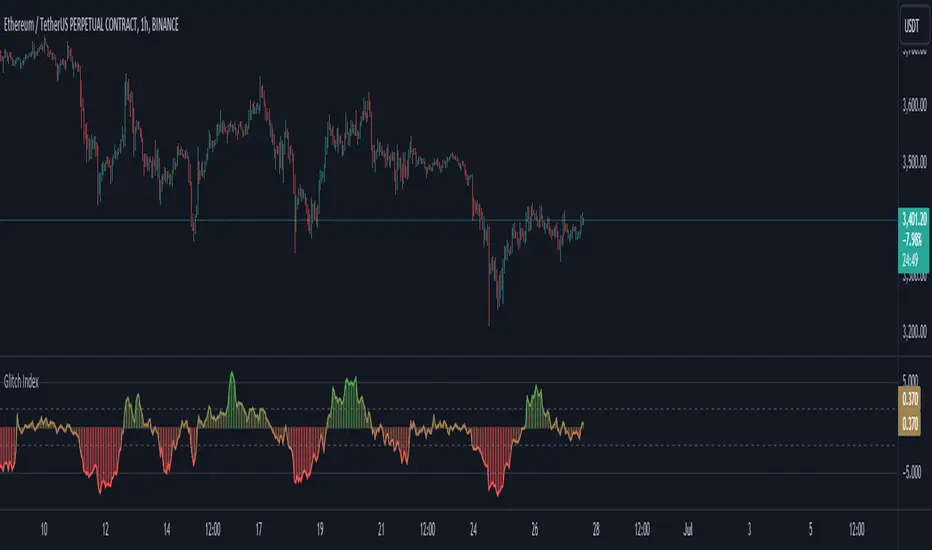
Glitch IndexGlitch Index is an oscillator from an unknown origin that is discovered in 2013 as a lua indicator taken from MetaStock days and we are not really sure how far back the original idea goes.
How it Works?
As I found this indicator and looking at it's code in different platform I can see it comes back from a basic idea of getting a price value, calculating it's smoothed average with a set multiplier and getting the difference then presenting it on a simplified scale. It appears to be another interpretation of figuring out price acceleration and velocity. The main logic is calculated as below:
price = priceSet(priceType)
_ma = getAverageName(price, MaMethod, MaPeriod)
rocma = ((_ma - _ma ) * 0.1) + 1
maMul = _ma * rocma
diff = price - maMul
gli_ind = (diff / price) * -10
How to Use?
Glitch Index can be used based on different implementations and along with your already existing trading system as a confirmation. Yoıu can use it as a Long signal when the histogram crosses inner levels or you can use it as an overbough and oversold signals when the histogram crosses above outter levels and gets back in the range between outter and inner levels.
You can customise the settings and set your prefered inner and outter levels in indicator settings along with gradient or static based coloring and modify the code as you see fit. The coloring code is set below:
gli_col = gli_ind > outterLevel ? color.green : gli_ind < -outterLevel ? color.red : gli_ind > innerLevel ? color.rgb(106, 185, 109, 57) : gli_ind < -innerLevel ? color.rgb(233, 111, 111, 40) : color.new(color.yellow, 60)
gradcol = color.from_gradient(gli_ind, -outterLevel, outterLevel, color.red, color.green)
colorSelect = colorType == "Gradient" ? gradcol : gli_col
Grucha Percentage Index (GPI) V2Grucha Percentage Index originally created by Polish coder named Grzegorz Antosiewicz in 2011 as mql code. This code is adapted by his original code to tradingview's pinescript.
What Does it Do
GPI is an oscillator that finds the lowest/highest prices with certain depth and generates signals by comparing the bull and bear bars. It use two lines, one is the original GPI calculation, the other is the smoothed version of the original line.
How to Use
GPI can catch quick volatility based movements and can be used as a confirmation indicator along with your existing trading system. When GDI (default color yellow) crosses above the GDI MA (default colored blue) it can be considered as a bullish movement and reverse can be considered as bearish movement.
How does it Work
The main calculation is done via the code below:
for i=0 to length
if candleC < 0
minus += candleC
if candleC >= 0
plus -= candleC
Simply we are adding green and red bars seperately and then getting their percentage to the bullish movement to reflect correctly in a 0-100 z-score enviroment via the code below:
res = (math.abs(minus)/sum)*100
Rest is all about plotting the results and adding seperate line with smoothing.
Note
These kind of oscillators are not designed to be used alone for signal generation but rather should be used in combination with different indicators to increase reliability of your signals.
Happy Trading.

Economic Growth Index (XLY/XLP)Keeping an eye on the macroeconomic environment is an essential part of a successful investing and trading strategy. Piecing together and analysing its complex patterns are important to detect probable changing trends. This may seem complicated, or even better left to experts and gurus, but it’s made a whole lot easier by this indicator, the Economic Growth Index (EGI).
Common sense shows that in an expanding economy, consumers have access to cash and credit in the form of disposable income, and spend it on all sorts of goods, but mainly crap they don’t need (consumer discretionary items). Companies making these goods do well in this phase of the economy, and can charge well for their products.
Conversely, in a contracting economy, disposable income and credit dry up, so demand for consumer discretionary products slows, because people have no choice but to spend what they have on essential goods. Now, companies making staple goods do well, and keep their pricing power.
These dynamics are represented in EGI, which plots the Rate of Change of the Consumer Discretionary ETF (XLY) in relation to the Consumer Staples ETF (XLP). Put simply, green is an expanding phase of the economy, and red shrinking. The signal line is the market, a smoothed RSI of the S&P500. Run this on a Daily timeframe or higher. Check it occasionally to see where the smart money is heading.

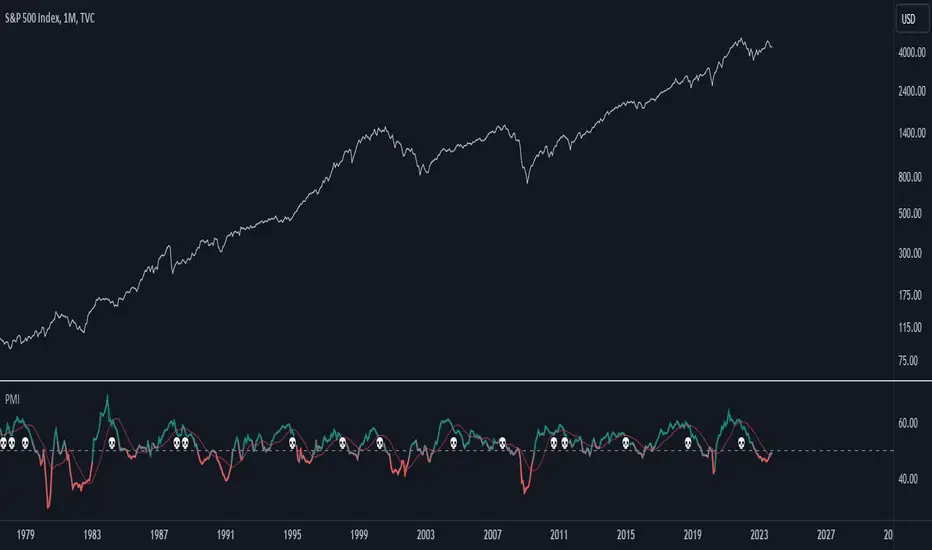
Purchasing Managers Index (PMI)The Purchasing Managers Index (PMI) is a widely recognized economic indicator that provides crucial insights into the health and performance of an economy's manufacturing and services sectors. This index is a vital tool for anticipating economic developments and trends, offering an early warning system for changes in these sectors.
The PMI is calculated based on surveys conducted among purchasing managers in various businesses and organizations. These managers are asked about their perceptions of current business conditions and their expectations for future economic activity within their sectors. The responses are then compiled and used to calculate the PMI value.
A PMI value above 50 typically indicates that the manufacturing or services sector is expanding, suggesting a positive economic outlook. Conversely, a PMI value below 50 suggests contraction, which may be an early indication of economic challenges or a potential recession.
In summary, the Purchasing Managers Index (PMI) is an essential economic indicator that assesses the health of manufacturing and services sectors by surveying purchasing managers' opinions. It serves as an early warning system for changes in economic activity and is a valuable tool for forecasting economic trends and potential crises.
This code combines the Purchasing Managers Index (PMI) data with two Simple Moving Averages (SMA) and some visual elements.
Let's break down how this indicator works:
1. Loading PMI Data:
The indicator loads data for the "USBCOI" symbol, which represents the PMI data. It fetches the monthly closing prices of this symbol.
2. Calculating Moving Averages:
Two Simple Moving Averages (SMAs) are calculated based on the PMI data. The first SMA, sma_usbcoi, has a length defined by the input parameter (default: 2). The second SMA, sma2_usbcoi, has a different length defined by the second input parameter (default: 14).
3. Color Coding and Thresholds:
The line color of the PMI plot is determined based on the value of the PMI. If the PMI is above 52, the color is teal; if it's below 48, the color is red; otherwise, it's gray. These threshold values are often used to identify specific conditions in the PMI data.
4. Crossing Indicator:
A key feature of this indicator is to determine if the PMI crosses the first SMA (sma_usbcoi) from top to bottom while also being above the value of 52. This is indicated by the crossedUp variable. This condition suggests a specific situation where the PMI crosses a short-term moving average while indicating strength (above 52).
5. Visual Elements:
A "💀" skull emoji is defined as skullEmoji.
The PMI is plotted on the chart with color coding based on its value, as described earlier.
The two SMAs are also plotted on the chart.
When the crossedUp condition is met (PMI crosses the first SMA from top to bottom while above 52), a skull emoji (indicating potential danger) is plotted at the top of the indicator window.
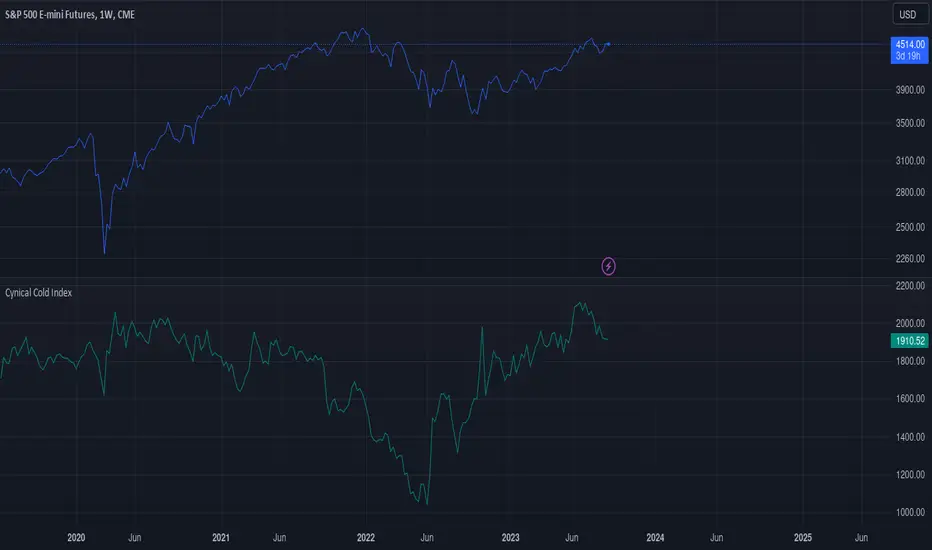
Cynical Cold IndexThis TradingView indicator calculates the Cynical Cold Index, which is a weighted basket of commodity prices designed to track economic conditions. It compares the price of a given asset to the index value.
Weights the commodities as percentages:
Gold: 10%
Oil: 15%
Coffee: 5%
Natural Gas: 10%
Silver: 15%
Sugar: 5%
Corn: 5%
Wheat: 5%
Cotton: 10%
Copper: 10%
Iron Ore: 5%
Live Cattle: 5%
Urea: 5%
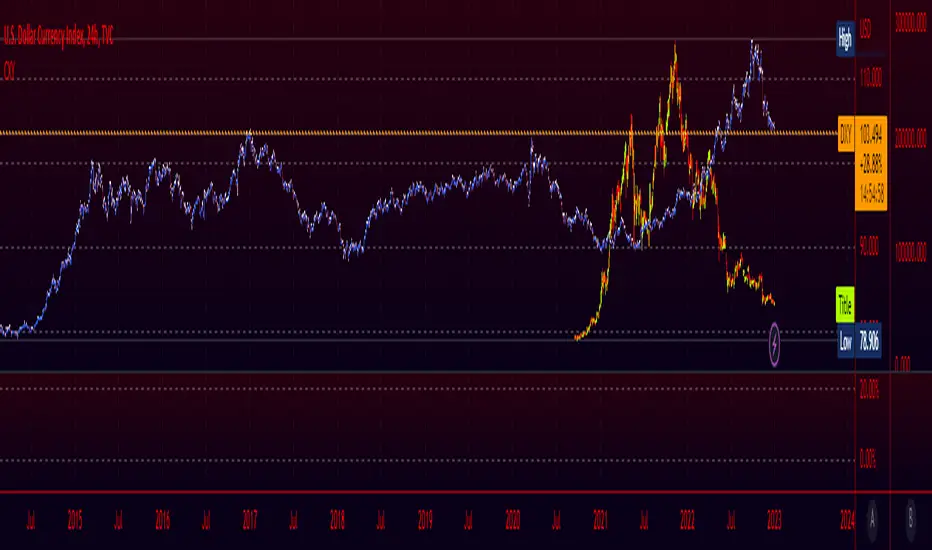
Crypto Index (DXY) CandlesA modification of @loxx's "Dollar Index (DXY) Candles" allowing for a user selected basket of tickers using the same weights as the standard DXY. Ticker Inputs are in descending order so highest weight is at the top by default, although weighting can be changed manually by modifying the symbol's corresponding weight input in the settings. The Idea was to get a bird's eye view of the crypto space using some of the more relevant names in the space. User's can use the toggle in the settings for viewing the default DXY for comparison. Indicator should be used as a confirmation when looking at long term trend changes in the space, shorter time frames may, or may not be as useful.
MTF Commodity Oddity Index (CCI+)MTF Commodity Oddity Index (CCI+)
This chart overlay indicator is based upon the Commodity Channel Index (CCI) and can signal multiple triple-timeframe CCI overbought and oversold confluences directly onto your chart, intended for use as a confluence either for reversal trade entries, or potential trade exits, indicating where price may be probable to reverse.
Features include:
- Primary set of fully configurable triple-timeframe overbought and oversold signals, indicating where 3 selected timeframes are all overbought or all oversold at the same time. Enabled by default.
- Secondary set of fully configurable triple-timeframe overbought and oversold signals, indicating where 3 selected timeframes are all overbought or all oversold at the same time. Enabled by default.
- Optional drawing of background colours and/or ribbon seen at bottom of the chart image.
- The default primary MTF #1 timeframes are set to 1 minute, 5 minute and 15 minute. These are highly suitable for low timeframe scalpers trading on < 5m charts, and can often pin point price reversals.
- The default Secondary MTF #2 timeframes are set to 15 minute, 30 minute and 120 minute. These are suitable for both low timeframe scalpers and considerably higher timeframe traders.
- Independent alerts for MTF #1 and MTF #2 triple-timeframe confluences, including options for alerting MTF overbought and MTF oversold individually, as well as an option for alerting either overbought or oversold in a single combined alert.
- Also includes standard configurable CCI options, including CC length and source type.
Note: The features listed above are accurate at the time of publishing but maybe updated or added to in future.
A similar MTF CCI indicator is also available as a panel indicator here .
This indicator is based upon the original MTF Fantastic Stochastic (FS+) available here .
What is the Commodity Channel Index (CCI)?
Investopedia has described the popular oscillator as follows:
“The Commodity Channel Index (CCI) is a momentum-based oscillator used to help determine when an investment vehicle is reaching a condition of being overbought or oversold.
Developed by Donald Lambert, this technical indicator assesses price trend direction and strength, allowing traders to determine if they want to enter or exit a trade, refrain from taking a trade, or add to an existing position. In this way, the indicator can be used to provide trade signals when it acts in a certain way.”
You can read more about the CCI , its use cases and calculations here .
How do traders use overbought and oversold levels in their trading?
The oversold level, that is traditionally when the CCI is above the 100 level is typically interpreted as being 'overbought', and below the -100 level is typically considered 'oversold'. Traders will often use the CCI at an overbought level as a confluence for entry into a short position, and the CCI at an oversold level as a confluence for an entry into a long position. These levels do not mean that price will necessarily reverse at those levels in a reliable way, however. This is why this version of the CCI employs the triple timeframe overbought and oversold confluence, in an attempt to add a more confluence and reliability to this usage of the CCI . While traditionally, the overbought and oversold levels are below -100 for oversold, and above 100 for overbought, the default threshold settings of this indicator have been increased to provide fewer, stronger signals, especially suited to the low timeframes and highly volatile assets.

Relative Strength Index (RSI) + Realtime DivergencesRelative Strength Index (RSI) + Realtime Divergences
This version of the RSI indicator includes the following features:
- Optional divergence lines drawn directly onto the oscillator in realtime.
- Configurable alerts to notify you when divergences occur.
- Configurable lookback periods to fine tune the divergences drawn in order to suit different trading styles and timeframes.
- Background colouring option to indicate when the RSI oscillator has crossed above or below its centerline.
- Alternate timeframe feature allows you to configure the oscillator to use data from a different timeframe than the chart it is loaded on.
- Fadeout oscillator feature will fade out all but the most recent history, leaving your chart free of visual noise.
- Flip oscillator feature can be used with the Tradingview 'Flip chart' feature (Alt+i) in order to flip both the chart and the oscillator, too. This feature is to help traders manually spot divergences that may have a strong natural bias in one direction.
- Optional centerline and range bands.
- Various optional moving average types, bollinger bands etc.
This indicator adds additional features onto the standard RSI whose core calculations remain unchanged. Namely, the configurable option to automatically, quickly and clearly draw divergence lines onto the oscillator for you as they occur in realtime. It also has the addition of unique alerts, so you can be notified when divergences occur without spending all day watching the charts. Furthermore, this version of the RSI comes with configurable lookback periods, which can be configured in order to adjust the sensitivity of the divergences, in order to suit shorter or higher timeframe trading approaches.
What is the Relative Strength Index ( RSI )?
Investopedia describes the Relative Strength Index as follows:
“The relative strength index (RSI) is a momentum indicator used in technical analysis. RSI measures the speed and magnitude of a security's recent price changes to evaluate overvalued or undervalued conditions in the price of that security. The RSI is displayed as an oscillator (a line graph) on a scale of zero to 100. The indicator was developed by J. Welles Wilder Jr. and introduced in his seminal 1978 book, New Concepts in Technical Trading Systems.
The RSI can do more than point to overbought and oversold securities. It can also indicate securities that may be primed for a trend reversal or corrective pullback in price. It can signal when to buy and sell. Traditionally, an RSI reading of 70 or above indicates an overbought situation. A reading of 30 or below indicates an oversold condition.”
The RSI is also commonly used to spot divergences.
You can read more about the RSI and its calculations here
What are divergences?
Divergence is when the price of an asset is moving in the opposite direction of a technical indicator, such as an oscillator, or is moving contrary to other data. Divergence warns that the current price trend may be weakening, and in some cases may lead to the price changing direction.
There are 4 main types of divergence, which are split into 2 categories;
regular divergences and hidden divergences. Regular divergences indicate possible trend reversals, and hidden divergences indicate possible trend continuation.
Regular bullish divergence: An indication of a potential trend reversal, from the current downtrend, to an uptrend.
Regular bearish divergence: An indication of a potential trend reversal, from the current uptrend, to a downtrend.
Hidden bullish divergence: An indication of a potential uptrend continuation.
Hidden bearish divergence: An indication of a potential downtrend continuation.
How do traders use divergences in their trading?
A divergence is considered a leading indicator in technical analysis , meaning it has the ability to indicate a potential price move in the short term future.
Hidden bullish and hidden bearish divergences, which indicate a potential continuation of the current trend are sometimes considered a good place for traders to begin, since trend continuation occurs more frequently than reversals, or trend changes.
When trading regular bullish divergences and regular bearish divergences, which are indications of a trend reversal, the probability of it doing so may increase when these occur at a strong support or resistance level . A common mistake new traders make is to get into a regular divergence trade too early, assuming it will immediately reverse, but these can continue to form for some time before the trend eventually changes, by using forms of support or resistance as an added confluence, such as when price reaches a moving average, the success rate when trading these patterns may increase.
Typically, traders will manually draw lines across the swing highs and swing lows of both the price chart and the oscillator to see whether they appear to present a divergence, this indicator will draw them for you, quickly and clearly, and can notify you when they occur.
Setting alerts.
With this indicator you can set alerts to notify you when any/all of the above types of divergences occur, on any chart timeframe you choose.
Configurable pivot periods.
You can adjust the default pivot periods to suit your prefered trading style and timeframe. If you like to trade a shorter time frame, lowering the default lookback values will make the divergences drawn more sensitive to short term price action.
Disclaimer: This script includes code from the stock RSI by Tradingview as well as the Divergence for Many Indicators v4 by LonesomeTheBlue.

Money Supply Index (MSI) by zdmreThe primary objective of the states monetary policy is to maintain price stability with sustainable maximum economic growth. In anticipation of higher inflation , the Central Banks raise short-term interest rate thereby to reduce money supply. Conversely, the Central Banks reduce short-term interest rate to inject additional money into the economy in apprehension of unleashing recessionary forces. The stock markets usually respond negatively to interest rate increases and positively to interest rate decreases. The linkages between money market and stock market a wealth effect due to a change in money supply disturbs the equilibrium in the portfolio of investors.
This index indicates the long-run and short-run dynamic effects of broad money supply (M2) on U.S. stock market (this symbol is optional (Bitcoin, Gold or Oil or other markets etc.)).
#DYOR

ICT Index Futures Session LinesICT Index Futures Session Lines
Description:
The script is based on one of ICT's concepts on trading Index Futures. The script lays out the daily range from an intraday basis.
Range:
00:00 - New York Midnight
08:30 – New York Open (News events come out)
12:00/13:00 - New York Lunch (No trade time period)
13:30 - (Algorithm)
16:30 - Close
* The open, high and low lines are plotted from 00:00 to 08:30
How To Use:
You will need to check the daily bias. Prior to 8:30 you are to look for previous swing points where liquidity may exist. During the open you want to see if a high or low is taken out, and then wait for an energetic break/displacement for a potential FVG/imbalance retracement entry.
Strategy is for LTF (1 to 15m)
Default time zone is set to America/New_York (UTC New York), so lines will be plotted correctly regardless of user’s local UTC chart setting.

FX Mini-Day/Index Dividers V2This is a combination of the Mini-Day Separator Indicator, timings based off the research by Tom Henstridge/@LiquiditySniper and additional Index KZ delineations, based on ICT's 2022 Youtube Mentorship.
*It borrows some minor code from Enricoamato997 . Credit where it is due!
This is a joint effort by myself, @vbwilkes / Offseason Vince and @Tom_FOREX / TraderTom on the Index/Index Future portion.
Index Future Example
Forex Example

Fear and Greed Index CandlesticksThis colours the candlesticks based on my 'Fear and Greed Index'.
All calculations are explained in the code.
The index is mainly based upon the components of the popular fear and greed index website. I've annotated the components in the code for you to look at.
If you're interested, you can replace the final variable 'Total' (within the 'barcolor' function at the very end) with any of the final outputs of the subcomponents to see the results of that single part.
Red = Greed
Green = Fear
Enjoy!

Ehlers Relative Vigor Index [CC]The Relative Vigor Index was created by John Ehlers (Cybernetic Analysis For Stocks And Futures pg 58) and this is a momentum indicator that is similar to the Accumulation Distribution Oscillator created by Jim Waters and Larry Williams. He uses digital signal processing to smooth the indicator to provide clear buy and sell signals. The idea behind this indicator is that during uptrends, prices tend to close near the high and during downtrends, prices tend to close near the low. I have included strong buy and sell signals in addition to normal ones so strong signals are darker in color and normal ones are lighter in color. Buy when the line turns green and sell when it turns red. Usually the best signals I have found for this indicator is when the indicator is below the 0 line and turns green then it is usually a sign of a strong uptrend.
Let me know if there are any other scripts you would like to see me publish!
