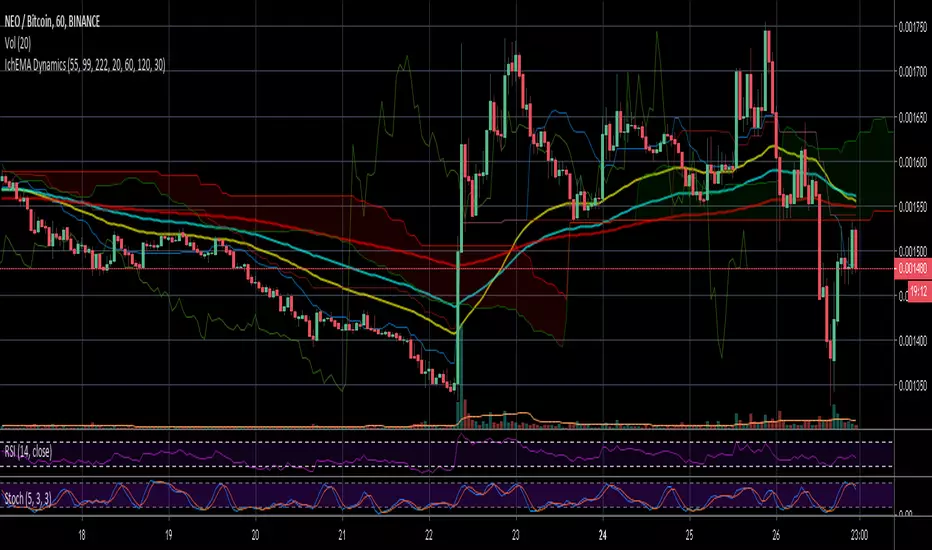
IchEMA Dynamics w/ EMAs and Cloud (for Darth Crypto's TFC Group)This indicator has the EMAs and Ichimoku cloud that make up my IchEMA Dynamic Supports. One of our members is experienced in making scripts, and was working on a much more complex solution that includes indicator functions as well! For now, this will give you my exact indicators for IchEMA dynamic supports. This indicator will automatically use my settings as the default settings.
Buscar en scripts para "ichimoku"
Crypto4Fun Gunbot Script #1This script provides a trigger for Gunbot (or any other bot) combining different indicators on 2 timeframes as follows :
1) on the timeframe of the chart : ichimoku and SMA-spread
2) on the higher timeframe : DI+ and DI- ==> you can select your preferred higher timeframe, preferrably higher than the timeframe of the current chart
All parameters are configurable
Workinstructions :
Add the script to your chart
Move the shown indicator to a window below
Set the email alert as follows : 'plot' value crosses over 95
Feedback and suggestions are welcome

Ali_Trading Tools
This Tools includes the following:
MA:50 with Color Code
MA:100,200
EMA:15
Bollinger Bands
Ichimoku Cloud
Pivot Point High and Low

Ichimoku JrTenkan Jaune suis le prix
Kijun Orange effet elastique
Chikou ici est maintenant projeter dans le passe
SSA moyenne de tenkan et kijun projeter dans le futur
SSB moyenne des 52 dernieres bougie projeter dans le futur

Tran Truong indicatorChỉ báo tìm điểm vào ra thị trường dựa trên phân kỳ hội tụ
bao gồm ichimoku, bollingerband

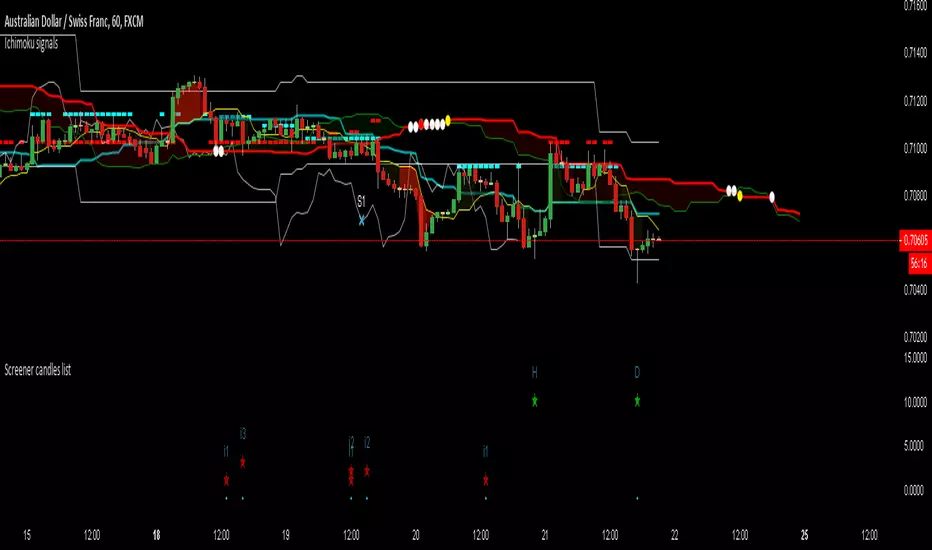
Ichimoku Cloud Daily Offset with Alerts The Skript uses Offsets in both positive and negative direction to give buy and sell alerts.
Use the Script on a daily Timeframe
- No financial advice -
There are 3 Buy and 3 Sell alerts in the Skript.
Buy 1 - B1: Buy e.g. 3%
Buy 2 - B2: Buy e.g. 10%
Buy 3 - B3: Buy e.g. 50%
Sell 1 - S1: Sell e.g. 5%
Sell 2 - S2: Sell e.g. 30%
Sell 3 - S3: Sell e.g. 90%


Daily, Monthly & Weekly Clouds (use on day chart)This indicator offers Ichimoku clouds for periods 1, 7, and 30. When used on the DAILY chart these correspond to the D, W & M time frames respectively.
The indicator just has the clouds right now because that's all I use. It doesn't have tenken, kijun or anything right now.

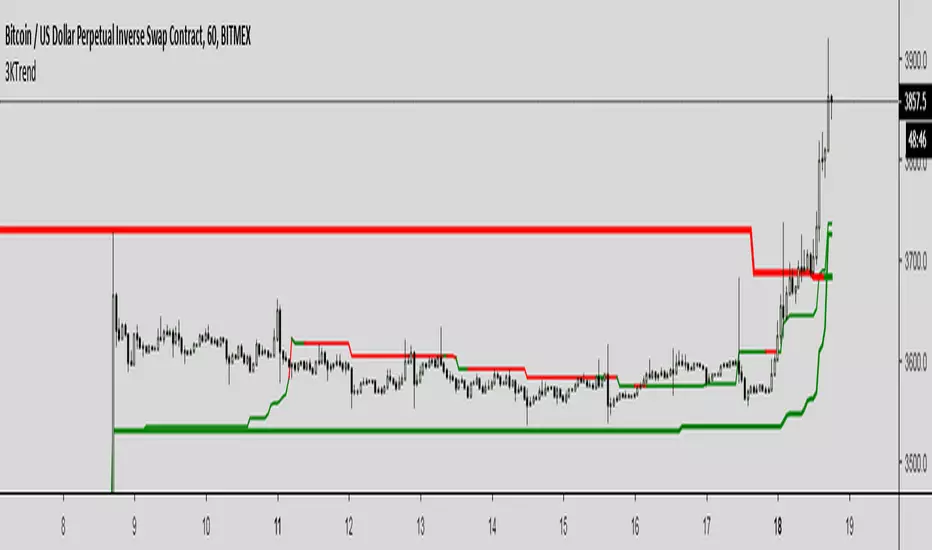
Triple Kijun Trend by SpiralmanIspired from "Oscars Simple Trend Ichimoku Kijun-sen" by CapnOscar
Script displays 3 kijun lines: one for current TF, second one emulates it for TF 4 times higher, third one for x16.
For example on 1H chart there will be 3 kijuns: one for 1H, second one for 4H (emulated), third one for 16H (emulated).
Kijuns change colors based on their position relative to price.
Kijun Sen
The base line, the slower EMA derivative, and a dynamic representation of the mean. With that said, the Kijun serves as both critical support and resistance levels for price. How does it work, and why would the Kijun be superior to commonly used moving average indicators? Fun fact: The Kijun dynamically equalizes itself to be the 50% retracement (or 0.5 Fibonacci level) of price for any given swing, and price will ALWAYS gravitate to the Kijun at some point regardless of how far above or below it is from it. By taking the median of price extremes, the Kijun accounts for volatility that other MAs or EMAs do not. A flat horizontal Kijun means that price extremes have not changed, and that the current trend losing momentum. Crypto-adjusted calculation: (highest high + lowest low) / 2 calculated over the last 60 periods.
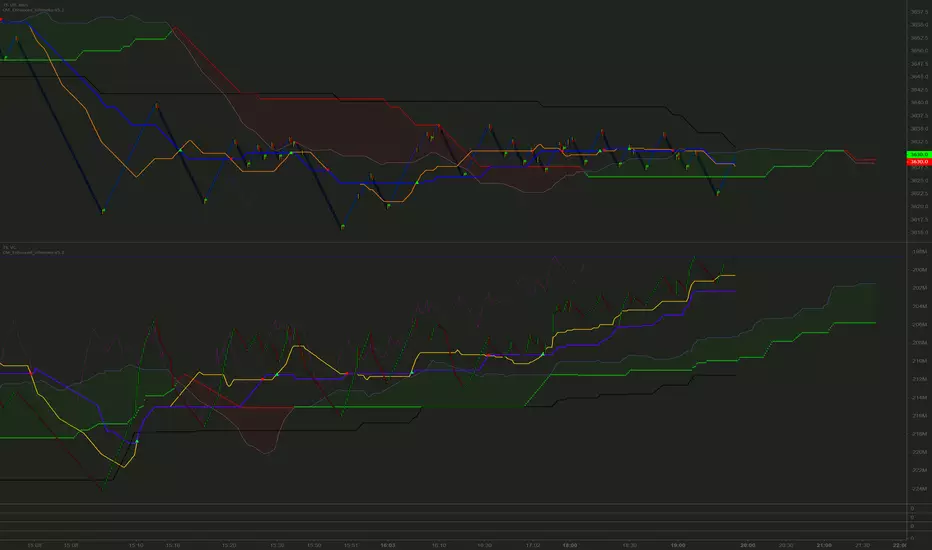
CM_Enhanced_Ichimoku Cloud-V5.3This is the same continuation of CM ichimoku you can find around, fixed little issues here and there, specially removed the check marks from input section (when you give access to styles no need for that), made the cloud color logic much simpler than what I found in 5.2 (seriously), changed the numbers to better fit my renko based system, and finally, the most important part, added an input section so now the users can choose ANY indicator/oscillator as input for ichi IF they want to (in the picture above you can see it working on my volume candle at the same time)
Wobbly (Swing) This Script contain ichimoku's Cloud, Kijunsan, Takensan in multi different Time_Frames ( 30', 60', 240', 1D ) as Resistance and Support
It is useful for Swing in time_frames less than 1H
You can easily understand which line related to which time_frame by Width of lines ( Thicker lines shows Higher Time_Frame )
U can also disable the one might not useful for u on Settings
HoPe U aLl EnJoY NeW_YeAr & This ScRiPt

FOMO DRIVEN SUPERCANDLESIchimoku base candle coloring system
Works well with FDD Cloud Indicator.
For access please go to www.fomodd.io.
Twitter = Telegram = @dgnsrekt
FOMO DRIVEN DEVELOPMENT


All in one indicator[psyche_ky]main indicator with mother B.B theory.
this indicator has MA / EMA , ichimoku , Basic Bollinger Band and Mother band theory.

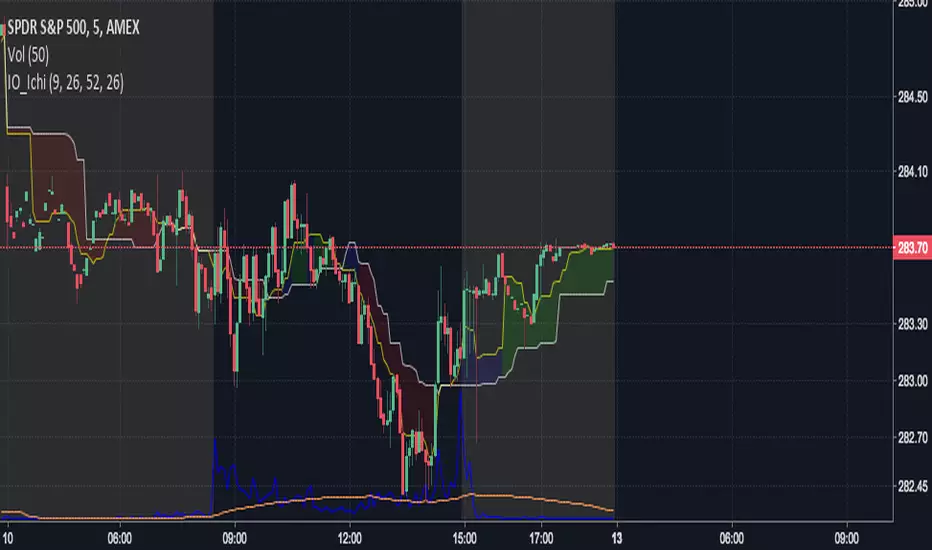
IO_Ichimoku_Simplev1.0
This is a simplified version of Ichimoku cloud: Chikou and Senkou A and B clouds removed
Tenkan and Kijun is color coded based on the following rules:
1. If both Tenkan and Chikou are above Senkou then bullish
2. If both Tenkan and Chikou are below Senkou then bearish
The chart shows a plot of Tenkan and Kijun color coded with the above rules
BottomFinder Adv. Charts Suite V2.0With the advanced charts suite you get multiple indicators you can overlay on your charts, while only using one indicator slot. We made this after requests from our members, to assist those who use a free TV account. IT can take a minute or more to load... be patient! Its not advised to use them all at once, use them in combinations and see what works for you! I wanted to include more indicators, but hit some of the limits imposed by pine script. All options are off by default.
Included are:
Ichimoku Cloud
Support Resistance Fractal
Trailing Long/Short Stoploss
Bull Bear Squares
Triple Hull Moving Average
Standard Hull Moving Average
Fibonacci Daily
Advance Decline Lines
This indicator is available to all our members at no extra charge. If you would like access join us in the link from my signature. You can get a trial of our paid indicators and access to the free ones as well.
Please also like this indicator, and follow me on TradingView for access! We have many more great free indicators coming in the future!

Bryan - Multi Indicator v2Developed as a professional service and published for customer acceptance/verification.
Notes
Ichimoku and ADX combined strategy.
Strategy logic ported to the indicator to allow automation through 3rd party services. (Position management, orders etc)
Long and exit long alert conditions created
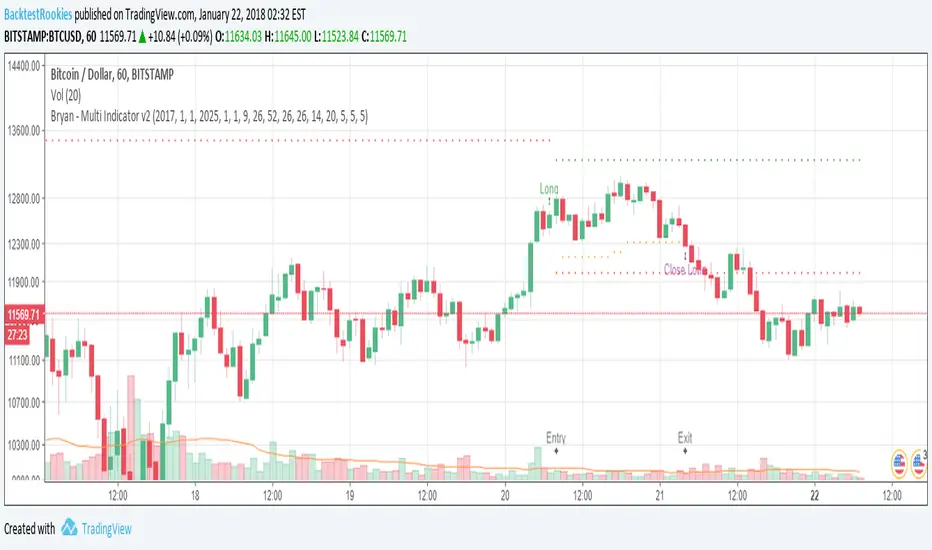
Bryan - Multi IndicatorCustom Indicator - Developed for a Backtest-Rookies customer and published for testing and acceptance.
Ichimoku + ADX combined indicator with custom entry criteria and plotting for buy signals.


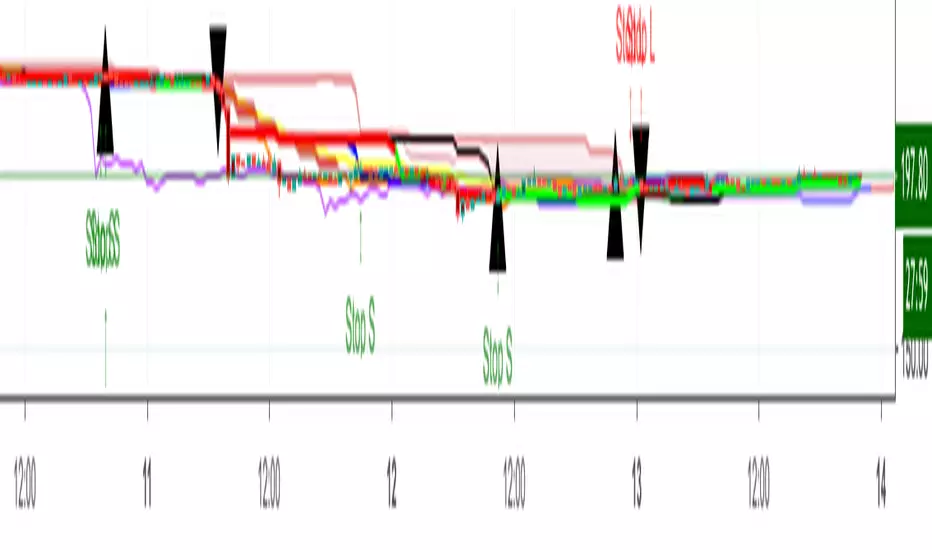
Ichimoku_on_steroids v 1.0 (Scalper's) OLAgain, ichimoku based signal generator, this time using the Kijun-sen (Base line) and the Tenkan-sen (Conversion line) to assess price action.
Works best on timeless charts (e.g. Point & Figure, Renko's, ...).
Use with caution !! ... or with very small TP targets !!

Ichimoku_on_steroids v 1.0 OLBased on the original Ichimoku formula, this indicator provides decent long/short entries/exit signals. It takes into account an EMA on price as well as the two leading lines (without the future projection). Works on all timeframes, on all bar style's (incl. Renko & PnF). Configurable to your taste in the settings.
Black line = EMA on close // Green line = Leading Span A // Red line = Leading Span B
Green = Long bias // Red = Short bias // Yellow = Neutral bias or close position
The cautious trader might want to wait for confirmation (red or green) before entering a position ; the riskier trader might want to enter as soon as neutral territory is reached.
As usual : use it at your own risk ;)
Comments / suggestions welcome
PS: there are more scripts in the pipeline ... :)
