Big Picture 50/200Crazy as this may sound, it took 126 iterations to get something so simple sone right.
Big Picture helps offload some longer-term SMA lines off your chart so you can clutter it up again with some other stuff. It works by comparing SMAs 50 and 200 in histogram form. If the histogram is over the zero-line, 50 is over 200, and vice versa.
The histogram is green when the slope rises, suggesting that 50 is rising relative to 200. When the histogram turns red, 50 is falling.
Some Heikin-Ashi inspired averaging helps smooth the line just a little to help give a better idea as to overall trend.
Buscar en scripts para "histogram"

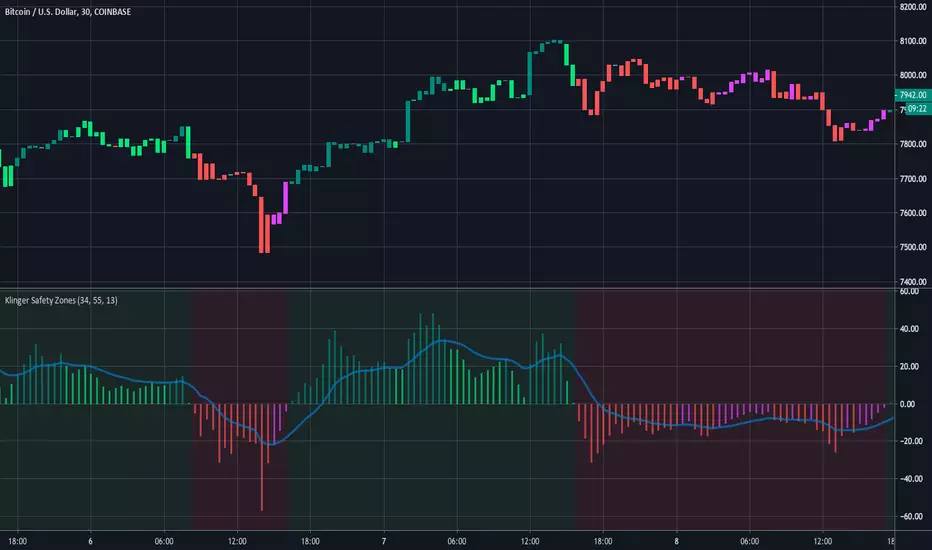
Klinger Safety ZonesThis indicator is based on the Klinger Volume Oscillator, or KVO. The KVO is pretty cool since it can track long-term changes in money flow (both into and out of a market), as well as respond and predict short term price fluctuations.
The Klinger Oscillator determines the direction (or trend) of money flow based on the high, low, and closing price of the security. It then compares all three values (HLC/3) to the previous period’s values to determine how volume should be factored into the KVO. If the current period’s price is greater than that of the previous period, then volume is added. It is subtracted, however, if the price is less than the previous period. This utilization of volume is what makes it an accurate tracker of money flow and a valuable confirmation indicator. This value is often called volume force or the “trend” line.
A fast and slow EMA of the volume force are then calculated. The fast EMA has a smaller window length, while the slow EMA has a larger window. Traders can adjust the lengths of each EMA in the input option menu, but we chose the standard 55 and 34 period lengths as the default settings. We are finally left with the actual KVO value after subtracting the slow EMA from the fast EMA.
The Klinger Oscillator uses a signal line similar to the MACD and many other indicators. The default length for it is 13, but that length can also be adjusted in the input menu. A shorter length will result in more responsiveness but possibly more false signals and whipsaws.
The Chart and Interpretation:
The histogram shows the KVO series. Remember, since the Oscillator represents the difference between the fast and slow EMA, the KVO is bullish when it is greater than zero and bearish when it is less than zero.
When the KVO is greater than zero, the background on the chart is green, meaning that the trend is bullish and traders should look to go long. On the flip side, the background is red when the KVO is less than zero meaning traders should look to go short.
The aqua line plotted on top of the histogram is the signal line.
Here is a quick summary of the histogram colors:
(if KVO > 0 and KVO > signal)
then (color = teal)
if (KVO > 0 and KVO < signal)
then (color = lime)
if (KVO < 0 and KVO < signal)
then (color = red)
if (KVO < 0 and KVO > signal)
then (color = pink)
Users can choose to have the candles change color to match the KVO histogram color by adjusting the setting in the input menu.
~Happy (and safe) trading~
ec tEST cODE FOR pERCENT DIFERENCE ////////////////////////////////////////////////////////////
// Copyright by HPotter v1.0 04/04/2015
// Percent difference between price and MA
////////////////////////////////////////////////////////////
study(title="Percent difference between price and MA")
source = close
useCurrentRes = input(true, title="Use Current Chart Resolution?")
resCustom = input(title="Use Different Timeframe? Uncheck Box Above", type=resolution, defval="60")
smd = input(true, title="Show MacD & Signal Line? Also Turn Off Dots Below")
sd = input(true, title="Show Dots When MacD Crosses Signal Line?")
sh = input(true, title="Show Histogram?")
macd_colorChange = input(true,title="Change MacD Line Color-Signal Line Cross?")
hist_colorChange = input(true,title="MacD Histogram 4 Colors?")
res = useCurrentRes ? period : resCustom
fastLength = input(12, minval=1), slowLength=input(26,minval=1)
signalLength=input(9,minval=1)
fastMA = ema(source, fastLength)
slowMA = ema(source, slowLength)
Length = input(9, minval=1)
Length2= input(36,minval=1)
Length3= input(81,minval=1)
AveragePrice= input(9,minval=1)
Length5= input(3,minval=1)
xSMA = (sma(close, Length)+sma(close, Length2)+sma(close, Length3))/3
pSAM=sma(close, AveragePrice)
nRes = (pSAM - xSMA) * 100 / close
signalnRes = sma(nRes, signalLength)
macd = nRes
signal = sma(macd, signalLength)
hist = macd - signal
outMacD = security(tickerid, res, macd)
outSignal = security(tickerid, res, signal)
outHist = security(tickerid, res, hist)
histA_IsUp = outHist > outHist and outHist > 0
histA_IsDown = outHist < outHist and outHist > 0
histB_IsDown = outHist < outHist and outHist <= 0
histB_IsUp = outHist > outHist and outHist <= 0
//MacD Color Definitions
macd_IsAbove = outMacD >= outSignal
macd_IsBelow = outMacD < outSignal
plot_color = hist_colorChange ? histA_IsUp ? aqua : histA_IsDown ? blue : histB_IsDown ? red : histB_IsUp ? maroon :yellow :gray
macd_color = macd_colorChange ? macd_IsAbove ? lime : red : red
signal_color = macd_colorChange ? macd_IsAbove ? yellow : yellow : lime
circleYPosition = outSignal
// MA COLOR DEFINITION
maColor = change(nRes)>0 ? green : change(nRes)<0 ? red : na
mA_IsAbove = nRes> 0
mA_IsBelow = nRes< 0
plot( nRes, color=maColor, style=line, title="MMA", linewidth=2)
//plot(smd and signalnRes ? signalnRes : na, title="Signal Line", color=signal_color, style=line ,linewidth=2)
//plot(smd and outMacD ? outMacD : na, title="MACD", color=macd_color, linewidth=4)
//plot(smd and outSignal ? outSignal : na, title="Signal Line", color=signal_color, style=line ,linewidth=2)
//plot(sh and outHist ? outHist : na, title="Histogram", color=plot_color, style=histogram, linewidth=4)
plot(sd and cross(outMacD, outSignal) ? circleYPosition : na, title="Cross", style=circles, linewidth=4, color=macd_color)
hline(0, '0 Line', linestyle=solid, linewidth=2, color=white)
//////ALERT cONDITION////
src = input(close)
ma_1 = sma(src, 20)
ma_2 = sma(src, 10)
c = cross(ma_1, ma_2)
alertcondition(c, title='Red crosses blue', message='Red and blue have crossed!')
d = cross(outMacD, outSignal)
alertcondition(d, title='GOING DOWN', message='SELL!')
//
//e = cross(outSignal, outMacD)
//alertcondition(E, title='GOING UP', message='BUY!')

1D & 4H MACD by mattzab1 Day MACD with a color coded area style histogram, with a black line indicating the 4H histogram with + markers to indicate true 4H crosses.
The black line is the outline of the 4H histogram, with a floating cross above to confirm that it is above 0.
4H histogram settings = 6, 13, 5 MACD. Not a true 4H resolution, but extremely close. Effectively, the black line is actually a 2X speed MACD. I prefer it over a true 4H indication.

RSI/MFI - MTF - Entry signals/Trend colored bars - JD@version=2
This indicator is designed to give early entry signals as well as to follow trend moves, according to different settings.
The indicator shows a histogram of the RSI ro MFI in relation to an ema of the RSI or MFI.
The histogram is then smoothed to give early reversal/entry signals.
The actual RSI/MFI line with oversold/overbought indication can be displayed or omitted, as preferred.
in addition to the RSI/MFI line or as an alternative to it, the background colour can be set to change folowing the RSI/MFI signals.
The timeframe can be chosen. Higher timeframes (eg. 3h) tend to give less false signals.
version 5.
added support for custom Multiple Time Frame selection.
added option for choice of RSI or MFI as base indicator.
added option for price bar coloring according to the indicator. (deselecting "borders" in the "style" tab is recommended)
price bar coloring can be adjusted for different strategies:
1. following the slope of the histogram (for faster entry/exit signals)
2. according to positive or negative histogram (for longer moves)
3. according to pos. or neg. RSI/MFI (for longer term trend holds)
4. uptrend: biased towards faster buy signals and slower sell signals to stay in the uptrend
5. downtrend: biased towards faster sell signals and slower buy signals to stay in the downtrend
A longer timeframe (eg. 3x) is recommended for following trend moves.
try different strategies to see what works better for RSI or MFI.
JD.

Luminous Trend Wave [Pineify]```
Luminous Trend Wave - Hull MA Based Normalized Momentum Oscillator
The Luminous Trend Wave (Pineify) is a momentum oscillator designed to provide clear, responsive trend signals while minimizing the lag commonly associated with traditional momentum indicators. By combining Hull Moving Average (HMA) calculations with ATR-based normalization and hyperbolic tangent transformation, LTW delivers a bounded oscillator that works consistently across different assets and timeframes.
Key Features
Hull Moving Average foundation for reduced lag trend detection
ATR normalization for universal applicability across all markets
Bounded output range (-100 to +100) using mathematical tanh transformation
Dynamic gradient coloring that reflects momentum intensity
Built-in signal line for momentum confirmation
Automatic alerts for trend reversals and momentum shifts
How It Works
The indicator operates through a four-stage calculation process:
Trend Basis Calculation: The indicator first calculates a Hull Moving Average (HMA) of the closing price. HMA was chosen specifically because it provides significantly less lag compared to Simple or Exponential Moving Averages while maintaining smoothness. This allows the oscillator to respond quickly to genuine price movements.
Distance Measurement: The raw distance between the current close price and the HMA trend line is calculated. This distance represents how far price has deviated from its smoothed trend.
ATR Normalization: The distance is then divided by the Average True Range (ATR) over the same lookback period. This normalization step is crucial - it makes the oscillator readings comparable across different assets regardless of their price levels or typical volatility. A stock trading at $500 and one at $5 will produce equivalent readings when their relative movements are similar.
Tanh Transformation: Finally, the normalized value is passed through a hyperbolic tangent function scaled by a sensitivity multiplier. The mathematical formula (e^2x - 1) / (e^2x + 1) naturally bounds the output between -100 and +100, preventing extreme spikes while preserving the directional information.
Trading Ideas and Insights
Zero Line Crossovers: When the oscillator crosses above zero, it indicates a shift from bearish to bullish momentum. Conversely, crossing below zero signals bearish momentum. These crossovers can be used as entry triggers when confirmed by other analysis.
Overbought/Oversold Levels: Readings above +80 suggest overbought conditions where price has extended significantly above its trend. Readings below -80 indicate oversold conditions. These extremes often precede mean reversion moves.
Signal Line Divergence: When the main oscillator (histogram) is above the signal line, momentum is increasing. When below, momentum is decreasing. This relationship helps identify the strength of the current move.
Momentum Fading: The indicator automatically fades the color intensity when the oscillator value is closer to the signal line than to the extremes, visually indicating weakening momentum before potential reversals.
How Multiple Indicators Work Together
LTW integrates three distinct technical concepts into a cohesive system:
Hull MA + ATR Integration: The Hull Moving Average provides the trend direction while ATR provides the volatility context. Together, they answer not just "where is the trend?" but "how significant is the current deviation relative to normal market movement?"
Mathematical Bounding + Visual Mapping: The tanh transformation ensures readings stay within predictable bounds, while the gradient coloring maps these bounded values to intuitive visual feedback. Strong bullish readings appear in bright green, strong bearish in bright red, with smooth transitions between.
Oscillator + Signal Line System: Similar to MACD's relationship between the MACD line and signal line, LTW uses a WMA-smoothed signal line to filter noise and confirm momentum direction. The interplay between the faster oscillator and slower signal creates actionable crossover signals.
Unique Aspects
Universal Normalization: Unlike many oscillators that produce different reading ranges on different assets, LTW's ATR normalization ensures consistent interpretation whether trading forex, crypto, stocks, or commodities.
Sensitivity Control: The sensitivity parameter allows traders to adjust how aggressively the oscillator responds to price changes. Higher values make it more responsive (useful for scalping), while lower values smooth out noise (better for swing trading).
Visual Momentum Feedback: The gradient coloring and transparency adjustments provide immediate visual feedback about trend strength without requiring traders to interpret numerical values.
How to Use
Add the indicator to your chart - it displays in a separate pane below price.
Watch for zero line crossovers as primary trend signals. Bullish when crossing above, bearish when crossing below.
Use the ±80 levels as caution zones where reversals become more likely.
Monitor the relationship between the histogram and signal line - histogram above signal indicates strengthening momentum.
Pay attention to color intensity - faded colors indicate weakening momentum and potential reversal zones.
Set alerts for automated notifications on trend changes and momentum shifts.
Customization
Trend Lookback (default: 21): Controls the HMA period. Lower values increase responsiveness but may generate more false signals. Higher values provide smoother trends but with more lag.
Signal Smoothing (default: 5): Adjusts the WMA period for the signal line. Higher values create a slower signal line with fewer crossovers.
Sensitivity (default: 1.5): Multiplier for the tanh transformation. Increase for more reactive signals, decrease for smoother readings.
Colors: Fully customizable bullish and bearish colors to match your chart theme.
Gradients: Toggle gradient coloring on/off based on preference.
Conclusion
The Luminous Trend Wave indicator offers traders a mathematically sound approach to momentum analysis. By combining the low-lag properties of Hull Moving Average with ATR-based normalization and bounded output transformation, LTW provides consistent, interpretable signals across any market. The visual feedback system makes trend strength immediately apparent, while the signal line crossovers offer clear entry and exit timing. Whether used as a standalone tool or combined with price action analysis, LTW helps traders identify trend direction, momentum strength, and potential reversal zones with clarity.
```

Oscillator [Scalping-Algo]█ POSTING OSCILLATOR
A squeeze momentum indicator that detects volatility compression and shows momentum direction.
█ HOW IT WORKS
This indicator combines Bollinger Bands and Keltner Channels to identify "squeeze" conditions — periods of low volatility that often precede explosive moves.
When Bollinger Bands contract inside Keltner Channels, volatility is compressing. When they expand back out, the squeeze "fires" and price typically makes a strong directional move.
█ HISTOGRAM COLORS
🟦 Bright Cyan — Positive momentum, increasing
🟦 Dark Cyan — Positive momentum, decreasing
🟪 Dark Purple — Negative momentum, increasing
🟪 Bright Magenta — Negative momentum, decreasing
█ SQUEEZE DOTS (ZERO LINE)
🟢 Teal — No squeeze (normal volatility)
⚫ Gray — Low squeeze
🔴 Red — Medium squeeze
🟠 Orange — High squeeze (breakout imminent)
█ HOW TO USE
1. Wait for squeeze dots (gray/red/orange) to appear
2. Watch which direction momentum is building
3. Enter when dots turn teal (squeeze fired)
4. Go long if histogram is cyan, short if magenta
5. Consider exit when colors fade (bright → dark)
█ BEST PRACTICES
• Works best on higher timeframes (1H, 4H, Daily)
• Combine with trend analysis and support/resistance
• Most reliable in trending markets
• Avoid trading against major levels
█ SETTINGS
Length: 20 (default) — Period for all calculations
Adjust based on your timeframe and trading style.
█ ALERTS
Set alerts for:
• Histogram crossing zero
• Squeeze firing (dot color change to teal)
• High squeeze detection (orange dots)

Sharpe Ratio [Alpha Extract]A sophisticated risk-adjusted return measurement system that calculates annualized Sharpe Ratio with dynamic color-coded visualization distinguishing return quality across positive and negative performance regimes. Utilizing rolling period calculations with smoothed moving average comparison, this indicator delivers institutional-grade performance assessment with overbought/oversold threshold detection for extreme risk-adjusted return conditions. The system's four-tier color classification combined with histogram fills and background highlighting provides comprehensive visual feedback on whether current returns justify their volatility risk across varying market cycles.
🔶 Advanced Sharpe Ratio Calculation Engine
Implements classic Sharpe Ratio methodology measuring mean daily return divided by return standard deviation with annualization factor for consistent interpretation. The system calculates daily percentage returns, computes rolling mean and standard deviation over configurable periods, applies square root of 365 scaling for annualized comparison, and generates unbounded ratio values where higher positive readings indicate superior risk-adjusted performance.
// Core Sharpe Ratio Framework
Daily_Return = close / close - 1
Mean_Return = ta.sma(Daily_Return, Period)
StdDev_Return = ta.stdev(Daily_Return, Period)
Sharpe_Ratio = (Mean_Return / StdDev_Return) * sqrt(365)
🔶 Dynamic Four-Tier Color Classification
Features sophisticated color logic distinguishing between strong positive returns (green), weakening positive returns (yellow), weakening negative returns (orange), and strong negative returns (red) based on relationship to smoothed average. The system compares current Sharpe against SMA-smoothed baseline, applying green when positive and accelerating, yellow when positive but decelerating, orange when negative but improving, and red when negative and deteriorating for nuanced regime assessment.
🔶 Smoothed Baseline Comparison Framework
Implements SMA smoothing of Sharpe Ratio with configurable period to establish momentum reference line for trend determination within risk-adjusted returns. The system calculates simple moving average of raw Sharpe values, uses this smoothed line as directional benchmark, and determines whether current risk-adjusted performance is strengthening or weakening relative to recent average for color classification logic.
🔶 Extreme Threshold Detection System
Provides overbought and oversold level identification with configurable upper and lower bounds marking exceptional risk-adjusted return extremes. The system defaults to +4.3 for overbought threshold (extremely favorable risk-return profile) and -2.3 for oversold threshold (severely unfavorable risk-return profile), applying dashed horizontal reference lines and background highlighting when Sharpe breaches these statistical extremes requiring attention.
🔶 Histogram Fill Visualization Architecture
Creates gradient-filled histogram between Sharpe Ratio line and zero baseline using dynamic color matching with 30% transparency for intuitive positive/negative return distinction. The system fills area above zero with bullish colors (green/yellow) and below zero with bearish colors (orange/red), providing immediate visual confirmation of whether returns are compensating for volatility risk or destroying risk-adjusted value.
🔶 Background Zone Highlighting Framework
Implements subtle background coloring when Sharpe enters extreme overbought or oversold zones, alerting traders to statistically significant risk-adjusted return conditions. The system applies semi-transparent red background when ratio exceeds +4.3 (exceptionally strong risk-adjusted returns potentially unsustainable) and green background when below -2.3 (severely poor risk-adjusted returns potentially reversionary), creating visual alerts without obscuring price action.
🔶 Annualization Methodology Integration
Utilizes standard square root of time scaling (sqrt(365)) to convert rolling period Sharpe calculations into annualized format for cross-temporal comparison. The system applies this mathematical transformation ensuring Sharpe values represent expected annual risk-adjusted returns regardless of calculation period length, enabling consistent interpretation whether using 100-day or 200-day rolling windows.
🔶 Zero-Line Reference System
Provides critical zero-line plot serving as boundary between positive risk-adjusted returns (capital allocation justified by return/risk profile) and negative risk-adjusted returns (strategy destroying value on risk-adjusted basis). The system emphasizes this threshold as decision point where values above zero suggest continuation while values below zero indicate reconsideration of exposure.
🔶 Momentum-Based Color
Transitions Implements intelligent color switching logic that considers both absolute Sharpe value and its momentum relative to smoothed average, creating four distinct regimes for granular performance assessment. The system enables identification of bullish acceleration (green), bullish deceleration (yellow), bearish improvement (orange), and bearish acceleration (red) for nuanced position management beyond simple positive/negative classification.
🔶 Configurable Period Optimization
Features adjustable calculation period and smoothing length enabling optimization across different trading timeframes and volatility regimes. The system defaults to 150-period calculation (approximately 6-7 months of daily data) with 30-period smoothing, but allows customization from short-term tactical assessment to long-term strategic evaluation based on investment horizon and strategy requirements.
🔶 Performance Optimization Framework
Employs efficient rolling calculations with streamlined daily return processing and optimized standard deviation computation for smooth real-time updates. The system includes minimal computational overhead through single-pass mean and variance calculations, enabling consistent performance across extended historical periods while maintaining accuracy of risk-adjusted return measurements.
This indicator delivers sophisticated risk-adjusted return analysis through classic Sharpe Ratio methodology with enhanced visual classification distinguishing return quality and momentum. Unlike simple return-focused indicators, Sharpe Ratio penalizes volatility ensuring traders evaluate whether returns justify the risk undertaken. The system's four-tier color coding, smoothed baseline comparison, and extreme threshold detection make it essential for portfolio managers and systematic traders seeking objective performance assessment beyond raw price gains. High positive Sharpe values indicate efficient return generation relative to volatility risk, while negative values signal value destruction on risk-adjusted basis requiring strategy reassessment. The indicator excels at identifying periods when risk-taking is rewarded (green zones) versus periods when volatility exceeds returns (red zones) across cryptocurrency, forex, and equity markets for optimal capital allocation decisions.

Mean Reversion [SIMI]This mean reversion indicator identifies extreme price deviations from the mean, providing high-probability reversal signals. Designed for confluence-based trading, it works best when combined with complementary indicators such as VWAP, price action, and volume analysis.
📊 Core Features
Signal Types
Prime Signals (Bright Green/Red Dots): Extreme reversions usually beyond ±1.5 SD - highest probability setups (you can customise this zone!)
Regular Signals (Dark Green/Red Dots): Standard reversions - moderate probability
Leader Line (Pink Dotted): Early warning indicator for potential reversals
Histogram Weakness: Momentum divergence signals
Normalisation Methods:
Institutional Hybrid (Z-ATR) (Recommended): Volatility-adjusted Z-score - adapts to changing market conditions
Percentile Ranking: Statistical ranking - excellent for ranging markets
PPO + ATR Hybrid: Percentage-based with volatility adjustment
Efficiency Ratio: Trend-strength weighted
ATR: Pure volatility-based
None: Raw Z-score
⚙️ Quick Setup Guide
1. Institutional Presets
Pre-configured parameter sets optimised for different timeframes:
5M Day Trading (5/21/5): Intraday scalping
1H Options Trading (6/24/5): Options-focused setups
1D Monthly Cycle (5/20/5): Swing trading
2. Signal Filtering
Prime Thresholds: Adjust ±1.5 SD to control signal quality (tighter = fewer, higher quality, adjust this zone per asset traded)
Dot Filters: Fine-tune entry zones (-0.03/+0.03 default - this ignores noisy signals near Zero line)
Volume Filter: Enable to require volume confirmation (1.4x average recommended, but fine tune yourself)
3. Advanced Filters
Dynamic SD Thresholds: Auto-adjusts for volatility regimes (tighter in low vol, wider in high vol)
Time of Day Filter: Avoids first 30 minutes, last 15 minutes, and lunch hour (11:30-13:00 EST)
💡 Trading Strategy Recommendations
Optimal Usage
This indicator is not intended as a standalone system. Use it for confluence alongside:
VWAP (institutional positioning)
Price action (support/resistance)
Options flow (institutional direction)
Volume analysis (conviction confirmation)
Signal Interpretation
Prime Signals: Wait for these for highest-probability entries - mean reversion may take hours to days
Manual Entries: Don't wait for dots - trade the ±2 SD zones directly using your own confirmation
Options Strategy: Prime sell signals at +2 SD make excellent short call setups; prime buy signals at -2 SD for long calls
Timeframe Guidance
Lower Timeframes (1M-5M): Higher noise - require additional confluence
Higher Timeframes (1H-1D): More reliable signals - suitable for options and swing trades
Best Results: Multi-timeframe analysis (check 1H and 4H alignment on 5M entries)
🔔 Alert System
Master Alert
Enable customisable alerts via the Master Alert System:
Toggle individual signal types (Prime Buy/Sell, SD Crosses, Leader, Histogram)
Receives bespoke messages with ticker, timeframe, and price
One alert condition handles all selected signals
Individual Alerts
Separate alert conditions available for Prime and Regular signals if preferred.
📈 Backtesting Notes
Important: Backtest results are date-sensitive and should not be the primary focus. Instead:
Dial in settings visually on your chosen asset
Aim for signals near actual tops and bottoms
Test different normalisation methods for your specific instrument
Optimise for signal quality, not backtest ROI
Asset Testing: Primarily developed using SPY, QQQ, and IWM as main assets to trade. Other instruments may require parameter adjustment - mess around!
Backtest Engine
Entry/Exit modes (All Signals, Prime Only, Early Signals)
Position sizing (percentage-based)
Slippage and fill method (candle close recommended)
Date range selection
⚠️ Best Practices
Always use confluence - never trade on MR signals alone
Start with Institutional Hybrid normalisation - most adaptive to market conditions
Focus on Prime signals for quality over quantity
Test on your specific asset - optimal settings vary by instrument
Longer timeframes = higher reliability - 1H+ for best results
Enable Time Filter on intraday charts to avoid volatile periods
Use Dynamic SD in highly volatile markets (earnings, FOMC, etc.)
🛠️ Troubleshooting
Too many signals: Increase Prime Thresholds or enable Volume Filter
Too few signals: Decrease Prime Thresholds or reduce Dot Filters
False signals: Enable Time of Day Filter and Dynamic SD
Signals don't align with tops/bottoms: Try different normalisation method
📝 Feedback & Development
Bug Reports: Please report any issues via TradingView comments or direct message.
Strategy Sharing: I'd love to hear how you're using this indicator and what strategies you've developed.
Open Source: Feel free to fork and modify this indicator. If you create an improved version, please share it with the community!
🙏 Acknowledgements
Developed through AI-assisted collaboration.
Special thanks to Lazy Bear for his open source MACD histogram (volume based).
Open source forever - use freely, modify, and share.
Happy Trading!
Remember: Past performance does not guarantee future results. Always manage risk appropriately.
Pandas rock \m/

Scalping Indicator + BJ Signal V3This indicator is designed for 1-minute scalping, combining momentum exhaustion, trend confirmation, and precise entry timing into a single visual tool.
It integrates the following core elements:
Williams %R to identify extreme overbought and oversold conditions
Stochastic (80 / 20 logic) to detect exhaustion, rejection, and re-entry timing
MACD histogram for momentum confirmation
SMA (7) as a short-term trend filter
Sequential-style exhaustion counts (8 / 9) used as contextual reference only
🔹 Signal Logic Overview
Signals are generated exclusively on the 1-minute timeframe
Buy signals focus on:
Exhaustion in oversold conditions
Stochastic recovery from the 20 level
Momentum turning positive on the MACD histogram
Sell signals focus on:
Exhaustion in overbought conditions
Stochastic rejection from the 80 level
Momentum turning negative on the MACD histogram
Background colors highlight potential exhaustion zones, while arrows distinguish between:
Real-time (unconfirmed) signals
Confirmed (closed bar) signals
This design helps traders avoid premature entries during fast market conditions.
⚠️ Important Notes
This indicator is not a standalone trading system
Sequential-style counts are not entry signals by themselves
Always combine with:
Market structure
Session awareness (e.g. high-volatility opens)
Proper risk management
🎯 Best Use Case
1-minute scalping
Short-term mean reversion after momentum exhaustion
Traders who prefer clear, non-repainting visual signals

VIXO - VIX OscillatorVIXO (VIX Oscillator) is a volatility oscillator built from the CBOE Volatility Index (symbol: TVC:VIX). It helps visualize volatility regime shifts by combining a smoothed VIX RSI with a normalized VIX momentum component, plus a VIX histogram that becomes more/less prominent depending on how far VIX is from its moving average. It helps you assess whether market conditions may be approaching rare but powerful squeeze phases.
WHAT THIS INDICATOR PLOTS
1) VIX RSI (cyan line)
- RSI is calculated on the VIX close and then smoothed (SMA) to reduce noise.
- Use it to observe short-term momentum in volatility rather than price.
2) VIX Normalized Momentum (gray line)
- Momentum is measured as ROC (rate of change) of the VIX close.
- That ROC is normalized to a 0–100 scale using a rolling lookback window:
- 50 is the midpoint of the recent momentum range (neutral within the selected window).
- Values near 0/100 indicate momentum near the low/high of that lookback window.
3) VIX Value Bars (histogram)
- Histogram shows the raw VIX value.
- Bar visibility is dynamically adjusted (transparency changes) based on the ratio of VIX to its 21-period SMA:
- When VIX is close to its MA, bars are more transparent.
- When VIX deviates more from its MA (within a capped range), bars become more visible.
- If VIX High is below 30, the script intentionally keeps bars fully transparent to reduce visual clutter.
LEVELS (REFERENCE ONLY)
The horizontal levels are visual guides to help segment oscillator zones. They are not guarantees and should not be treated as standalone trade signals:
- 80: “Panic of Market”
- 60: “VIX says BUY” (label only; not financial advice)
- 50: “Neutral / Momentum Mid”
- 40: “Get Ready”
HOW TO USE
- Apply VIXO to any chart. The indicator always pulls TVC:VIX data, regardless of the chart symbol.
- Typical interpretation:
- Rising VIX RSI and/or rising normalized momentum can indicate increasing volatility pressure.
- Falling readings can indicate volatility easing.
- Compare changes in VIXO with your chart’s price structure, trend filters, or risk management framework.
INPUTS
- RSI Length: RSI period on VIX close (smoothed afterward).
- Momentum Length: ROC period on VIX close.
- Momentum Normalization Lookback: window used to scale ROC into 0–100.
DATA & BEHAVIOR NOTES
- Data source: request.security("TVC:VIX", timeframe.period, OHLC).
- The script does not use lookahead to access future data.
- On realtime bars, values can update while the current bar is forming; historical bars remain fixed once closed.
- Availability of TVC:VIX data depends on your TradingView data access.
IMPORTANT DISCLAIMER
This indicator is provided for educational and informational purposes only and does not constitute financial, investment, or trading advice. It does not predict the future, does not guarantee results, and should not be used as the sole basis for any trading decision. Always validate signals with additional analysis and use appropriate risk management.

ChillLax Distance From Moving Average// show the % distance from the moving average, in colorful histogram
// you can choose :
// : the moving average of the close, default to 200 ma
// : sma or ema, default to sma
// : choose calculation from open or high or low or close (to the ma), default is close
// : threshold % above/below ma, default is 70%. when the stock is above/below
// this threshold, histogram is red (default)
// : otherwise, histogram is blue (default)
// Why this? In William O'neil's book, How to make money in stock, 4th edition, page 264,
// in Climax Top:
// 200-day moving average line. Some stocks may be sold when they are
// 70% to 100% or more above their 200-day moving average price line

CVD Zones & Divergence [Pro]# CVD Zones & Divergence
**Complete CVD order flow toolkit** - Divergences, POC, Profile, and Supply/Demand zones all in one professional indicator.
## 🎯 What It Does
Combines **four powerful order flow tools** into a single, cohesive indicator:
1. **CVD Divergences** - Early warnings + confirmed signals
2. **Point of Control (POC)** - Fair value equilibrium line
3. **CVD Profile** - Visual distribution histogram
4. **Supply/Demand Zones** - Real absorption-based S/R levels
All based on **Cumulative Volume Delta (CVD)** - actual buying/selling pressure, not approximations.
## ✨ Key Features
### 🔄 CVD Divergences (Dual Mode)
**Confirmed Divergences** (High Accuracy)
- Solid lines (customizable colors)
- 🔻 Bear / 🔺 Bull labels
- Win rate: ~70-80%
- Best for swing traders
**Early Warning Mode** ⚡ (Fast Signals)
- Dashed lines (default purple)
- ⚠️ Early Bear / ⚠️ Early Bull labels
- Fires 6+ bars earlier
- Win rate: ~55-65%
- Best for scalpers/day traders
### 🎯 Point of Control (POC)
- **Independent lookback** (300 bars default)
- Yellow line showing fair value
- Where most CVD activity occurred
- Acts as dynamic support/resistance
- Resets and recalculates continuously
### 📊 CVD Profile Histogram
- **Visual CVD distribution** over lookback period
- **Split buy/sell** (blue/orange bars)
- **Value Area** (70% CVD zone highlighted)
- Position: Right/Left/Current (your choice)
- Shows where actual order flow happened
### 📦 Supply/Demand Zones
- **Absorption-based** detection (not guesses!)
- Green = Demand (buyers absorbed 2:1+)
- Red = Supply (sellers absorbed 2:1+)
- Shows **real** institutional levels
- Auto-sorted by strength
- Displays top 8 zones
## 📊 What You See on Chart
```
Your Chart:
├─ 🔴 Red lines (bearish divergences)
├─ 🟢 Green lines (bullish divergences)
├─ 🟣 Purple dashed (early warnings)
├─ 🟡 Yellow POC line (fair value)
├─ 📊 Blue/Orange profile (right side)
├─ 🟢 Green boxes (demand zones)
└─ 🔴 Red boxes (supply zones)
```
## ⚙️ Recommended Settings
### 15m Day Trading (Most Popular)
```
📊 Profile:
- Lookback: 150 bars
- Profile Rows: 24
- Position: Right
🎯 POC:
- POC Lookback: 300 bars
- Show POC: ON
📦 Zones:
- Min Absorption Ratio: 2.0
- HVN Threshold: 1.5
- Max Zones: 8
🔄 Divergences:
- Pivot L/R: 9
- Early Warning: ON
- Early Right Bars: 3
- Min Bars Between: 40
- Min CVD Diff: 5%
```
### 5m Scalping
```
Profile Lookback: 100
POC Lookback: 200
Pivot L/R: 7
Early Warning Right: 2
Min Bars Between: 60
```
### 1H Swing Trading
```
Profile Lookback: 200
POC Lookback: 400-500
Pivot L/R: 12-14
Early Warning Right: 4-5
Min Bars Between: 30
Min CVD Diff: 8%
```
## 💡 How to Trade
### Setup 1: Divergence at Zone ⭐ (BEST - 75%+ win rate)
**Entry:**
- Price hits demand/supply zone
- Divergence appears (early or confirmed)
- Double confluence = high probability
**Example (Long):**
```
1. Price drops into green demand zone
2. ⚠️ Early bullish divergence fires
3. Enter long with tight stop below zone
4. Target: POC or next supply zone
```
**Risk/Reward:** 1:3 to 1:5
---
### Setup 2: POC Bounce/Rejection
**Entry:**
- Price approaches POC line
- Wait for reaction (bounce or rejection)
- Enter in direction of reaction
**Long Setup:**
```
1. Price pulls back to POC from above
2. POC acts as support
3. Bullish divergence appears (confirmation)
4. Enter long, stop below POC
```
**Short Setup:**
```
1. Price rallies to POC from below
2. POC acts as resistance
3. Bearish divergence appears
4. Enter short, stop above POC
```
**Risk/Reward:** 1:2 to 1:4
---
### Setup 3: Zone + Profile Confluence
**Entry:**
- Supply/demand zone aligns with thick profile bar
- Shows high CVD activity at that level
- Triple confluence = very high probability
**Example:**
```
1. Supply zone at 26,100
2. Profile shows heavy selling at 26,100
3. Price rallies to 26,100
4. Bearish divergence appears
5. Enter short
```
**Risk/Reward:** 1:4 to 1:6
---
### Setup 4: Early Warning Scalp ⚡
**Entry (Aggressive):**
- ⚠️ Early warning fires
- Price at zone or POC
- Enter immediately
- Tight stop (1-2 ATR)
**Management:**
```
- Take 50% profit at 1:1
- Move stop to breakeven
- 🔻 Confirmed signal → Trail stop
- Exit rest at target
```
**Risk/Reward:** 1:1.5 to 1:2
**Trades/day:** 3-8
---
### Setup 5: Multi-Timeframe (Advanced)
**Confirmation Required:**
```
Higher TF (1H):
- Confirmed divergence
- At major POC or zone
Lower TF (15m):
- Early warning triggers
- Entry with better timing
```
**Benefits:**
- HTF gives direction
- LTF gives entry
- Best of both worlds
**Risk/Reward:** 1:3 to 1:5
---
## 📊 Component Details
### CVD Profile
**What the colors mean:**
- **Blue bars** = Buying CVD (demand)
- **Orange bars** = Selling CVD (supply)
- **Lighter shade** = Value Area (70% CVD)
- **Thicker bar** = More volume at that price
**How to use:**
- Thick bars = Support/Resistance
- Profile shape shows market structure
- Balanced profile = range
- Skewed profile = trend
---
### Supply/Demand Zones
**How they're detected:**
1. High Volume Node (1.5x average)
2. CVD buy/sell ratio calculated
3. Ratio ≥ 2.0 → Zone created
4. Sorted by strength (top 8 shown)
**Zone labels show:**
- Type: "Demand" or "Supply"
- Ratio: "2.8:1" = strength
**Not like other indicators:**
- ❌ Other tools use price action alone
- ✅ This uses actual CVD absorption
- Shows WHERE limit orders defended levels
---
### Point of Control (POC)
**What it shows:**
- Price with highest CVD activity
- Market's "fair value"
- Dynamic S/R level
**How to use:**
- Price above POC = bullish bias
- Price below POC = bearish bias
- POC retest = trading opportunity
- POC cross = trend change signal
**Independent lookback:**
- Profile: 150 bars (short-term)
- POC: 300 bars (longer-term context)
- Gives stable, relevant POC
---
## 🔧 Settings Explained
### 📊 Profile Settings
**Lookback Bars** (150 default)
- How many bars for profile calculation
- Lower = more recent, reactive
- Higher = more historical, stable
**Profile Rows** (24 default)
- Granularity of distribution
- Lower = coarser (faster)
- Higher = finer detail (slower)
**Profile Position**
- Right: After current price
- Left: Before lookback period
- Current: At lookback start
**Value Area** (70% default)
- Highlights main CVD concentration
- 70% is standard
- Higher % = wider zone
---
### 🎯 POC Settings
**POC Lookback** (300 default)
- Independent from profile
- Longer = more stable POC
- Shorter = more reactive POC
**Show POC Line/Label**
- Toggle visibility
- Customize color/width
---
### 📦 Zone Settings
**Min Absorption Ratio** (2.0 default)
- Buy/Sell threshold for zones
- 2.0 = 2:1 ratio minimum
- Higher = fewer, stronger zones
**HVN Threshold** (1.5 default)
- Volume must be 1.5x average
- Higher = stricter filtering
- Lower = more zones
**Max Zones** (8 default)
- Limits display clutter
- Shows strongest N zones only
---
### 🔄 Divergence Settings
**Pivot Left/Right** (9/9 default)
- Bars to confirm pivot
- Higher = slower, more confirmed
- Lower = faster, less confirmed
**Early Warning**
- ON = Show early signals
- Early Right Bars (3 default)
- 3 = 6 bars faster than confirmed
**Filters:**
- Min Bars Between (40): Prevents spam
- Min CVD Diff % (5): Filters weak signals
**Visual:**
- Line styles: Solid/Dashed/Dotted
- Colors: Customize all 4 types
- Labels: Toggle ON/OFF
---
## 🎨 Color Customization
**Divergences:**
- Bullish Confirmed: Green (default)
- Bearish Confirmed: Red (default)
- Early Bullish: Purple (default)
- Early Bearish: Purple (default)
**Zones & Profile:**
- Bull/Demand: Green
- Bear/Supply: Red
- Buy CVD Profile: Blue
- Sell CVD Profile: Orange
- Value Area Up/Down: Lighter blue/orange
**POC:**
- POC Color: Yellow (default)
All customizable to your preference!
---
## 🔔 Alerts Available
**6 Alert Types:**
1. 🔻 Bearish Divergence (confirmed)
2. 🔺 Bullish Divergence (confirmed)
3. ⚠️ Early Bearish Warning
4. ⚠️ Early Bullish Warning
5. (Manual: POC cross)
6. (Manual: Zone touch)
**Setup:**
1. Click Alert (⏰)
2. Choose "CVD Zones & Divergence"
3. Select alert type
4. Configure notification
5. Create!
---
## 💎 Pro Tips
### From Experienced Traders:
**"Use zones with divergences for best setups"**
- Zone alone: 60% win rate
- Divergence alone: 65% win rate
- Both together: 75%+ win rate
**"POC is your friend"**
- Price tends to revert to POC
- Great target for counter-trend trades
- POC cross = potential trend change
**"Profile tells the story"**
- Thick bars = institutional levels
- Balanced profile = range-bound
- Skewed high = distribution (top)
- Skewed low = accumulation (bottom)
**"Early warnings for entries, confirmed for confidence"**
- Early = better entry price
- Confirmed = validation
- Use both in scale-in strategy
**"Filter by timeframe"**
- 1m-5m: Very fast, many signals
- 15m: Sweet spot for most traders
- 1H-4H: High quality, fewer signals
---
## 🔧 Tuning Guide
### Too Cluttered?
**Simplify:**
```
✅ Show Divergences: ON
✅ Show POC: ON
❌ Show Zones: OFF (or reduce to 4-5)
❌ Show Value Area: OFF
❌ Divergence Labels: OFF
→ Clean chart with just lines + POC
```
### Missing Opportunities?
**More Signals:**
```
↓ Pivot Right: 6-7
↓ Early Warning Right: 2
↓ Min Bars Between: 25-30
↓ Min CVD Diff: 2-3%
↓ Min Absorption Ratio: 1.8
```
### Too Many False Signals?
**Stricter Filters:**
```
↑ Pivot Right: 12-15
↑ Min Bars Between: 60
↑ Min CVD Diff: 8-10%
↑ Min Absorption Ratio: 2.5
↓ Max Zones: 4-5
```
### POC Not Making Sense?
**Adjust POC Lookback:**
```
If too high: Increase to 400-500
If too low: Increase to 400-500
If jumping around: Increase to 500+
→ Longer lookback = more stable POC
```
---
## ❓ FAQ
**Q: Difference from CVD Divergence (standalone)?**
A: This is the **complete package**:
- Divergence tool = divergences only
- This = divergences + POC + profile + zones
- Use divergence tool for clean charts
- Use this for full analysis
**Q: Too slow/laggy?**
A: Reduce computational load:
```
Profile Rows: 18 (from 24)
Lookback: 100 (from 150)
Max Zones: 5 (from 8)
```
**Q: No volume data error?**
A: Symbol has no volume
- Works: Futures, stocks, crypto
- Maybe: Forex (broker-dependent)
- Doesn't work: Some forex pairs
**Q: Can I use just some features?**
A: Absolutely! Toggle what you want:
```
Zones only: Turn off divergences + POC
POC only: Turn off zones + divergences
Divergences only: Turn off zones + POC + profile
Mix and match as needed!
```
**Q: Best timeframe?**
A:
- **1m-5m**: Scalping (busy, many signals)
- **15m**: Day trading ⭐ (recommended)
- **1H-4H**: Swing trading (quality signals)
- **Daily**: Position trading (very selective)
**Q: Works on crypto/forex/stocks?**
A:
- ✅ Futures: Excellent
- ✅ Stocks: Excellent
- ✅ Crypto: Very good (major pairs)
- ⚠️ Forex: Depends on broker volume
---
## 📈 Performance Expectations
### Realistic Win Rates
| Strategy | Win Rate | Avg R/R | Trades/Week |
|----------|----------|---------|-------------|
| Early warnings only | 55-65% | 1:1.5 | 15-30 |
| Confirmed only | 70-80% | 1:2 | 8-15 |
| Divergence + Zone | 75-85% | 1:3 | 5-12 |
| Full confluence (all 4) | 80-90% | 1:4+ | 3-8 |
**Keys to success:**
- Don't trade every signal
- Wait for confluence
- Proper risk management
- Trade what you see, not what you think
---
## 🚀 Quick Start
**New User (5 minutes):**
1. ✅ Add to 15m chart
2. ✅ Default settings work well
3. ✅ Watch for 1 week (don't trade yet!)
4. ✅ Note which setups work best
5. ✅ Backtest on 50+ signals
6. ✅ Start with small size
7. ✅ Scale up slowly
**First Trade Checklist:**
- Divergence + Zone/POC = confluence
- Clear S/R level nearby
- Risk/reward minimum 1:2
- Position size = 1% risk max
- Stop loss placed
- Target identified
- Journal entry ready
---
## 📊 What Makes This Special?
**Most indicators:**
- Use RSI/MACD divergences (lagging)
- Guess at S/R zones (subjective)
- Don't show actual order flow
**This indicator:**
- Uses real CVD (actual volume delta)
- Absorption-based zones (real orders)
- Profile shows distribution (real activity)
- POC shows equilibrium (real fair value)
- All from one data source (coherent)
**Result:**
- Everything aligns
- No conflicting signals
- True order flow analysis
- Professional-grade toolkit
---
## 🎯 Trading Philosophy
**Remember:**
- Indicator shows you WHERE to look
- YOU decide whether to trade
- Quality over quantity always
- Risk management is #1
- Patience beats aggression
**Best trades have:**
- ✅ Multiple confluences
- ✅ Clear risk/reward
- ✅ Obvious invalidation point
- ✅ Aligned with trend/context
**Worst trades have:**
- ❌ Single signal only
- ❌ Poor location (middle of nowhere)
- ❌ Unclear stop placement
- ❌ Counter to all context
---
## ⚠️ Risk Disclaimer
**Important:**
- Past performance ≠ future results
- All trading involves risk
- Only risk what you can afford to lose
- This is a tool, not financial advice
- Use proper position sizing
- Keep a trading journal
- Consider professional advice
**Your responsibility:**
- Which setups to trade
- Position size
- Entry/exit timing
- Risk management
- Emotional control
**Success = Tool + Strategy + Discipline + Risk Management**
---
## 📝 Version History
**v1.0** - Current Release
- CVD divergences (confirmed + early warning)
- Point of Control (independent lookback)
- CVD profile histogram
- Supply/demand absorption zones
- Value area visualization
- 6 alert types
- Full customization
---
## 💬 Community
**Questions?** Drop a comment below
**Success story?** Share with the community
**Feature request?** Let me know
**Bug report?** Provide details in comments
---
**Happy Trading! 🚀📊**
*Professional order flow analysis in one indicator.*
**Like this?** ⭐ Follow for more quality tools!

Volatility Squeeze Pro [JOAT]
Volatility Squeeze Pro — Advanced Volatility Compression Analysis System
This indicator addresses a specific analytical challenge in volatility analysis: how to identify periods when different volatility measurements show compression relationships that may indicate potential energy buildup in the market. It combines two distinct volatility calculation methods—standard deviation-based bands and ATR-based channels—with a momentum oscillator to provide comprehensive volatility state analysis.
Why This Combination Provides Unique Analytical Value
Traditional volatility indicators typically focus on single measurements, but markets exhibit different types of volatility that require different analytical approaches:
1. **Closing Price Volatility** (Standard Deviation): Measures how much closing prices deviate from their average
2. **Trading Range Volatility** (ATR): Measures the actual high-to-low trading ranges
3. **Directional Momentum**: Measures where price sits within its recent range
The problem with using these individually:
- Standard deviation alone doesn't account for intraday volatility
- ATR alone doesn't consider closing price clustering
- Momentum alone doesn't provide volatility context
- No single measurement captures the complete volatility picture
This indicator's originality lies in creating a comprehensive volatility analysis system that:
**Identifies Volatility Compression**: When closing price volatility contracts inside trading range volatility, it suggests potential energy buildup
**Provides Momentum Context**: Shows directional bias during compression periods
**Offers Multi-Dimensional Analysis**: Combines three different analytical approaches into one coherent system
**Delivers Real-Time Assessment**: Continuously monitors the relationship between different volatility types
Technical Innovation and Originality
While individual components (Bollinger Bands, Keltner Channels, Linear Regression) are standard, the innovation lies in:
1. **Volatility Relationship Detection**: The mathematical comparison between standard deviation bands and ATR channels creates a unique compression identification system
2. **Integrated Momentum Analysis**: Linear regression-based momentum calculation provides directional context specifically during volatility compression periods
3. **Multi-State Visualization**: The indicator provides clear visual encoding of different volatility states (compressed vs. normal) with momentum direction
4. **Adaptive Threshold System**: The squeeze detection automatically adapts to different instruments and timeframes without manual calibration
How the Components Work Together Analytically
The three components create a comprehensive volatility analysis framework:
**Standard Deviation Component**: Measures closing price dispersion around the mean
float bbBasis = ta.sma(close, bbLength)
float bbDev = bbMult * ta.stdev(close, bbLength)
float bbUpper = bbBasis + bbDev
float bbLower = bbBasis - bbDev
**ATR Channel Component**: Measures actual trading range volatility
float kcBasis = ta.ema(close, kcLength)
float kcRange = ta.atr(atrLength)
float kcUpper = kcBasis + kcRange * kcMult
float kcLower = kcBasis - kcRange * kcMult
**Squeeze Detection Logic**: Identifies when closing price volatility compresses within trading range volatility
bool squeezeOn = bbLower > kcLower and bbUpper < kcUpper
// This condition indicates closing prices are clustering more tightly
// than the typical trading range would suggest
**Momentum Context Component**: Provides directional bias during compression
float highestHigh = ta.highest(high, momLength)
float lowestLow = ta.lowest(low, momLength)
float momentum = ta.linreg(close - math.avg(highestHigh, lowestLow), momLength, 0)
float momSmooth = ta.sma(momentum, smoothLength)
The analytical relationship creates a system where:
- Squeeze detection identifies WHEN volatility compression occurs
- Momentum analysis shows WHERE price is positioned during compression
- Combined analysis provides both timing and directional context
How the Volatility Comparison Works
The indicator compares two volatility measurements:
Standard Deviation Bands
These measure how much closing prices deviate from their average. When prices cluster tightly around the average, the bands contract.
// Standard deviation bands calculation
float bbBasis = ta.sma(close, bbLength)
float bbDev = bbMult * ta.stdev(close, bbLength)
float bbUpper = bbBasis + bbDev
float bbLower = bbBasis - bbDev
ATR-Based Channels
These measure volatility using Average True Range—the typical distance between high and low prices. They respond to the actual trading range rather than closing price dispersion.
// ATR-based channels calculation
float kcBasis = ta.ema(close, kcLength)
float kcRange = ta.atr(atrLength)
float kcUpper = kcBasis + kcRange * kcMult
float kcLower = kcBasis - kcRange * kcMult
The Squeeze Condition
A "squeeze" is detected when the standard deviation bands are completely contained within the ATR channels:
// Squeeze detection
bool squeezeOn = bbLower > kcLower and bbUpper < kcUpper
This condition indicates that closing price volatility has compressed relative to the overall trading range.
The Momentum Component
The momentum oscillator measures where price sits relative to its recent high-low range, using linear regression for smoothing:
// Momentum calculation
float highestHigh = ta.highest(high, momLength)
float lowestLow = ta.lowest(low, momLength)
float momentum = ta.linreg(close - math.avg(highestHigh, lowestLow), momLength, 0)
float momSmooth = ta.sma(momentum, smoothLength)
Positive values indicate price is above the midpoint of its recent range; negative values indicate below.
Why Display Both Together
The squeeze detection shows WHEN volatility is compressed. The momentum reading shows the current directional bias of price within that compression. Together, they provide two pieces of information:
1. Is volatility currently compressed? (squeeze status)
2. Where is price leaning within the current range? (momentum)
These are observations about current conditions, not predictions about future movement.
Visual Elements
Momentum Histogram — Bars showing momentum value
- Green shades: Positive momentum (price above range midpoint)
- Red shades: Negative momentum (price below range midpoint)
- Brighter colors: Momentum increasing
- Faded colors: Momentum decreasing
Squeeze Dots — Circles on the zero line
- Red: Squeeze condition active
- Green: No squeeze condition
Release Markers — Triangle markers when squeeze condition ends
Dashboard — Current readings and status
Color Scheme
Squeeze Active — #FF5252 (red)
No Squeeze — #4CAF50 (green)
Momentum Positive — #00E676 / #81C784 (green shades)
Momentum Negative — #FF5252 / #E57373 (red shades)
Inputs
Standard Deviation Bands:
Length (default: 20)
Multiplier (default: 2.0)
ATR Channels:
Length (default: 20)
Multiplier (default: 1.5)
ATR Period (default: 10)
Momentum:
Length (default: 12)
Smoothing (default: 3)
How to Read the Display
Red dots indicate the squeeze condition is present
Green dots indicate normal volatility relationship
Histogram direction shows current momentum bias
Histogram color brightness shows whether momentum is increasing or decreasing
Alerts
Squeeze condition started
Squeeze condition ended
Squeeze ended with positive momentum
Squeeze ended with negative momentum
Extended squeeze (8+ bars)
Important Limitations and Realistic Expectations
Volatility compression detection is a mathematical relationship between calculations—it does not predict future price movements
Many compression periods do not result in significant price expansion or directional moves
Momentum direction during compression does not reliably indicate future breakout direction
This indicator analyzes current and historical volatility conditions only—it cannot predict future volatility
False signals are common—not every squeeze leads to tradeable price movement
Different parameter settings will produce different compression detection sensitivity
Market conditions, news events, and fundamental factors often override technical volatility patterns
No volatility indicator can predict the timing, direction, or magnitude of future price movements
This tool should be used as one component of comprehensive market analysis
Appropriate Use Cases
This indicator is designed for:
- Volatility state analysis and monitoring
- Educational study of volatility relationships
- Multi-dimensional volatility assessment
- Supplementary analysis alongside other technical tools
- Understanding market compression/expansion cycles
This indicator is NOT designed for:
- Standalone trading signal generation
- Guaranteed breakout prediction
- Automated trading system triggers
- Market timing precision
- Replacement of fundamental analysis
Understanding Volatility Analysis Limitations
Volatility analysis, while useful for understanding market conditions, has inherent limitations:
- Past volatility patterns do not guarantee future patterns
- Compression periods can extend much longer than expected
- Expansion periods may be brief and insufficient for trading
- External factors (news, fundamentals) often override technical patterns
- Different markets and timeframes exhibit different volatility characteristics
— Made with passion by officialjackofalltrades

NSE Swing Breadth NSE Swing Breadth – Market Health Dashboard (0–200, % from Neutral)
Overview
NSE Swing Breadth – Market Health Dashboard is a market-wide health and regime indicator designed to track internal strength and participation across Large-, Mid-, and Small-cap indices in the Indian equity market.
Instead of focusing on price alone, this tool measures how strongly each segment is behaving relative to its own swing trend, normalizes those movements, and combines them into a single Market Health score. The result is a clean, objective dashboard that helps traders identify Risk-On, Caution, and Risk-Off regimes.
This indicator is best used for position sizing, exposure control, and timing aggressiveness, rather than individual stock entries.
Data Used
The indicator internally tracks three broad NSE indices:
Large Caps → NIFTY100EQUALWEIGHT
Mid Caps → NIFTYMIDCAP150
Small Caps → NIFTYSMLCAP250
Using equal-weighted and broad indices ensures the signal reflects true market participation, not just index heavyweights.
Core Logic
1. Swing Strength Model
For each index, the script calculates normalized swing strength:
Price is compared to its EMA swing baseline
The deviation from the EMA is normalized using the EMA of absolute deviations
This creates a volatility-adjusted strength value, allowing fair comparison across market regimes
This answers the question:
Is this segment pushing meaningfully above or below its recent trend?
2. Strength Converted to % from Neutral (Baseline = 100)
Each segment’s strength is converted into percentage-style points around a neutral baseline of 100:
100 = Neutral
+15 = +15% strength above neutral
–20 = –20% weakness below neutral
These values are plotted as three smooth lines:
Blue → Large Caps
Orange → Mid Caps
Purple → Small Caps
This makes relative leadership and divergence immediately visible.
3. Market Health Score (0–100)
The indicator combines all three segments into a single Market Health score:
Large Caps → 40% weight
Mid Caps → 35% weight
Small Caps → 25% weight
Extreme values are clamped to avoid distortion, and the final score is normalized to a 0–100 scale:
70–100 → Strong, broad participation
40–69 → Mixed / unstable participation
0–39 → Weak, risk-off conditions
Visual Components
📊 Market Health Histogram
A vertical histogram displays Market Health (0–100) with enhanced visibility:
🟢 Green (≥ 70) → Strong Risk-On regime
🟠 Orange (40–69) → Caution / Transition
🔴 Red (< 40) → Risk-Off regime
The histogram is visually compact and designed to reflect true market health, not exaggerated spikes.
📈 Strength Lines (Baseline = 100)
Three strength lines show % deviation from neutral:
Above 100 → Positive internal strength
Below 100 → Internal weakness
These lines help identify:
Leadership (which segment is driving the market)
Early deterioration (small/mid caps weakening first)
Broad confirmation (all segments rising together)
Dashboard Tables
📌 Market Regime Table (Bottom-Left)
Displays the current market regime:
🟢 RISK ON
🟡 CAUTION
🔴 RISK OFF
Along with the exact Market Health score (0–100).
📌 Strength Table (Top-Right)
Shows Large / Mid / Small cap strength as % from neutral, for example:
+18% → 18% above neutral
–12% → 12% below neutral
This avoids misleading interpretations and keeps values intuitive and actionable.
How to Use This Indicator
Risk-On (Green)
Favor full position sizes, trend-following strategies, and broader participation trades.
Caution (Orange)
Reduce leverage, tighten stops, and be selective. Expect choppiness.
Risk-Off (Red)
Prioritize capital protection, reduce exposure, and avoid aggressive longs.
This indicator is not an entry signal — it is a market environment filter.
⚠️ Important Style Setting (Required)
For correct visualization:
Settings → Style → Uncheck “Labels on price scale”
This prevents the indicator’s internal 0–200 model scale from interfering with the chart’s price scale and keeps the pane clean and readable.
Summary
NSE Swing Breadth – Market Health Dashboard provides a clear, objective view of market internals, helping traders align their risk with the true underlying condition of the market — not just price movement.
It is especially effective for:
Market regime identification
Exposure management
Avoiding false breakouts in weak breadth environments

VEGA (Velocity of Efficient Gain Adaptation)VEGA (Velocity of Efficient Gain Adaptation)
VEGA is a momentum oscillator that measures the velocity of an efficiency-weighted adaptive moving average. Unlike traditional momentum indicators that react uniformly to all price movements, VEGA intelligently adapts its sensitivity based on market conditions—responding quickly during trending periods and filtering noise during consolidation.
--------------------------------
What Makes VEGA Different
Efficiency-Driven Adaptation
At its core, VEGA uses the Efficiency Ratio (ER) to distinguish between trending and choppy markets. When price moves efficiently in one direction, VEGA's underlying adaptive MA speeds up to capture the move. When price chops sideways, it slows down to avoid whipsaws. This creates a momentum reading that's inherently cleaner than fixed-period alternatives.
Linear Regression Smoothed Source
VEGA offers an optional LinReg-smoothed price source that blends regular candles with linear regression values. This pre-smoothing reduces noise before it ever enters the calculation, resulting in a histogram that's easier to read without sacrificing responsiveness. The mix ratio lets you dial in exactly how much smoothing you want.
Z-Score Normalization with Dead Zone
Rather than arbitrary oscillator bounds, VEGA normalizes output as standard deviations from the mean. This gives statistically meaningful levels: readings above +2σ or below -2σ represent genuinely extreme momentum. The configurable dead zone (with Snap, Soft Fade, or None modes) filters out insignificant movements near zero, keeping you focused on signals that matter.
--------------------------------
How It Works
1. Source Preparation — Price is smoothed via a LinReg/regular candle blend
2. Efficiency Ratio — Measures directional movement vs total movement over the lookback period
3. Adaptive MA — Applies variable smoothing based on efficiency (fast during trends, slow during chop)
4. Velocity — Calculates the rate of change of the adaptive MA
5. Normalization — Converts to Z-Score (standard deviations) or ATR-normalized percentage
6. Dead Zone — Optionally filters near-zero values to reduce noise
--------------------------------
How To Read VEGA
Signal and Interpretation
Histogram above zero | Bullish momentum
Histogram below zero | Bearish momentum
Bright color | Momentum accelerating
Faded color | Momentum decelerating
Beyond ±1σ bands | Above-average momentum
Beyond ±2σ bands | Extreme momentum (potential reversal zone)
Zero line cross*| Momentum shift
--------------------------------
Key Settings
ER Length — Lookback for efficiency ratio calculation. Higher = smoother, slower adaptation.
Fast/Slow Smoothing — Controls the adaptive MA's responsiveness range. The MA blends between these based on efficiency.
LinReg Settings — Enable smoothed candles and adjust the blend ratio (0 = regular candles, 1 = full LinReg, 0.5 = 50/50 mix).
Z-Score Lookback — Period for calculating mean and standard deviation. Shorter = more reactive normalization.
Dead Zone Type — How to handle near-zero values:
Snap — Hard cutoff to zero
Soft Fade — Gradual reduction toward zero
None — No filtering
Dead Zone Threshold — Values within this Z-Score range are affected by the dead zone setting.
VEGA works on any timeframe and any market. For best results, adjust the ER Length and LinReg settings to match your trading style and the volatility characteristics of your instrument.

Dual MTF Confirmed Trend Strategy (5m Entry / 15m MACD & RSI) v1That is a detailed Dual Multi-Timeframe (MTF) Confirmed Trend Strategy written in Pine Script for TradingView. The core idea of this strategy is to only take entry signals on a faster timeframe (5-minute) when the trend is strongly confirmed on a slower, higher timeframe (15-minute). This aims to reduce false signals and trade in the direction of the dominant trend. Here is an explanation of how the strategy works, broken down by section:
1. 5-Minute Entry Filters 🚀This section calculates several indicators on the current 5-minute chart to identify potential trade setups. A position is only considered if all 5-minute conditions align.
Supertrend: A trend-following indicator based on Average True Range (ATR).
Long Condition: The closing price must be above the Supertrend line.
Short Condition: The closing price must be below the Supertrend line.
Gann Hi-Lo (GHL): A trend indicator using Simple Moving Averages (SMA) of the high and low prices. GHL Line: Switches between the SMA of the Highs and the SMA of the Lows based on price action.
Long Condition: The closing price must be above the GHL line.
Short Condition: The closing price must be below the GHL line.
Exponential Moving Averages (EMAs): It uses a 50-period EMA and a 100-period EMA to confirm the short-term trend direction.
Long Condition: The closing price must be above both the 50 EMA and the 100 EMA.
Short Condition: The closing price must be below both the 50 EMA and the 100 EMA.
2. 15-Minute MTF Confirmation Filters ⏳This is the crucial step where the strategy verifies the trend on the slower, 15-minute timeframe using the request security function. This step acts as a gatekeeper to ensure the 5-minute trade aligns with the larger trend.
MACD Histogram (12, 26, 9): The difference between the MACD Line and the Signal Line.
Long Confirmation: The 15m MACD Histogram must be greater than 0 (MACD line is above the Signal line, indicating bullish momentum).
Short Confirmation: The 15m MACD Histogram must be less than 0 (MACD line is below the Signal line, indicating bearish momentum).
RSI (Relative Strength Index) (14): A momentum oscillator. The 50 level is often used to determine the general market trend.
Long Confirmation: The 15m RSI must be greater than 50 (indicating stronger bullish momentum).
Short Confirmation: The 15m RSI must be less than 50 (indicating stronger bearish momentum).
The Total 15m Confirmation is only true if both the MACD and the RSI confirmation signals align.
3. Trade Orders (Entry Logic) ⚖️
The strategy only executes a trade when the 5-minute entry conditions are met AND the 15-minute confirmation conditions are met.
Final Long Condition:
5m Conditions (Supertrend, GHL, EMA alignment) AND
15m Confirmation (MACD Hist > 0 AND RSI > 50)
Final Short Condition:
5m Conditions (Supertrend, GHL, EMA alignment) AND
15m Confirmation (MACD Hist < 0 AND RSI < 50)
When a trade signal is generated, the strategy:
Closes any opposite position (e.g., closes a "Short" trade if a "Long" signal appears).
Enters the new position (e.g., enters a "Long" trade).
This is designed as a reversal strategy where a new entry automatically closes the previous opposing trade.
In Summary
The strategy operates on a principle of Trend Alignment:
5-Minute Chart: Is used for Signal Timing (when exactly to enter the market).
15-Minute Chart: Is used for Trend Validation (is the overall market momentum supporting the signal?).
It's an attempt to capture short-term moves (5m signals) that are backed by strong medium-term momentum (15m confirmation), thereby aiming for higher probability trades.
This is not investment advice; it is recommended to perform optimization and backtesting for the assets intended for implementation.

X VFI (LB) w absorptiona variation of the On-Balance Volume (OBV) introduced by Markos Katsanos and further refined by LazyBear, is a robust volume-based momentum oscillator designed to measure the strength and direction of money flow. It utilizes advanced filtering mechanisms to enhance signal quality for active trading environments. This version has added an absorption feature.
Core Functionality and Enhancements
Filtered Volume Flow: The VFI is calculated using the Typical Price (HLC/3) and incorporates filters for Volatility (coef) and Excessive Volume (vcoef). This ensures the indicator responds only to price changes supported by sustained, relevant volume, filtering out market noise and anomalous spikes.
Zero-Line Bias: VFI values above zero indicate net accumulation (bullish flow), while values below zero indicate net distribution (bearish flow).
Signal Line Timing (vfima): The Exponential Moving Average (EMA) of the VFI acts as the Signal Line. Crossovers between the VFI (fast line) and the Signal Line are primary triggers for trade entries and exits.
Absorption/Distribution Signals
This customized version introduces unique features to visually isolate periods where underlying volume conviction contradicts immediate price action—the most powerful setups for reversals and strong continuations.
Absorption/Distribution Highlighting:
The histogram's color is dynamically changed to highlight hidden buying or selling pressure:
(Absorption Signal): Indicates strong positive VFI momentum occurring on a bearish (down) candle. This signals aggressive buying absorption of supply, where large traders are accumulating positions despite brief selling pressure, often preceding a sharp upward move.
(Distribution Signal): Indicates strong negative VFI momentum occurring on a bullish (up) candle. This signals aggressive selling distribution into demand, where large traders are offloading positions into brief rallies, often preceding a sharp downward move.
Volume-Filtered Conviction: The visual intensity (transparency) of the signal color is adjusted based on a Volume Filter (minVolFilter). Darker, solid colors denote high-conviction signals supported by above-average volume, while transparent colors indicate lower-conviction signals.
Histogram Magnification:
The magnification input allows users to visually increase the height of the histogram bars (e.g., 2x). This enhances the immediate visual recognition of momentum acceleration or deceleration.

Multi-Timeframe TTM Squeeze Pro with alerts and screenersBased of John Carters TTM Squeeze. Must open the settings and select wether you want to match the timeframe in your chart. This must be done in the pinescreener as well otherwise results will not be correct.
---
# **Squeeze Momentum Pro – Enhanced Screener + EMA Cross Alerts**
This custom version of the Squeeze Momentum indicator expands the standard TTM-style squeeze with screening and automated alert logic so you can quickly find high-quality setups across many tickers.
---
## **What This Script Does**
This indicator plots a three-level squeeze visual similar to TTM Squeeze:
Dot meanings in this indicator
Orange dot:
Strongest squeeze – Bollinger Bands are inside the tightest Keltner level (highest volatility compression).
Red dot:
Medium squeeze – still compressed, but not as tight as orange.
Black dot:
Weak squeeze / lowest level of volatility compression.
Price is coiling, but not as tight as the higher levels.
Green dot (“Fired”):
Squeeze has released — Bollinger Bands have expanded out of the channels and momentum is moving.
A momentum histogram is plotted to show directional pressure during the squeeze.
---
## **Major Improvements Added**
### **① Screenable Conditions for Stock Scanners**
This version includes multiple `alertcondition()` flags so the script can be used as a **Pine Screener inside TradingView**.
Currently it can screen for:
✔ Price closing above the 50-SMA
✔ Presence of an **orange (strong) squeeze dot**
✔ 6/20 EMA crossover signals inside a squeeze
These can be used inside the TradingView Screener or in watchlists to automatically highlight qualifying tickers.
---
### **② 6/20 EMA Trend Signals (Filtered by Squeeze)**
A crossover system was added:
* **Bullish Signal:** 6 EMA crosses above 20 EMA
* **Bearish Signal:** 6 EMA crosses below 20 EMA
But **these signals only trigger if the market is in a red or orange squeeze**, which helps remove noise and focus on valid setups.
---
### **③ Visual Markers Under the Histogram**
Whenever an EMA crossover occurs during a squeeze:
* A **green up-triangle** is plotted for a bullish cross
* A **red down-triangle** for a bearish cross
These markers are drawn **below the histogram**, keeping the display clean while still providing quick visual cues.
---
### **④ Fully Non-Repainting Logic**
All signals and squeeze calculations are based on standard fully-resolved `ta.*` functions, making the results stable both in backtesting and real-time.
---
## **Who This Script Helps**
This version is ideal for:
* Traders who use TradingView’s screener and want automated breakout/continuation filtering
* Traders who scan large watchlists for squeeze setups
* Users who want trend confirmation during volatility compression
---
## **How to Use It**
1. Add the script to your chart
2. Open TradingView Alerts or Screener
3. Select the conditions you want, for example:
* *“Orange Squeeze Detected”*
* *“Squeeze Fire after 3 squeeze dots*
* *“4 REd Dots in a row.”*
* *“Buy Alert”*
* *“EMA 6/20 Bullish Crossover (Squeeze Only)”*
* *“Close Above 50 SMA”*
Once active, TradingView will automatically flag symbols that meet the criteria.
---
## **Summary**
This enhanced Squeeze Momentum indicator turns the standard TTM-style visual into a **true screening and alert system** by adding:
* Multi-level squeezes
* EMA trend signals
* Screener-compatible alert conditions
* Clean visual signals
* Non-repainting logic
It helps traders quickly locate high-probability setups across any watchlist or market.

MTF RSI — Centered at Zero# 🌟 **MTF RSI — Centered at Zero(英語版 Description)**
**A multi–timeframe RSI tool designed for trend-filtered entries and safer reversal timing.
This script transforms both the current timeframe RSI and the 4H RSI by centering them at zero (RSI − 50), giving a clean, intuitive regime view.**
---
## 🔍 **Core Concept**
Traditional RSI fluctuates between 0–100, but the true trend cue lies in the relationship to 50.
By centering RSI at zero, you instantly see:
* **Above 0 → bullish pressure**
* **Below 0 → bearish pressure**
On top of this, the script plots the **4H RSI as a histogram**, allowing you to visually confirm whether the market is in a BUY-ONLY or SELL-ONLY environment before taking any signals.
---
## 🎯 **What This Script Helps You Do**
* Avoid dangerous counter-trend trades
* Identify high-quality reversal points only when aligned with the 4H trend
* Enter pullbacks or bounces with noticeably higher accuracy
* Visually detect regime strength and extreme conditions (RSI >70 / <30)
Even during aggressive trending markets, the combined filter
**(4H regime + local RSI extreme + initial reversal signal)**
keeps you only in high-probability opportunities.
---
## 💡 **Color Logic**
### Vertical stripe (per-bar):
* 🔴 **Overbought (RSI >70)** — red / pink
* 🔵 **Oversold (RSI <30)** — blue
* Colors become stronger when the 4H and current RSI extremes align
* Option to show history or only the most recent bar
### Histogram (4H RSI – 50):
* Pink column above 0 → bullish bias
* Blue column below 0 → bearish bias
### Pivot Signals:
* 🟠 **Buy Signal**: RSI crosses up from local weakness *AND* 4H is BUY-ONLY
* 🔴 **Sell Signal**: RSI crosses down from local strength *AND* 4H is SELL-ONLY
These signals often align with classical **Granville #4 / #8** (deep pullback reversals).
---
## ⏱️ **Timeframe Usage**
Works well on:
* **5m** for active traders
* **15m** for conservative entries
* **1H** for swing confirmation
All of them rely on the same principle:
**“Let the 4H trend guide the direction, and take only high-probability reversals.”**
---
## 🚀 **Best Use Case**
Enter only when:
1. 4H histogram clearly shows BUY-ONLY or SELL-ONLY
2. Local RSI hits extreme zones
3. A bounce or breakdown occurs
4. Your stop-loss is clearly defined beneath the reversal structure
This combination creates consistently **small losses, larger wins** —
ideal for systematic short-term trading.
---
---
# 🌟 **MTF RSI — Centered at Zero(日本語版 Description)**
**RSIを 50 でセンタリングすることで、
“相場が上に傾いているのか / 下に傾いているのか” を一瞬で判別できる、
マルチタイムフレーム対応のRSIトレンド・フィルタースクリプトです。**
---
## 🔍 **スクリプトの核心**
RSIの本質は「50を境に強弱が決まる」ことにあります。
そこで **RSI − 50** を使い、
* **0より上 → 上昇バイアス**
* **0より下 → 下降バイアス**
となるように変換しています。
4時間足RSIも同様にゼロ基準でヒストグラム化するため、
**いま市場の“支配方向(BUY ONLY / SELL ONLY)”がひと目で分かる仕様** にしています。
---
## 🎯 **このスクリプトが解決する課題**
* トレンドに逆らった“危険な逆張り”を避けられる
* 4時間足トレンドと一致したときだけ反転シグナルが出る
* 押し目買い・戻り売りの精度が高まる
* 極端ゾーン(RSI >70 / <30)を自動で縦ストライプ表示
特に、
**4時間足のトレンド + 極端ゾーン + 初動シグナル(RSI反転)**
のセットアップは実戦での成功率が非常に高いです。
---
## 🎨 **カラーの意味**
### ◆ 縦ストライプ(バー単位)
* 🔴 RSI > 70 → オーバーボート(赤/ピンク)
* 🔵 RSI < 30 → オーバーソールド(青)
* 4Hも同方向の極端であれば濃く表示
* 「過去の塗りを消すモード」搭載(今バーのみ表示)
### ◆ 4時間足ヒストグラム(RSI − 50)
* ピンク:上昇圧力(BUY ONLY に近い)
* 青:下降圧力(SELL ONLY に近い)
### ◆ 反転シグナル
* 🟠 BUY:RSIが弱い領域から上抜け + 4H BUY ONLY
* 🔴 SELL:RSIが強すぎる領域から下抜け + 4H SELL ONLY
これはグランビルの4番/8番(深い押し・戻りの反転)にも一致します。
---
## 🕒 **推奨タイムフレーム**
* 5分足:素早くエントリーしたい人
* 15分足:最も安定
* 1時間足:ゆったり目線のスイング向け
---
## 🚀 **ベストな使い方**
以下の条件が揃ったとき、統計的に最も強いエントリーになります:
1. 4時間足RSIヒストグラムが BUY ONLY / SELL ONLY
2. 15分足RSIが極端ゾーンに到達
3. 反転初動のシグナルが点灯
4. 損切りラインが構築できている
(直近安値・高値のすぐ外側)
これにより、**損小利大でブレの少ないトレード** が可能になります。

Range Oascilator + LessDivergences + MACD+StochRSIRange Oscillator + EMA Filter
Calculates a custom oscillator based on the highest high and lowest low over a chosen period.
Generates BUY signals when the oscillator crosses up from the oversold zone and price is above the EMA.
Generates SELL signals when the oscillator crosses down from the overbought zone and price is below the EMA.
MACD (3‑10‑16 EMA Settings)
Uses fast EMA = 3, slow EMA = 10, signal EMA = 16.
Detects bullish and bearish crossovers.
These crossovers only trigger a single unified buy/sell signal if they coincide with Stochastic RSI being in oversold (for buy) or overbought (for sell) zones.
Stochastic RSI
Standard calculation with %K and %D smoothing.
Defines oversold (<20) and overbought (>80) zones.
Used both for divergence detection and as a filter for MACD signals.
Divergence Detection
RSI Divergence: Price makes a lower low but RSI makes a higher low (bullish), or price makes a higher high but RSI makes a lower high (bearish).
MACD Histogram Divergence: Price makes a lower low but MACD histogram makes a higher low (bullish), or price makes a higher high but MACD histogram makes a lower high (bearish).
Stochastic RSI Divergence: Similar logic applied to %K line.
Divergences are flagged only once per pivot to avoid repetitive signals.
Visuals
EMA plotted on chart.
BUY/SELL signals shown as triangles above/below bars.
Divergences shown as labels (e.g., “RSI BullDiv”, “MACD BearDiv”).
Unified MACD+Stoch RSI signals shown in distinct colors (lime for buy, orange for sell).

MA SMART Angle
### 📊 WHAT IS MA SMART ANGLE?
**MA SMART Angle** is an advanced momentum and trend detection indicator that analyzes the angles (slopes) of multiple moving averages to generate clear, non-repainting BUY and SELL signals.
**Original Concept Credit:** This indicator builds upon the "MA Angles" concept originally created by **JD** (also known as Duyck). The core angle calculation methodology and Jurik Moving Average (JMA) implementation by **Everget** are preserved from the original open-source work. The angle calculation formula was contributed by **KyJ**. This enhanced version is published with respect to the open-source nature of the original indicator.
Original indicator reference: "ma angles - JD" by Duyck
---
## 🎯 ORIGINALITY & VALUE PROPOSITION
### **What Makes This Different from the Original:**
While the original "MA Angles" by **JD** provided excellent angle visualization, it lacked actionable entry signals. **MA SMART Angle** addresses this by adding:
**1. Clear Entry/Exit Signals**
- Explicit BUY/SELL arrows based on angle crossovers, momentum confirmation, and MA alignment
- No guessing when to enter trades - the indicator tells you exactly when conditions align
**2. Non-Repainting Logic**
- All signals use confirmed historical data (shifted by 2 bars minimum)
- Critical for backtesting reliability and live trading confidence
- Original indicator could repaint signals on current bar
**3. Dual Signal System**
- **Simple Mode:** More frequent signals based on angle crossovers + momentum (for active traders)
- **Strict Mode:** Requires full multi-MA alignment + momentum confirmation (for conservative traders)
- Adaptable to different trading styles and risk tolerances
**4. Smart Signal Filtering**
- **Anti-spam cooldown:** Prevents duplicate signals within configurable bar count
- **No-trade zone detection:** Filters out low-conviction sideways markets automatically
- **Multi-timeframe MA alignment:** Ensures all moving averages agree on direction before signaling
**5. Enhanced Visualization**
- Large, clear BUY/SELL arrows with descriptive labels
- Color-coded backgrounds for market states (trending vs. ranging)
- Momentum histogram showing acceleration/deceleration in real-time
- Live status table displaying trend strength, angle value, momentum, and MA alignment
**6. Professional Alert System**
- Four distinct alert conditions: BUY Signal, SELL Signal, Strong BUY, Strong SELL
- Enables automated trade notifications and strategy integration
**7. Modified MA Periods**
- Original used EMA(27), EMA(83), EMA(278)
- Enhanced version uses faster EMA(3), EMA(8), EMA(13) for more responsive signals
- Better suited for modern volatile markets and shorter timeframes
---
## 📐 HOW IT WORKS - TECHNICAL EXPLANATION
### **Core Methodology:**
The indicator calculates angles (slopes) for five key moving averages:
- **JMA (Jurik Moving Average)** - Smooth, lag-reduced trend line (original implementation by **Everget**)
- **JMA Fast** - Responsive momentum indicator with higher power parameter
- **MA27 (EMA 3)** - Primary fast-moving average for signal generation
- **MA83 (EMA 8)** - Medium-term trend confirmation
- **MA278 (EMA 13)** - Slower trend filter
### **Angle Calculation Formula (by KyJ):**
```
angle = arctan((MA - MA ) / ATR(14)) × (180 / π)
```
**Why ATR normalization?**
- Makes angles comparable across different instruments (forex, stocks, crypto)
- Makes angles comparable across different timeframes
- Accounts for volatility - a 10-point move in different assets has different significance
**Angle Interpretation:**
- **> 15°** = Strong trend (momentum accelerating)
- **0° to 15°** = Weak trend (momentum present but moderate)
- **-2° to +2°** = No-trade zone (sideways/choppy market)
- **< -15°** = Strong downtrend
### **Signal Generation Logic:**
#### **BUY Signal Conditions:**
1. MA27 angle crosses above 0° (upward momentum initiates)
2. All three EMAs (3, 8, 13) pointing upward (trend alignment confirmed)
3. Momentum is positive for 2+ bars (acceleration, not deceleration)
4. Angle exceeds minimum threshold (not in no-trade zone)
5. Cooldown period passed (prevents signal spam)
#### **SELL Signal Conditions:**
1. MA27 angle crosses below 0° (downward momentum initiates)
2. All three EMAs pointing downward (downtrend alignment)
3. Momentum is negative for 2+ bars
4. Angle below negative threshold (not in no-trade zone)
5. Cooldown period passed
#### **Strong BUY+ / SELL+ Signals:**
Additional entry opportunities when JMA Fast crosses JMA Slow while maintaining strong directional angle - indicates momentum acceleration within established trend.
---
## 🔧 HOW TO USE
### **Recommended Settings by Trading Style:**
**Scalpers / Day Traders:**
- Signal Type: **Simple**
- Minimum Angle: **3-5°**
- Cooldown Bars: **3-5 bars**
- Timeframes: 1m, 5m, 15m
**Swing Traders:**
- Signal Type: **Strict**
- Minimum Angle: **7-10°**
- Cooldown Bars: **8-12 bars**
- Timeframes: 1H, 4H, Daily
**Position Traders:**
- Signal Type: **Strict**
- Minimum Angle: **10-15°**
- Cooldown Bars: **15-20 bars**
- Timeframes: Daily, Weekly
### **Parameter Descriptions:**
**1. Source** (default: OHLC4)
- Price data used for MA calculations
- OHLC4 provides smoothest angles
- Close is more responsive but noisier
**2. Threshold for No-Trade Zones** (default: 2°)
- Angles below this are considered sideways/ranging
- Increase for stricter filtering of choppy markets
- Decrease to allow signals in quieter trending periods
**3. Signal Type** (Simple vs. Strict)
- **Simple:** Angle crossover OR (trend + momentum)
- **Strict:** Angle crossover AND all MAs aligned AND momentum confirmed
- Start with Simple, switch to Strict if too many false signals
**4. Minimum Angle for Signal** (default: 5°)
- Only generate signals when angle exceeds this threshold
- Higher values = stronger trends required
- Lower values = more sensitive to momentum changes
**5. Cooldown Bars** (default: 5)
- Minimum bars between consecutive signals
- Prevents spam during volatile chop
- Scale with your timeframe (higher TF = more bars)
**6. Color Bars** (default: true)
- Colors chart bars based on signal state
- Green = bullish conditions, Red = bearish conditions
- Can disable if you prefer clean price bars
**7. Background Colors**
- **Yellow background** = No-trade zone (low angle, ranging market)
- **Green flash** = BUY signal generated
- **Red flash** = SELL signal generated
- All customizable or can be disabled
---
## 📊 INTERPRETING THE INDICATOR
### **Visual Elements:**
**Main Chart Window:**
- **Thick Lime/Fuchsia Line** = MA27 angle (primary signal line)
- **Medium Green/Red Line** = MA83 angle (trend confirmation)
- **Thin Green/Red Line** = MA278 angle (slow trend filter)
- **Aqua/Orange Line** = JMA Fast (momentum detector)
- **Green/Red Area** = JMA slope (overall trend context)
- **Blue/Purple Histogram** = Momentum (angle acceleration/deceleration)
**Signal Arrows:**
- **Large Green ▲ "BUY"** = Primary buy signal (all conditions met)
- **Small Green ▲ "BUY+"** = Strong momentum buy (JMA fast cross)
- **Large Red ▼ "SELL"** = Primary sell signal (all conditions met)
- **Small Red ▼ "SELL+"** = Strong momentum sell (JMA fast cross)
**Status Table (Top Right):**
- **Angle:** Current MA27 angle in degrees
- **Trend:** Classification (STRONG UP/DOWN, UP/DOWN, FLAT)
- **Momentum:** Acceleration state (ACCEL UP/DN, Up/Down)
- **MAs:** Alignment status (ALL UP/DOWN, Mixed)
- **Zone:** Trading zone status (ACTIVE vs. NO TRADE)
- **Last:** Bars since last signal
### **Trading Strategies:**
**Strategy 1: Pure Signal Following**
- Enter LONG on BUY signal
- Exit on SELL signal
- Use stop-loss at recent swing low/high
- Works best on trending instruments
**Strategy 2: Confirmation with Price Action**
- Wait for BUY signal + bullish candlestick pattern
- Wait for SELL signal + bearish candlestick pattern
- Increases win rate by filtering premature signals
- Recommended for beginners
**Strategy 3: Momentum Acceleration**
- Use BUY+/SELL+ signals for adding to positions
- Only take these in direction of primary signal
- Scalp quick moves during momentum spikes
- For experienced traders
**Strategy 4: Mean Reversion in No-Trade Zones**
- When status shows "NO TRADE", fade extremes
- Wait for angle to exit no-trade zone for reversal
- Contrarian approach for range-bound markets
- Requires tight stops
---
## ⚠️ LIMITATIONS & DISCLAIMERS
**What This Indicator DOES:**
✅ Measures momentum direction and strength via angle analysis
✅ Generates signals when multiple conditions align
✅ Filters out low-conviction sideways markets
✅ Provides visual clarity on trend state
**What This Indicator DOES NOT:**
❌ Predict future price movements with certainty
❌ Guarantee profitable trades (no indicator can)
❌ Work equally well on all instruments/timeframes
❌ Replace proper risk management and position sizing
**Known Limitations:**
- **Lagging Nature:** Like all moving averages, signals occur after momentum begins
- **Whipsaw Risk:** Can generate false signals in volatile, directionless markets
- **Optimization Required:** Parameters need adjustment for different assets
- **Not a Complete System:** Should be combined with risk management, position sizing, and other analysis
**Best Performance Conditions:**
- Strong trending markets (crypto bull runs, stock breakouts)
- Liquid instruments (major forex pairs, large-cap stocks)
- Appropriate timeframe selection (match to trading style)
- Used alongside support/resistance and volume analysis
---
## 🔔 ALERT SETUP
The indicator includes four alert conditions:
**1. BUY SIGNAL**
- Message: "MA SMART Angle: BUY SIGNAL! Angle crossed up with momentum"
- Use for: Primary long entries
**2. SELL SIGNAL**
- Message: "MA SMART Angle: SELL SIGNAL! Angle crossed down with momentum"
- Use for: Primary short entries or long exits
**3. Strong BUY**
- Message: "MA SMART Angle: Strong BUY momentum - JMA fast crossed up"
- Use for: Adding to longs or aggressive entries
**4. Strong SELL**
- Message: "MA SMART Angle: Strong SELL momentum - JMA fast crossed down"
- Use for: Adding to shorts or aggressive exits
**Setting Up Alerts:**
1. Right-click indicator → "Add Alert on MA SMART Angle"
2. Select desired condition from dropdown
3. Choose notification method (popup, email, webhook)
4. Set alert expiration (typically "Once Per Bar Close")
---
## 📚 EDUCATIONAL VALUE
This indicator serves as an excellent learning tool for understanding:
**1. Angle-Based Momentum Analysis**
- Traditional indicators show MA crossovers
- This shows the *rate of change* (velocity) of MAs
- Teaches traders to think in terms of momentum acceleration
**2. Multi-Timeframe Confirmation**
- Shows how fast, medium, and slow MAs interact
- Demonstrates importance of trend alignment
- Helps develop patience for high-probability setups
**3. Signal Quality vs. Quantity Tradeoff**
- Simple mode = more signals, more noise
- Strict mode = fewer signals, higher quality
- Teaches discretionary filtering skills
**4. Market State Recognition**
- Visual distinction between trending and ranging markets
- Helps traders avoid trading choppy conditions
- Develops "market context" awareness
---
## 🔄 DIFFERENCES FROM OTHER MA INDICATORS
**vs. Traditional MA Crossovers:**
- Measures momentum (angle) rather than just price crossing MA
- Provides earlier signals as angles change before price crosses
- Filters better for sideways markets using no-trade zones
**vs. MACD:**
- Uses multiple MAs instead of just two
- ATR normalization makes it universal across instruments
- Visual angle representation more intuitive than histogram
**vs. Supertrend:**
- Not based on ATR bands but on MA slope analysis
- Provides graduated strength indication (not just binary trend)
- Less prone to whipsaw in low volatility
**vs. Original "MA Angles" by JD:**
- Adds explicit entry/exit signals (original had none)
- Implements no-repaint logic for reliability
- Includes signal filtering and quality controls
- Provides dual signal systems (Simple/Strict)
- Enhanced visualization and status monitoring
- Uses faster MA periods (3/8/13 vs 27/83/278) for modern markets
---
## 📖 CODE STRUCTURE (for Pine Script learners)
This indicator demonstrates:
**Advanced Pine Script Techniques:**
- Custom function implementation (JMA, angle calculation)
- Var declarations for stateful tracking
- Table creation for HUD display
- Multi-condition signal logic
- Alert system integration
- Proper use of historical references for no-repaint
**Code Organization:**
- Modular function definitions (JMA, angle)
- Clear separation of concerns (inputs, calculations, plotting, alerts)
- Extensive commenting for maintainability
- Best practices for Pine Script v5
**Learning Resources:**
- Study the JMA function to understand adaptive smoothing
- Examine angle calculation for ATR normalization technique
- Review signal logic for multi-condition confirmation patterns
- Analyze anti-spam filtering for state management
The code is open-source - feel free to study, modify, and improve upon it!
---
## 🙏 CREDITS & ATTRIBUTION
**Original Concepts:**
- **"ma angles - JD" by JD (Duyck)** - Core angle calculation methodology and indicator concept
Original open-source indicator on TradingView Community Scripts
- **JMA (Jurik Moving Average) implementation by Everget** - Smooth, low-lag moving average function
Acknowledged in original JD indicator code
- **Angle Calculation formula by KyJ** - Mathematical formula for converting MA slope to degrees using ATR normalization
Acknowledged in original JD indicator code comments
**Enhancements in This Version:**
- Signal generation logic - Original implementation for this indicator
- No-repaint confirmation system - Original implementation
- Dual signal modes (Simple/Strict) - Original implementation
- Visual enhancements and status table - Original implementation
- Alert system and signal filtering - Original implementation
- Modified MA periods (3/8/13 instead of 27/83/278) - Optimization for modern markets
**Open Source Philosophy:**
This indicator follows the open-source spirit of TradingView and the Pine Script community. The original "ma angles - JD" by JD (Duyck) was published as open-source, enabling this enhanced version. Similarly, this code is published as open-source to allow further community improvements.
---
## ⚡ QUICK START GUIDE
**For New Users:**
1. Add indicator to chart
2. Start with default settings (Simple mode)
3. Wait for BUY signal (green arrow)
4. Observe how price behaves after signal
5. Check status table to understand market state
6. Adjust parameters based on your instrument/timeframe
**For Experienced Traders:**
1. Switch to Strict mode for higher quality signals
2. Increase cooldown bars to reduce frequency
3. Raise minimum angle threshold for stronger trends
4. Combine with your existing strategy for confirmation
5. Set up alerts for desired signal types
6. Backtest on your preferred instruments
---
## 🎓 RECOMMENDED COMBINATIONS
**Works Well With:**
- **Volume Analysis:** Confirm signals with volume spikes
- **Support/Resistance:** Take signals near key levels
- **RSI/Stochastic:** Avoid overbought/oversold extremes
- **ATR:** Size positions based on volatility
- **Price Action:** Wait for candlestick confirmation
**Complementary Indicators:**
- Order Flow / Footprint (for institutional confirmation)
- Volume Profile (for identifying value areas)
- VWAP (for intraday mean reversion reference)
- Fibonacci Retracements (for target setting)
---
## 📈 PERFORMANCE EXPECTATIONS
**Realistic Win Rates:**
- Simple Mode: 45-55% (higher frequency, moderate accuracy)
- Strict Mode: 55-65% (lower frequency, higher accuracy)
- Combined with price action: 60-70%
**Best Asset Classes:**
1. **Cryptocurrencies** (strong trends, clear signals)
2. **Forex Major Pairs** (smooth price action, good angles)
3. **Large-Cap Stocks** (trending behavior, liquid)
4. **Index Futures** (trending instruments)
**Challenging Conditions:**
- Low volatility consolidation periods
- News-driven erratic movements
- Thin/illiquid instruments
- Counter-trending markets
---
## 🛡️ RISK DISCLAIMER
**IMPORTANT LEGAL NOTICE:**
This indicator is for **educational and informational purposes only**. It is **NOT financial advice** and does not constitute a recommendation to buy or sell any financial instrument.
**Trading Risks:**
- Trading carries substantial risk of loss
- Past performance does not guarantee future results
- No indicator can predict market movements with certainty
- You can lose more than your initial investment (especially with leverage)
**User Responsibilities:**
- Conduct your own research and due diligence
- Understand the instruments you trade
- Never risk more than you can afford to lose
- Use proper position sizing and risk management
- Consider consulting a licensed financial advisor
**Indicator Limitations:**
- Signals are based on historical data only
- No guarantee of accuracy or profitability
- Parameters must be optimized for your specific use case
- Results vary significantly by market conditions
By using this indicator, you acknowledge and accept all trading risks. The author is not responsible for any financial losses incurred through use of this indicator.
---
## 📧 SUPPORT & FEEDBACK
**Found a bug?** Please report it in the comments with:
- Chart symbol and timeframe
- Parameter settings used
- Description of unexpected behavior
- Screenshot if possible
**Have suggestions?** Share your ideas for improvements!
**Enjoying the indicator?** Leave a like and follow for updates!

Market Profile Dominance Analyzer# Market Profile Dominance Analyzer
## 📊 OVERVIEW
**Market Profile Dominance Analyzer** is an advanced multi-factor indicator that combines Market Profile methodology with composite dominance scoring to identify buyer and seller strength across higher timeframes. Unlike traditional volume profile indicators that only show volume distribution, or simple buyer/seller indicators that only compare candle colors, this script integrates six distinct analytical components into a unified dominance measurement system.
This indicator helps traders understand **WHO controls the market** by analyzing price position relative to Market Profile key levels (POC, Value Area) combined with volume distribution, momentum, and trend characteristics.
## 🎯 WHAT MAKES THIS ORIGINAL
### **Hybrid Analytical Approach**
This indicator uniquely combines two separate methodologies that are typically analyzed independently:
1. **Market Profile Analysis** - Calculates Point of Control (POC) and Value Area (VA) using volume distribution across price channels on higher timeframes
2. **Multi-Factor Dominance Scoring** - Weights six independent factors to produce a composite dominance index
### **Six-Factor Composite Analysis**
The dominance score integrates:
- Price position relative to POC (equilibrium assessment)
- Price position relative to Value Area boundaries (acceptance/rejection zones)
- Volume imbalance within Value Area (institutional bias detection)
- Price momentum (directional strength)
- Volume trend comparison (participation analysis)
- Normalized Value Area position (precise location within fair value zone)
### **Adaptive Higher Timeframe Integration**
The script features an intelligent auto-selection system that automatically chooses appropriate higher timeframes based on the current chart period, ensuring optimal Market Profile structure regardless of the trading timeframe being analyzed.
## 💡 HOW IT WORKS
### **Market Profile Construction**
The indicator builds a Market Profile structure on a higher timeframe by:
1. **Session Identification** - Detects new higher timeframe sessions using `request.security()` to ensure accurate period boundaries
2. **Data Accumulation** - Stores high, low, and volume data for all bars within the current higher timeframe session
3. **Channel Distribution** - Divides the session's price range into configurable channels (default: 20 rows)
4. **Volume Mapping** - Distributes each bar's volume proportionally across all price channels it touched
### **Key Level Calculation**
**Point of Control (POC)**
- Identifies the price channel with the highest accumulated volume
- Represents the price level where the most trading activity occurred
- Serves as a magnetic level where price often returns
**Value Area (VA)**
- Starts at POC and expands both upward and downward
- Includes channels until reaching the specified percentage of total volume (default: 70%)
- Expansion algorithm compares adjacent volumes and prioritizes the direction with higher activity
- Defines the "fair value" zone where most market participants agreed to trade
### **Dominance Score Formula**
```
Dominance Score = (price_vs_poc × 10) +
(price_vs_va × 5) +
(volume_imbalance × 0.5) +
(price_momentum × 100) +
(volume_trend × 5) +
(va_position × 15)
```
**Component Breakdown:**
- **price_vs_poc**: +1 if above POC, -1 if below (shows which side of equilibrium)
- **price_vs_va**: +2 if above VAH, -2 if below VAL, 0 if inside VA
- **volume_imbalance**: Percentage difference between upper and lower VA volumes
- **price_momentum**: 5-period SMA of price change (directional acceleration)
- **volume_trend**: Compares 5-period vs 20-period volume averages
- **va_position**: Normalized position within Value Area (-1 to +1)
The composite score is then smoothed using EMA with configurable sensitivity to reduce noise while maintaining responsiveness.
### **Market State Determination**
- **BUYERS Dominant**: Smooth dominance > +10 (bullish control)
- **SELLERS Dominant**: Smooth dominance < -10 (bearish control)
- **NEUTRAL**: Between -10 and +10 (balanced market)
## 📈 HOW TO USE THIS INDICATOR
### **Trend Identification**
- **Green background** indicates buyers are in control - look for long opportunities
- **Red background** indicates sellers are in control - look for short opportunities
- **Gray background** indicates neutral market - consider range-bound strategies
### **Signal Interpretation**
**Buy Signals** (green triangle) appear when:
- Dominance crosses above -10 from oversold conditions
- Previous state was not already bullish
- Suggests shift from seller to buyer control
**Sell Signals** (red triangle) appear when:
- Dominance crosses below +10 from overbought conditions
- Previous state was not already bearish
- Suggests shift from buyer to seller control
### **Value Area Context**
Monitor the information table (top-right) to understand market structure:
- **Price vs POC**: Shows if trading above/below equilibrium
- **Volume Imbalance**: Positive values favor buyers, negative favors sellers
- **Market State**: Current dominant force (BUYERS/SELLERS/NEUTRAL)
### **Multi-Timeframe Strategy**
The auto-timeframe feature analyzes higher timeframe structure:
- On 1-minute charts → analyzes 2-hour structure
- On 5-minute charts → analyzes Daily structure
- On 15-minute charts → analyzes Weekly structure
- On Daily charts → analyzes Yearly structure
This higher timeframe context helps avoid counter-trend trades against the dominant force.
### **Confluence Trading**
Strongest signals occur when multiple factors align:
1. Price above VAH + positive volume imbalance + buyers dominant = Strong bullish setup
2. Price below VAL + negative volume imbalance + sellers dominant = Strong bearish setup
3. Price at POC + neutral state = Potential breakout/breakdown pivot
## ⚙️ INPUT PARAMETERS
- **Higher Time Frame**: Select specific HTF or use 'Auto' for intelligent selection
- **Value Area %**: Percentage of volume contained in VA (default: 70%)
- **Show Buy/Sell Signals**: Toggle signal triangles visibility
- **Show Dominance Histogram**: Toggle histogram display
- **Signal Sensitivity**: EMA period for dominance smoothing (1-20, default: 5)
- **Number of Channels**: Market Profile resolution (10-50, default: 20)
- **Color Settings**: Customize buyer, seller, and neutral colors
## 🎨 VISUAL ELEMENTS
- **Histogram**: Shows smoothed dominance score (green = buyers, red = sellers)
- **Zero Line**: Neutral equilibrium reference
- **Overbought/Oversold Lines**: ±50 levels marking extreme dominance
- **Background Color**: Highlights current market state
- **Information Table**: Displays key metrics (state, dominance, POC relationship, volume imbalance, timeframe, bars in session, total volume)
- **Signal Shapes**: Triangle markers for buy/sell signals
## 🔔 ALERTS
The indicator includes three alert conditions:
1. **Buyers Dominate** - Fires on buy signal crossovers
2. **Sellers Dominate** - Fires on sell signal crossovers
3. **Dominance Shift** - Fires when dominance crosses zero line
## 📊 BEST PRACTICES
### **Timeframe Selection**
- **Scalping (1-5min)**: Focus on 2H-4H dominance shifts
- **Day Trading (15-60min)**: Monitor Daily and Weekly structure
- **Swing Trading (4H-Daily)**: Track Weekly and Monthly dominance
### **Confirmation Strategies**
1. **Trend Following**: Enter in direction of dominance above/below ±20
2. **Reversal Trading**: Fade extreme readings beyond ±50 when diverging with price
3. **Breakout Trading**: Look for dominance expansion beyond ±30 with increasing volume
### **Risk Management**
- Avoid trading during NEUTRAL states (dominance between -10 and +10)
- Use POC levels as logical stop-loss placement
- Consider VAH/VAL as profit targets for mean reversion
## ⚠️ LIMITATIONS & WARNINGS
**Data Requirements**
- Requires sufficient historical data on current chart (minimum 100 bars recommended)
- Lower timeframes may show fewer bars per HTF session initially
- More accurate results after several complete HTF sessions have formed
**Not a Standalone System**
- This indicator analyzes market structure and participant control
- Should be combined with price action, support/resistance, and risk management
- Does not guarantee profitable trades - past dominance does not predict future results
**Repainting Characteristics**
- Higher timeframe levels (POC, VAH, VAL) update as new bars form within the session
- Dominance score recalculates with each new bar
- Historical signals remain fixed, but current session data is developing
**Volume Limitations**
- Uses exchange-provided volume data which varies by instrument type
- Forex and some CFDs use tick volume (not actual transaction volume)
- Most accurate on instruments with reliable volume data (stocks, futures, crypto)
## 🔍 TECHNICAL NOTES
**Performance Optimization**
- Uses `max_bars_back=5000` for extended historical analysis
- Efficient array management prevents memory issues
- Automatic cleanup of session data on new period
**Calculation Method**
- Market Profile uses actual volume distribution, not TPO (Time Price Opportunity)
- Value Area expansion follows traditional Market Profile auction theory
- All calculations occur on the chart's current symbol and timeframe
## 📚 EDUCATIONAL VALUE
This indicator helps traders understand:
- How institutional traders use Market Profile to identify fair value
- The relationship between price, volume, and market acceptance
- Multi-factor analysis techniques for assessing market conditions
- The importance of higher timeframe structure in trade planning
## 🎓 RECOMMENDED READING
To better understand the concepts behind this indicator:
- "Mind Over Markets" by James Dalton (Market Profile foundations)
- "Markets in Profile" by James Dalton (Value Area analysis)
- Volume Profile analysis in institutional trading
## 💬 USAGE TERMS
This indicator is provided as an educational and analytical tool. It does not constitute financial advice, investment recommendations, or trading signals. Users are responsible for their own trading decisions and should conduct their own research and due diligence.
Trading involves substantial risk of loss. Past performance does not guarantee future results. Always use proper risk management and never risk more than you can afford to lose.
