Key Recent Highs and LowsKey Recent Highs & Lows — Session‐Aware Market Structure
TL;DR
This tool plots the most important intraday price extremes for every U.S.‑equity trading segment—Early Premarket • Western Premarket • Regular Hours • Post‑Market Hours • Yesterday’s Range—and labels them so you can trade break‑outs, retests and mean‑reversion with instant context.
📐 Theory & Why These Levels Matter
Liquidity Pools
Visible session extremes attract resting orders (stop‑losses, take‑profits, opening prints). Price often accelerates into them and reacts at them.
Market Memory
The previous day’s high/low is a widely‑watched pivot for gap fills, overnight inventory corrections and multi‑day breakouts.
Mean‑Reversion Windows
Statistically, pre‑ and post‑market ranges are thin; an aggressive spike outside those bands often retraces when full liquidity returns.
Break‑Out Confirmation
A true breakout isn’t just a tick above RTH‑high—it usually closes or at least consolidates above the prior extreme. Seeing all bands lets you gauge whether a push is “real” or just probing thinner sessions.
Put simply, these levels help you decide:
Break‑out ➜ trade in the direction of expansion past a session extreme with follow‑through.
Fade/Mean‑Revert ➜ fade a spike that tags an extreme without commitment (e.g., hits Western‑Premkt‑High then stalls before RTH).
🔍 What the Script Draws
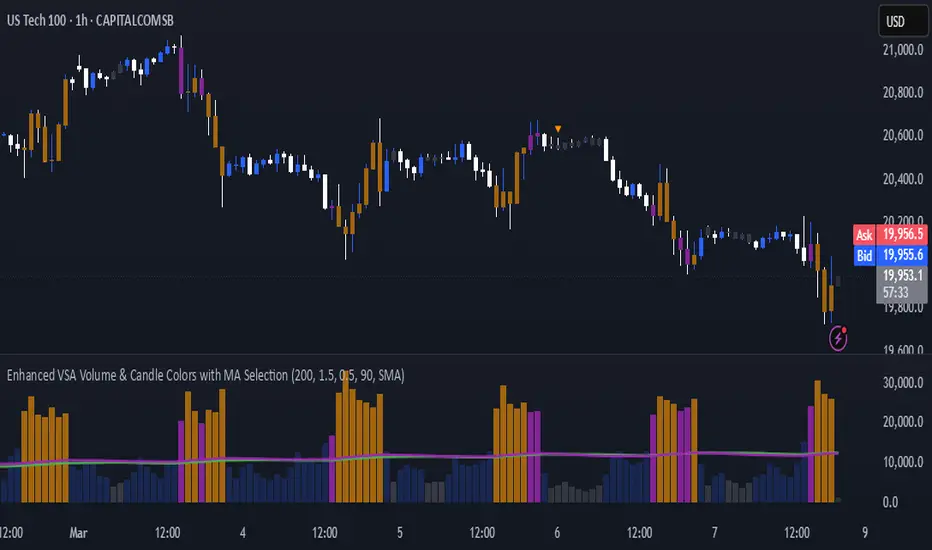
Session (UTC‑4 EST) Default Color / Style Typical Use‑Case
Early Premarket 4 – 7 AM Thick semi‑transparent orange line detect overnight retail spikes / fade plays
Western Premarket 7 – 9 : 30 AM Dashed orange‑red breakout watch as U.S. brokers open
Regular Session (RTH) 9 : 30 – 16 : 00 Bold teal dotted line core intraday structure; classic highs/lows
Post‑Market 16 – 23 : 59 Soft indigo band after‑hours news moves, earnings fades
Previous‑Day RTH Solid teal gap‑fill targets, trend continuation filters
(All colors, thicknesses and transparencies are editable in the settings.)
✨ Features
Real‑Time Updates
Levels refresh tick‑by‑tick inside their own session—no repainting later.
One‑Click Visibility Toggles
Show or hide any session extreme independently.
Clean Auto‑Labels
Optional right‑edge tags (“RTH High”, “Premkt Low”, etc.) keep your chart readable even when lines overlap.
Automatic Daily Reset
At midnight Eastern, buffers clear and yesterday’s extremes roll into the “Prev‑Day” pair.
Zero‑Noise Design
Transparencies and line styles are tuned so you can overlay on any symbol / timeframe without drowning candles.
📈 How to Trade with It
Intraday Breakout Strategy
Mark confluence (e.g., price pushes through Western Premkt High and Yesterday’s High).
Wait for a pullback that holds above the reclaimed band.
Enter with stop under that session line; target next band or measured‑move.
Fade / Mean‑Reversion
Pre‑market headline sends price 5 % above Early Premkt High.
Volume dries up before RTH open.
Short into exhaustion; cover near Western Premkt High or VWAP.
Gap‑Fill & Trend Days
Cash open gaps above Prev‑Day High.
If first 15‑min candle closes back inside yesterday’s range, bias shifts to downside fade.
If it holds above, treat gap as breakout and track RTH High extensions.
Pair it with volume‑profile, VWAP, or momentum oscillators for even higher‑confidence setups.
⚙️ Settings Cheat‑Sheet
Setting Effect
Show Regular / Premarket / Post‑market High/Low Master visibility per session
Show Previous Day High/Low Toggle yesterday’s anchor range
Show Session Labels Turn the right‑edge tags on/off
Style Panel Change each line’s color, width, transparency, dash/dot
🛠️ Best Practices
Works on any intraday timeframe (1‑min to 1‑hour).
Crypto or 24 h markets: adjust session times to match your exchange.
Combine with alerts (e.g., “price crossing RTH High”) for hands‑free monitoring.
Put KRHL on your chart and you’ll never wonder which high matters most again—because they’re all right there, clearly labeled and color‑coded. Trade breakouts or fades with confidence, armed with the exact market structure everyone else is watching.
Indicador Pine Script®