[blackcat] L3 Gann SlopeLevel 3
Background
William Gann (Wilian D. Gann) is one of the most famous investors in the twentieth century. His outstanding achievements in the stock and futures markets are unparalleled. The theory he created that perfectly combines time and price has been It is still talked about and highly praised by the investment community.
Function
The slope is the degree of the angle line relative to the time axis (X axis). Volatility is the ratio of unit amplitude to unit time. At the heart of Gann angles is the determination of volatility. Gann angle is the movement of price defined by time unit and price unit. Each angle is determined by the relationship between time and price. In the rising angle, the angle with the larger slope means that the stock price is rising stronger and falling. In a trend line, the larger the slope, the stronger the downtrend.
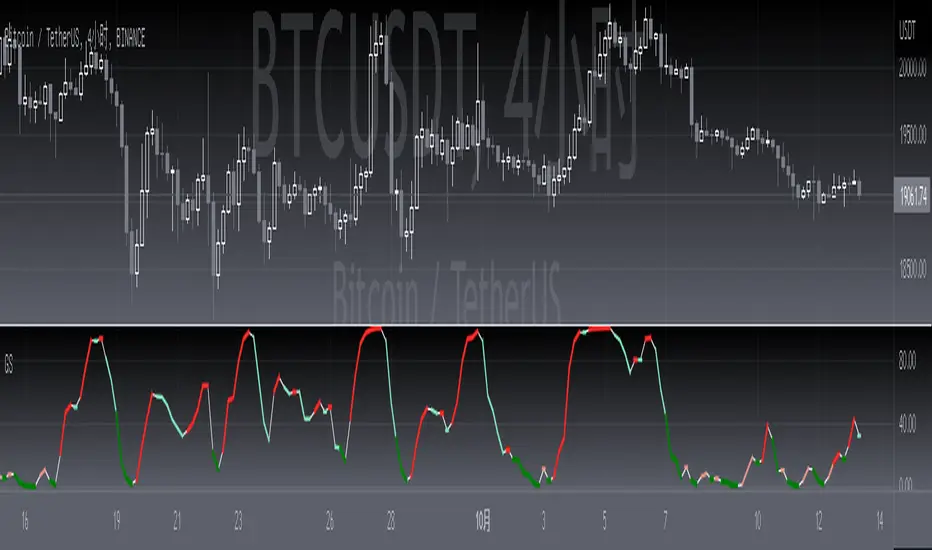
This technical indicator speaks of the Gann slope expressed as an oscillator. Its value varies from 0 to 100. The positive slope means rising, and the negative slope means falling. For rising and falling, the strength of rising and falling is distinguished by the thickness and color of the oscillating line:
1. The thin white line represents the basic oscillator curve and has no special meaning.
2. Light red indicates that an uptrend is established, and dark red indicates a very strong uptrend.
3. Light green indicates an established downtrend, dark green indicates a very strong downtrend.
Remarks
Feedbacks are appreciated.
Buscar en scripts para "gann"
Volatility Adjusted Grid [Gann]█ OVERVIEW
Gann Square of 9 is one of the many brilliant concepts from W.D.Gann himself where it revolves around the idea that price is moving in a certain geometrical pattern. Numbers on the Square of 9 spiral tables, especially those lie in every 45degree in the chart act as key vibration levels where prices have tendency to react to (more on the table below).
There are few square of 9 related scripts here in Tradingview and while there's nothing wrong with them, it doesn't address 1 particular issue that i have: The numbers can be too rigid even when scaled based on current price because the levels are fixed, which makes them not tradable on certain timeframes depending on where the price currently sitting.
Heres 5min and 1hour Bitcoin chart to illustrate what i mean: Grey line on the left is based on Volatility Adjusted levels, while red/blue on the right are the standard Gann levels.
You can see that on 1hour chart, it provides a good levels (both Volatility Adjusted and the standard one happened to share the same multiplier in this case),
1Hour Chart:
On 5 min chart tells a different story as the range between blue/red levels can be deemed as to big for a short term trade, while the grey line is adjusted to suit that particular timeframe (You can still adjust to make it bigger/smaller from the settings, more on this below)
5Min Chart:
█ Little bit on Gann Square of 9 table
This is the square of nine table, the numbers highlighted in Red are known as Cardinal Cross and considered to be a major Support/Resistance while those in Blue color are known as Ordinal Cross considered as minor (but still important) Support/Resistance levels
Similarly, this script use these numbers (and certain multipliers) to print out the levels, with Cardinal numbers represented by solid lines and Ordinal numbers by dotted lines.
█ How it Works and Limitations
The Volatility Adjusted grid will go through several iterations of different multipliers to find the Gann number range that is at least bigger than times ATR. Because it's using ATR to determine the range, occasionally you'll notice that the line become smaller as ATR contracting (and vice versa). To overcome this, you can change the size range multiplier from the settings to retrieve the previous range size.
Use the size guide at the bottom left to find the multiplier that suits your need:
1st Row -> Previous Range -- Change Range Size to number lower than this to get a smaller range
2nd Row -> Next Range -- Change Range Size to number higher than this to get a larger range
Example:
Before:
After:
As you'll soon realise, the key here is to find the range that fits the historical structure and suits your own strategy. Enjoy :)
█ Disclaimer
Past performance is not an indicator of future results.
My opinions and research are my own and do not constitute financial advice in any way whatsoever.
Nothing published by me constitutes an investment recommendation, nor should any data or Content published by me be relied upon for any investment/trading activities.
I strongly recommends that you perform your own independent research and/or speak with a qualified investment professional before making any financial decisions.
Any ideas to further improve this indicator are welcome :)

Price and Longitude Angles Planetary Price & Longitude Angles Indicator
This indicator plots planetary price and longitude angles starting from a user-selected date and time, offering a distinctive lens to explore the relationship between price and planetary timing. It supports both heliocentric and geocentric, enabling flexible and in-depth planetary analysis. The angles can be plotted across any time frame for maximum versatility.
How to Use
Once the indicator is loaded, you’ll be prompted to select a starting date and time for your analysis. From there, customize it as follows:
Select Planetary Options:
To plot the price and longitude for a single planet, choose the same planet in both dropdown menus.
To plot the average of two planets, select a different planet in each dropdown.
Set the Price Per Degree of Longitude: Adjust this value to define the scaling of the planetary angles relative to price.
Customize Fan Settings:
Toggle the mirroring of the fan on or off based on your needs.
Show or hide specific angle divisions to tailor the display to your preferences.
Display or conceal the information label that indicates the price per longitude and the number of degrees traveled.
This indicator is inspired by the methodologies of W.D. Gann and Patrick Mikula, expanding on concepts from Gann Scientific Method Unveiled, Volume 2. It was built using Astrolib by @BarefootJoey
I crafted this tool through dedication to support my own study of these ideas. I’m sharing it open-source not only to deepen my understanding and honor the work of Gann and Mikula, but also to invite collaboration. There’s always room for improvement—whether in functionality, accuracy, or design—and I hope others will join me in refining it. This is for those like me: eager to explore these concepts but lacking tools to experiment with. Let’s build on it together.

[blackcat] L3 Gann B-XtrenderLevel 3
Background
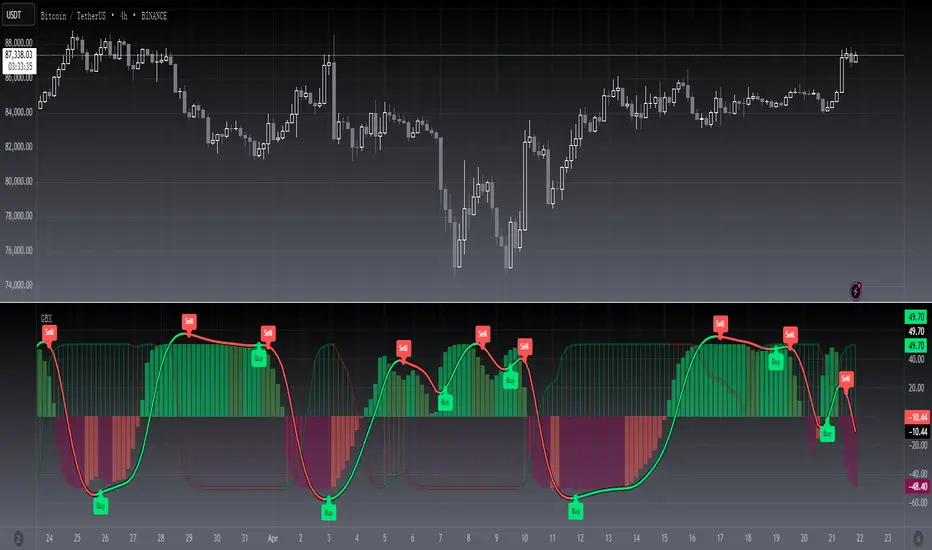
The Gann Slope indicator has been welcomed by the community since its release, and many people are trying to integrate it into their trading systems. One of these is the need to integrate Gann Slope into QuantTherapy's B-Xtrender @Puppytherapy.
Function
You can find QuantTherapy's script above , he recreated a trend following indicator published in IFTA Journal by Bharat Jhunjhunwala. It is mainly to be traded on big timeframes.
As requested, i replaced the oscillator part with my Gann slope oscillator. However, I found the setting for input parameters for B-Xtrender is rather complex, you need to take great care to tuning them for specific time frame and trading pairs. Pls don't be lazy to apply this indicator to your chart and expect good results. You have to try and find proper values of them to obtain acceptable results.
Remarks
Feedbacks are appreciated.
Combo Backtest 123 Reversal & Gann Swing Oscillator This is combo strategies for get a cumulative signal.
First strategy
This System was created from the Book "How I Tripled My Money In The
Futures Market" by Ulf Jensen, Page 183. This is reverse type of strategies.
The strategy buys at market, if close price is higher than the previous close
during 2 days and the meaning of 9-days Stochastic Slow Oscillator is lower than 50.
The strategy sells at market, if close price is lower than the previous close price
during 2 days and the meaning of 9-days Stochastic Fast Oscillator is higher than 50.
Second strategy
The Gann Swing Oscillator has been adapted from Robert Krausz's book,
"A W.D. Gann Treasure Discovered". The Gann Swing Oscillator helps
define market swings.
WARNING:
- For purpose educate only
- This script to change bars colors.

Combo Strategy 123 Reversal & Gann Swing Oscillator This is combo strategies for get a cumulative signal.
First strategy
This System was created from the Book "How I Tripled My Money In The
Futures Market" by Ulf Jensen, Page 183. This is reverse type of strategies.
The strategy buys at market, if close price is higher than the previous close
during 2 days and the meaning of 9-days Stochastic Slow Oscillator is lower than 50.
The strategy sells at market, if close price is lower than the previous close price
during 2 days and the meaning of 9-days Stochastic Fast Oscillator is higher than 50.
Second strategy
The Gann Swing Oscillator has been adapted from Robert Krausz's book,
"A W.D. Gann Treasure Discovered". The Gann Swing Oscillator helps
define market swings.
WARNING:
- For purpose educate only
- This script to change bars colors.

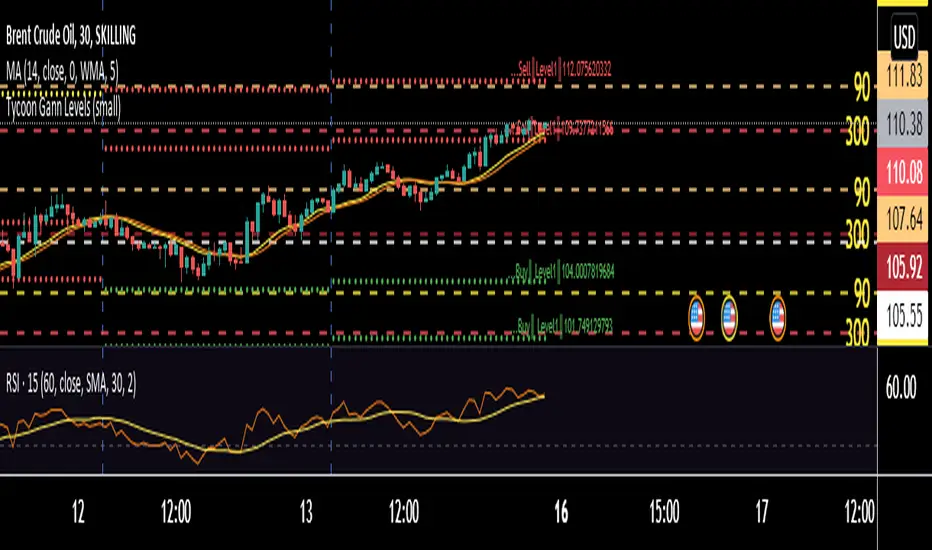
Tycoon Gann Currently this script will work for the stocks and futures price trading in between 1000 - 100000. In our future update we will add another feature that will give you access to all the price digit stocks futures and currencies too .
This is purely based on a secret method of Tycoon Infotek as a research of GANN levels we found in our experience these WD GANN Trend angle based calculations giving us some important hints to watch . Degree offset from previous close price add 90 degree to calculate resistance and substract 90 to get resistance levels . green color dots denotes buying pressure zone and red color denotes selling pressure zones . yellow line indicates neutral sign
These levels not only shows us the Support and resistance . It clearly intimate us the strength of selling and buying pressure naturally occurred once the price reaches the zones.
BB-Pivots-GANN-Levels-stockInshotHello everyone,
With help of open source WD gann codes, i combined this study with Bollinger band with entry & exit conditions.
For stock Selection you way chose fixed stock list .
These levels has been derived from daily WD GANN Astro Levels.
=== Rules ===
Long Entry Condition : Price must be above resistance line with Bollinger band blast will be the best entry . You may take the target with the help of this study.
Stop loss can be same candle low
Short Entry Condition : Price must be below support line with Bollinger band blast will be the best entry . You may take the target with the help of this study.
Stop loss can be same candle High
Please calculate the Risk Reward with the Future Target Price & Stop loss levels.
No Trading Zone Rules -
If price is in middle of support & Resistance .one way avoid such trades as it has been observed ,That most of the time stock goes sideways.
===Rules End ===
study has been kept open source for the understanding the concept.
Do your own Research with this study for better understanding with your trading style

SuTrading Gann Levels By NareshThis script is used to calculate the Gann square off 9 levels.
To Use this indicator Follow the below steps
1. open chart and add this indicator
2. at 9:35AM(IST) check the VWAP value of a stock and enter into scripts input then submit
3. scripts draws the recommended buy, sell and target levels on the chart by using Gann square off 9 algorithm.

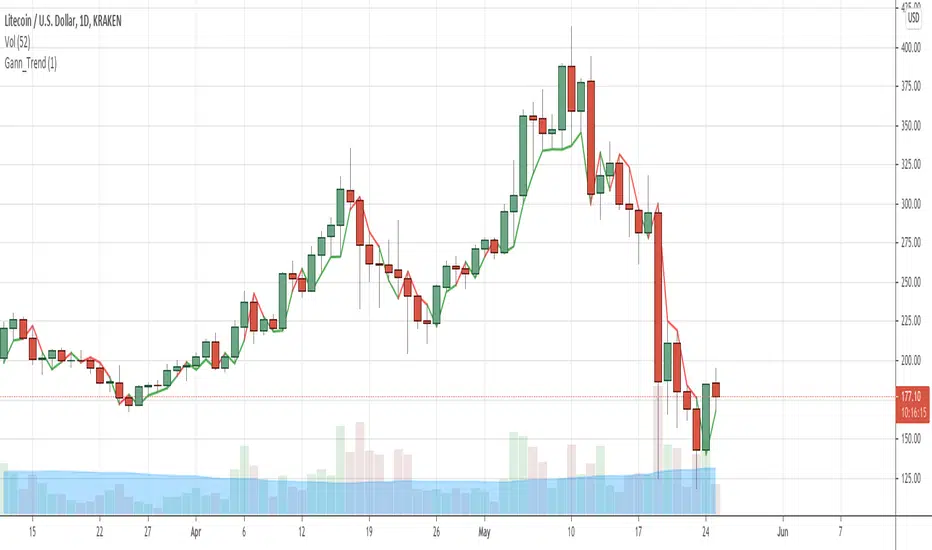
Modified Gann HiLo ActivatorIntroduction
The gann hilo activator is a trend indicator developed by Robert Krausz published into W. D. Gann Treasure Discovered: Simple Trading Plans for Stocks & Commodities . This indicator crate a trailing stop aiming to show the direction of the trend.
This indicator is fairly easy to compute and dont require lot of skills to understand. First we calculate the simple moving average of both price high and price low, when the close price is higher than the moving average of the price high the indicator return the moving average of the price low, else the indicator return the moving average of the price high if the close price is lower than the moving average of the price low.
My indicator add a different calculation method in order to avoid whipsaw trades as well as adding significance to the moving average length. A Median method has been added to provide more robustness.
The Indicator
The indicator is a simple trailing stop aiming to show the direction of the trend. The indicator use a different source instead of the price high/low for its calculation. The first method is the "SMA" method which like the classic hilo indicator use a simple moving average for the calculation of the indicator.
Sma Method with length = 25
The "Median" use a moving median instead of a simple moving average, this provide more robustness.
Median Method with length = 25
The shape is less curved and the indicator can sometimes avoid whipsaw with high's length periods.
Mult Parameter
The mult parameter is a parameter set to be lower or equal to 1 and greater or equal to 0. High values allow the indicator to be far from the price thus avoiding whipsaw trades, lower ones lower the distance from the price. A mult parameter of 0.1 approximate the original hilo indicator.
In blue the indicator with mult = 0.1 and in radical red the original hilo activator.
Conclusion
The modifications allow more control over the indicator as well as adding more robustness while the original one is destined to fail when market price is more complex.
Thanks for reading :)
For any questions/suggestions feel free to pm me

BTC Gann Harmonics Weighted + Phase + EMA OptimizedBTC Gann Harmonics Weighted + Phase + EMA Optimized

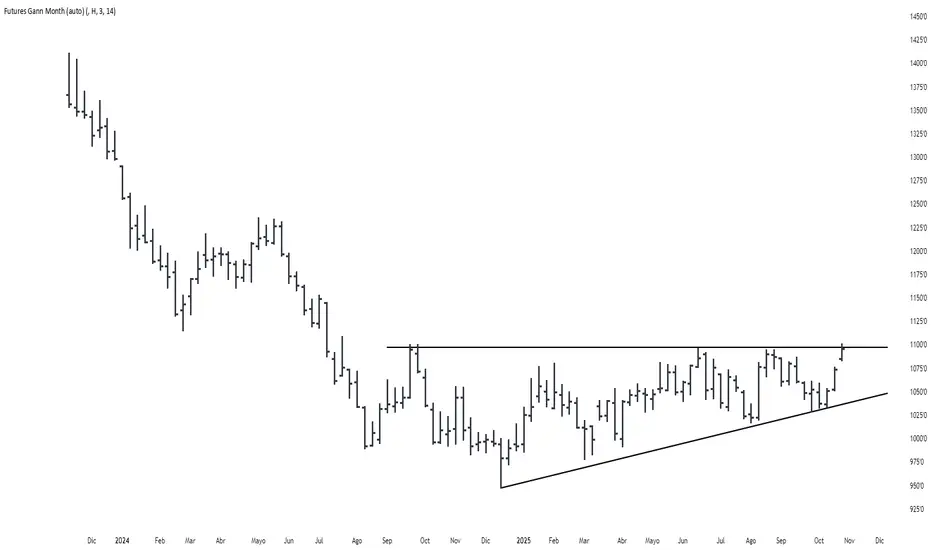
Futures Gann MonthBuilds a a continuous chart of the same month for a futures contract (e.g. ZSH2026).
This means such a chart consists of March '22, March '23, March '24, March '25, March '26...
The script goes back 20 years at most (depending on the current ticker selected in TradingView).
Path of the Planets🪐 Path of the Planets
Path of the Planets is an open-source Pine Script™ v6 indicator. It is inspired by W.D. Gann’s Path of Planets chart, specifically the Chart 5-9 artistic replica by Patrick Mikula "shown below". The script visualizes planetary positions so you can explore possible correlations with price. It overlays geocentric and heliocentric longitudes and declinations using the AstroLib library and includes an optional positions table that shows, at a glance, each body’s geocentric longitude, heliocentric longitude, and declination. This is an educational tool only and not trading advice.
Key Features
Start point: Choose a date and time to begin plotting so studies can align with market events.
Adjustments: Mirror longitudes and shift by 360° multiples to re-frame cycles.
Planets: Toggle geocentric and heliocentric longitudes and declinations for Sun, Mercury, Venus, Earth, Mars, Jupiter, Saturn, Uranus, Neptune, and Pluto. Moon declination is available.
Positions table: Optional color-coded table (bottom-right) with three columns labeled Geo, Helio, and Dec. Values show degrees with the zodiac sign for the longitudes and degrees for declinations.
Visualization: Solid lines for geocentric longitudes, circles for heliocentric longitudes, and columns for declinations. Includes a zero-declination reference line.
How It Works
Converts bar timestamps to Julian days via AstroLib.
Fetches positions with AstroLib types: geocentric (0), heliocentric (1), and declination (3).
Normalizes longitudes to the −180° to +180° range, applies optional mirroring and 360° shifts, and converts longitudes to zodiac sign labels for the table.
Plots and the table update only on and after the selected start time.
Usage Tips
Apply on daily or higher timeframes when studying broader cycles. For degrees, use the left scale.
Limitations at the moment: default latitude, longitude, and timezone are set to 0; aspects and retrogrades are not included; the focus is on raw paths.
License and Credits
Dependency: @BarefootJoey Astrolib
Contributions and observations are welcome.

Concentric Geometry – Invariant MetricsConcentric Geometry – Invariant Metrics
This indicator demonstrates the invariant concept of a concentric circle around a selected price range. By anchoring two points (A & B), it calculates a set of ratios and slopes that remain consistent under concentric scaling of price and time. These invariants include the raw slope (ΔP/N), concentric slope, π-adjusted ratios, and √2 offsets — all of which can be used to explore deeper geometric relationships in the market.
What has been demonstrated here is not an “out-of-the-box” trading system. Instead, the outputs provide the raw invariant metrics from which the trader must derive their own ratios and extensions. For example, price-to-bar ratio inputs are not fixed — they need to be derived from the invariants themselves, and experimenting with them is the key to uncovering harmonic alignments and scaling behaviors.
Key features include:
• Range & Bars Analysis – Price range (ΔP) and bar count (N) between anchors.
• Core Invariants – Midpoint, radius (price and bar units), upper/lower bounds.
• Linear Slope Metrics – ΔP/N and √2 concentric slope.
• π-Adjusted Price/Bar – Harmonic arc-length ratio.
• Circumference & Offsets – Circle circumference, √2 and 1/√2 offsets in price and bar units.
This tool is best suited for traders studying market geometry, W.D. Gann principles, harmonic ratios, or the geometric methods of Michael Jenkins. It does not generate buy/sell signals — instead, it equips the trader with building blocks for geometric exploration.
Key point: The trader must experiment with the ratios derived from these metrics. Playing with different price-to-bar relationships unlocks the true potential of concentric market geometry, whether applied to dynamic anchored VWAPs, concentric overlays, or Vesica Piscis structures.
Use it to:
• Compare slopes across swings
• Derive new ratios from invariant metrics
• Anchor dynamic anchored VWAPs to concentric nodes
• Explore concentric or Vesica Piscis overlays
• Support advanced geometric trading strategies

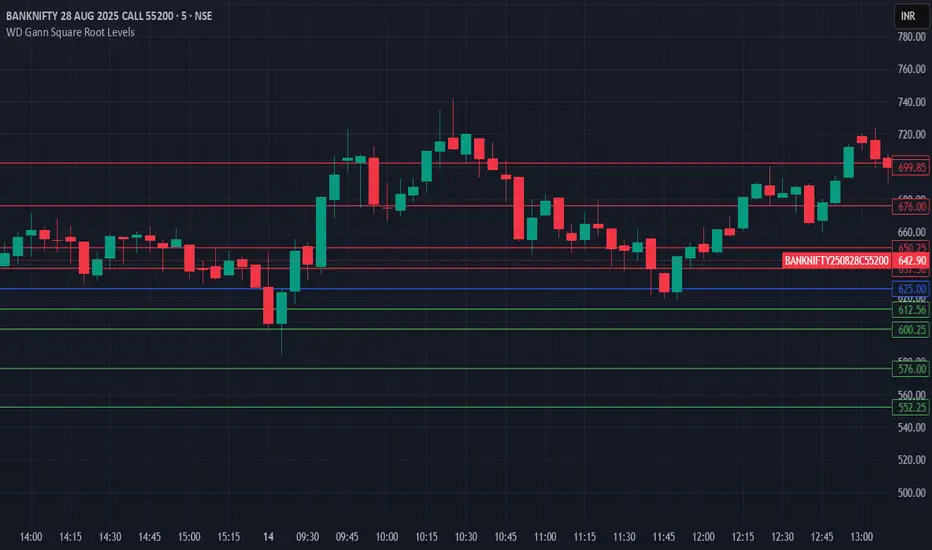
HTH - WD Gann Square Root LevelsHTH - WD Gann Square Root Levels will plot lines for support and resistance
Fast ROI checker 50% Gann RetracementThis script is based on the Gann's 50% Retracement rule.
First, the ATH (All Time High) and ATL (All Time Low) are calculated; then, the 50% retracement level is found.
With this 50% level, we'll calculate the maximum price entry to keep a ROI which is set in the parameters.
For exemple, I only want to buy assets which can make a x16 before the 50% retracement , the script will calculate the maximum entry to respect this ROI .
If the Max entry price is above the ATL , the line will be green; if not, the line will be red.
To faster the search in the watchlist, when the price is between the Max Entry line and the ATL line, the background is painted in green.
It's not an investment strategy, you have to find your proper indicators to make purchases.
Enjoy !

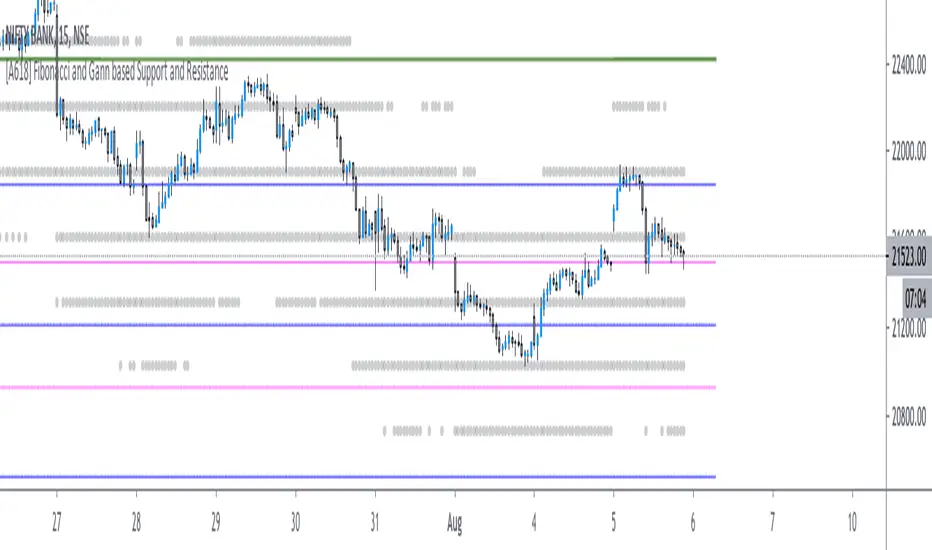
[A618] Fibonacci and Gann based Support and ResistanceThe scripts plots,
Gann and Fibonacci Levels onto the charts taking into account the price action of past 1 year,
The plots are plotted dynamically
Enjoy !
RVC-Weekly-Pivots-GANN-LevelsPurpose:
Weekly - Fibonacci pivot levels and Gann levels calculation and marking on Chart automatically.
Mainly expected to use for trading on NIFTY and BankNifty
Kindly share your comments and suggestions to improve

Multi Signal RSI MACD Gann buy ans sell signal zwith RSI, zerollagMacd and highLow Gann and & indicator Macd head band Bollinger & SMA

CM_Gann_Swing_HighLowCustom Indicator - Gann Swing High Low
Uses New Plot Types
Inputs Tab Options:
Use Up/Down Arrows - Or Circles!
Turn Up/Down Arrows at Top and Bottom of Screen On/Off
New Top/Bottom of Screen Plot Types
New Up/Down Arrow Plot Types
Full Credit Goes to Glaz for Creating Code.
Created By Request for @dvk1970

KesslerBandMade this to save indicator space. 3 moving averages, 1 ema moving average. Enjoy!
S/O to Kessler Syndrome

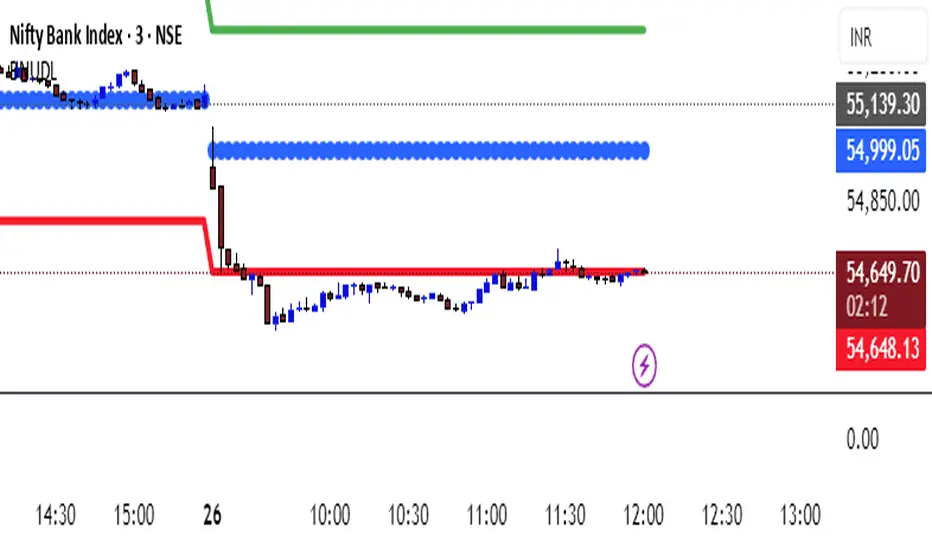
KATIK BankNifty Upside/Downside LevelsThe KATIK BankNifty Upside/Downside Levels (BNUDL) indicator plots key daily reference levels for BankNifty based on its opening price. Using a predefined daily move percentage, it calculates potential upside and downside levels from the open. The script displays:
Up Level (Green): Potential bullish threshold above the open
Down Level (Red): Potential bearish threshold below the open
Open Price (Blue Circles): Daily BankNifty opening level
This tool helps traders quickly identify intraday directional bias and potential support/resistance zones around the opening price.