Badshai Trading ToolsBadshai Trading Tools is the tool where Buy and sell signals generates automatically according to the candles behavior.
It uses WD Gann Levels to calculate entry point with the help of VWAP .
Pivot points determines the recent support and resistance levels.
Trading rule for this indicator
This indicator is designed for Indian equity stocks
Best performance is expected on 10 minutes chart basic user can use 5 minutes chart for stock value less than 500 rupees, else 15 minutes chart
Plotted line shows the market sentiment, green for buy, red for sell and black for neutral market.
Order thumb rule
For buy signals there is a up triangle in green color
For sell signal there is a down triangle in red color
1. avoid any trade signal before 9:35 AM Indian time
2. signal and related stop loss candle must be formed in the same day
3. if order placed in 5 minutes chart then don't go for a target of 15 minutes chart
4. if order placed in 15 minutes time frame and target is too far then check the target in 5 minutes time frame
5. if signal candle touches the target then avoid the signal.
6. Money management is most important for this indicator.
7. Take trade only if it satisfy risk reward ratio.
8. It has long target but need patience.
Signal
using vwap calculates gann square of 9 levels and if any smart money activity on that level then checks the confirmation of the trend by higherhigh or lowerlow formation
Buy Entry : entry price should be on the high of the candle before signal for buy and sl on bottom of flagged candle just before signal
SellEntry : entry price should be on the low of the candle before signal for sell and sl on top of flagged candle just before signal
Please add some extra value to the Stop Loss for safe trading
Warning : Don't place any order without stop loss, This tool is made for educational and learning purpose only, take any trade at your own risk.
Buscar en scripts para "gann"

Intraday Smart Money ExpertIntraday Masters Analogy is the tool where Buy and sell signals generates automatically according to the candles behavior.
It uses WD Gann Levels to calculate entry point with the help of VWAP .
Pivot points determines the recent support and resistance levels.
Trading rule for this indicator
This indicator is designed for Indian equity stocks
Best performance is expected on 5 minutes chart or 15 minutes chart
Order thumb rule
1. avoid any trade signal before 9:35 AM Indian time
2. signal and and related stop loss candle must be formed in the same day
3. if order placed in 5 minutes chart then don't go for a target of 15 minutes chart
4. if order placed in 15 minutes time frame and target is too far then check the target in 5 minutes time frame
5. if signal candle touches the target then avoid the signal.
6. Money management is most important for this indicator.
7. Take trade only if it satisfy risk reward ratio.
8. It has long target but need patience.
Signal
using vwap calculates gann square of 9 levels and if any smart money activity on that level then checks the confirmation of the trend by higherhigh or lowerlow formation
Buy Entry : entry price should be on the high of the candle before signal for buy and sl on bottom of flagged candle just before signal
SellEntry : entry price should be on the low of the candle before signal for sell and sl on top of flagged candle just before signal
Warning : Don't place any order without stop loss

Intraday Masters AnalogyIntraday Masters Analogy is the tool where Buy and sell signals generates automatically according to the candles behavior.
It uses WD Gann Levels to calculate entry point with the help of VWAP.
Zigzag trend lines shows the momentum behavior for last few days and shows whether it following current trend or building new trend.
Pivot points determines the recent support and resistance levels.
Trading rule for this indicator
This indicator is designed for Indian equity stocks
Best performance is expected on 5 minutes chart or 15 minutes chart
Order thumb rule
1. avoid any trade signal before 9:35 AM Indian time
2. signal and and related stop loss candle must be formed in the same day
3. if order placed in 5 minutes chart then don't go for a target of 15 minutes chart
4. if order placed in 15 minutes time frame and target is too far then check the target in 5 minutes time frame
5. if signal candle touches the target then avoid the signal.
6. Money management is most important for this indicator.
7. Take trade only if it satisfy risk reward ratio
Signal
using vwap calculates gann square of 9 levels and if any smart money activity on that level then checks the confirmation of the trend by higherhigh or lowerlow formation
Buy Entry : entry price should be on the high of the candle before signal for buy and sl on bottom of flagged candle just before signal
SellEntry : entry price should be on the lowof the candle before signal for sell and sl on top of flagged candle just before signal
Warning : Don't place any order without stop loss

RVC-Daily_PivotsPurpose: Fibonacci Pivot levels + Gann levels calculation and display on Chart automatically.
Mainly expected to use these for intraday trading on NIFTY and BankNifty
Display R1/R2/R3 - Pivot - S1/S2/S3 levels
Also display GANN Levels of
720- / 540- / 360- / 270-/ 180- / 90- / 45-
45+ / 90+ / 180+ / 270+ / 360+ /540+ /720 +
Same pivot levels are useful for any equity - support and resistance levels.
Levels indicated are only for reference and not meant for trading purpose.

Abureed(Mikula_IND)The indicator used to calculate the distance traveled around the face of Gann square of nine that a market has moved above or below a moving average.
The indicator has two inputs
The input named Price Factor is set to move the decimal point of low priced Stocks
The input named SMA is the Moving Average Size
Note that this idea for Mr Patrick Mikula introduced on his book "The Definitive Guide to Forecasting using W.D Gann's Square of Nine"

ING as of 5th of January on 5min tfMy ScriptING daytrading with structured products
via boosters from BNP markets
25cents of daily profit
av. 70cents investment
stop 5cents
Yesterday the time cycle has been triggerd for ING on W.D. Gann and TradingEcology had calculated a price of 14.06 around 11 o'clock.
This scenario was confirmed on 3min tf, though 5 min tf was close to a short. Based on W.D. Gann or pending short has been triggered at 14.06, although closed on 13.98 based on price action from yesterday.
A welcome scenario was point D, as fibonacci harmonics alligned in point D.....shorts on time made a good profit!
Best to your trading!
Feel free to like our page: www.facebook.com

GeoWave v1.0See what other traders can't. GeoWave is the most sophisticated geometric indicator ever built for TradingView - a real-time pattern recognition engine that transforms raw price action into precise harmonic measurements and time cycle projections.
Advanced XABCD Pattern DNA
Automatically detects and measures the last 4 swings, calculating 6 critical harmonic ratios that reveal the hidden mathematical relationships governing market movements:
BcD Ratio (CD/BC) - Classic retracement relationships that predict reversal zones
AB/CD Ratio (CD/AB) - Primary harmonic structure defining complete market cycles
X1 Ratio (AD/BC) - Diagonal extensions that extend beyond traditional boundaries
X2 Ratio (AD/XC) - Complex cross relationships uncovering multi-dimensional patterns
XcD Ratio (CD/XC) - Extended retracements that capture prolonged market phases
XaD Ratio (AD/XA) - Time-space intersections where temporal and spatial forces converge
Precision Targeting Engine
Projects multiple target zones simultaneously with unprecedented accuracy:
Retracement Targets: BcD-based levels (0.382, 0.618, 1.618, 2.618) that pinpoint exact reversal points
Extension Targets: AbCd projections beyond pattern completion that anticipate future movements
Cross Targets: AdBc & AdXc harmonic intersections that identify high-probability convergence zones
Time Cycle Mastery
Don't just predict price. Predict time. GeoWave projects historical swing durations forward, identifying when turning points are statistically likely to occur. Project time cycles at 50%, 100%, and 200% (and more) of historical durations to anticipate market rhythm.
Multi-Level Geometric Analysis
Scans across 18 swing levels simultaneously, revealing nested harmonic structures that single-level indicators completely miss. Each level uses advanced adaptive filtering for precision detection of market's fractal nature.
Square the Range Integration
Implements W.D. Gann's "Square the Range" theory, creating geometric boxes where price and time vectors intersect at critical confluence zones that define major market turning points.
Intelligent Signal Scoring
Proprietary scoring algorithm weighs Fibonacci proximity, ratio type importance, and multi-level confluence. Color-coded signals highlight high-probability setups with detailed breakdown tooltips revealing the mathematical strength of each opportunity.
Adaptive Noise Cancellation
Proprietary filtering technology eliminates insignificant market noise, focusing only on structurally meaningful swing points that actually drive price direction and determine market fate.
Stop guessing. Start measuring. GeoWave doesn't draw pretty lines - it quantifies market geometry with mathematical precision, giving you the edge that institutional traders pay millions to develop.
Join the elite traders who've discovered the hidden geometric order behind every market move.

MM-Auto SQ9 V1.0MM-Auto SQ9 V1.0 — Automatic Square-of-9 levels from a selected pivot (Bottom/Top). Choose base shape or Custom Angle, optional half-angles, cycles, and full color/style control.
Disclaimer: Educational purposes only — not financial advice.
What it is
A visual Gann Square-of-9 level engine. It projects horizontal SQ9 price levels from a single pivot using root/square transforms, with selectable geometric bases (90°/60°/72°/120°/45°) or a **Custom Angle**, optional **Sub-Angles (half-angles)**, multi-cycle expansion, full styling control, and a **draggable 0-line** pivot.
**Key features**
* **Draggable 0-line:** Drag the pivot line on the chart and drop it on any swing high/low — no need to type the reference price. Levels recalc instantly.
* **Bottom/Top modes** for projection direction.
* **Shapes or Custom Angle** (Square/Octagon/Hexagon/Triangle/Pentagon or your own).
* **Sub-Angles (½)** with separate style/color.
* **Cycles** to extend the grid.
* **Clean UI**: labels (size/distance), line thickness/style/colors, pivot line style.
**Inputs (quick guide)**
Pivot Price • Pivot Type (Bottom/Top) • Space Multiplier • Geometric Shape / Custom Angle Value • Number of Cycles • Show Sub-Angles & Line Style • Colors & Line Thickness • Labels (on/size/distance).
**Workflow**
1. Drag the **0-line** to your pivot (any swing high/low) or set **Pivot Price** and **Bottom/Top**.
2. Pick shape or **Custom Angle**; increase **Cycles** if needed.
3. Tune **Space Multiplier** to align levels with historical reactions.
4. (Optional) Enable **Sub-Angles** for finer structure.
5. Observe **bounce / break / retest** around levels and combine with your system.
**Pro tips**
* Use a **structural swing** as pivot.
* Reduce clutter by lowering cycles or disabling sub-angles.
* Pair with **market structure / volume / ATR / fractals** for decision support.
* Adjust label size/distance to keep charts clean.
**Troubleshooting (dragging)**
If the 0-line doesn’t move, ensure drawings are **unlocked** and “Move drawings” is enabled in chart settings.
**Disclaimer & Rights**
Educational purposes only — **not financial advice**.
Script programmed by **Mohammad Murad (MM)**.
© 2025 **Mohammad Murad**. **All rights reserved.

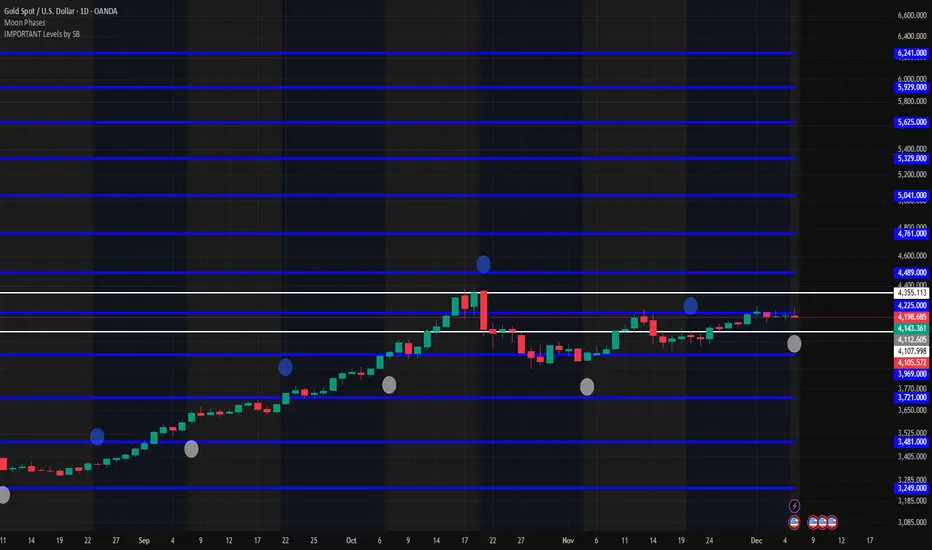
IMPORTANT Levels by SBImportant levels by SB based on gann levels.One can plot these levels once on the chart and can work on these levels .When ever market market come at any of these levels .User can wait for the price action and accordingly user can get inside the trade
Daily Gann Box — Prev Day H/L (1, 0.5, 0) — Gift Idea for trading within the previous days range as described by The Rumers on Youtube. Since it wasn't uploaded and I wanted it. I made basic script and am sharing for free with them.
I will delete once they upload theirs. I don't want any credit or follows from this.

Great Pyramid Master Architecture [GPM] PyraTimeThe Wisdom of the Ancients
The Great Pyramid of Giza is not just a tomb; it is a monument to mathematical perfection, aligned with celestial mechanics and constructed using precise harmonic ratios. The Great Pyramid Master (GPM) Architecture applies these same ancient geometric laws to modern financial markets.
While standard analysis treats time as linear (a straight line), GPM treats time as geometric (a spiral). By anchoring this tool to a significant "Origin Pivot," the script projects a sequence of vertical time markers derived from the sacred number 30 and its harmonic multiples (e.g., 72, 144, 360).
Why It Works: The Physics of Time
Markets do not move randomly; they vibrate. Just as a musical string vibrates at specific frequencies, market trends exhaust their energy at specific time intervals.
* Price tells you where the market is.
* GPM tells you when the market will turn.
This indicator visualizes the invisible "Time Lattice" that underpins price action. When price arrives at a GPM Vertical Line, it has hit a geometric wall where the previous energy vector is mathematically likely to terminate.
The Full PyraTime Ecosystem
The GPM Architecture is the "Map" of the system. To trade it successfully, you must pair it with our two dedicated companion indicators found in our library:
1. The Map (This Indicator): Identifies the Time Window. Wait for price to touch a vertical line.
2. The Trigger (Search for "PyraFish"): Use the Harmonic Sniper Trigger to confirm momentum is flipping exactly when the GPM line hits or click below
3. The Exit (Search for "PyraTD"): Use the Sequential Exhaustion to identify price exhaustion (9/13 count) and signal when to close the trade or click below
How to Use (Step-by-Step)
1. Identify the Origin: Find a major "Scam Wick" or structural pivot (High/Low) on your chart.
2. Set the Anchor: Open Settings and input the exact Date and Time of that pivot. The geometric web will instantly project into the future.
3. Monitor the Clusters: Watch for areas where multiple cycle lines (Standard and Esoteric) converge. These "Super Pivots" often mark significant trend reversals.
Features
Esoteric & Standard Cycles: Tracks both conventional market hours and the hidden harmonic sequence simultaneously.
Smart Dashboard: Displays a countdown to the next major energy shift.
Clean Visuals: All lines are rendered at 50% opacity to keep your chart professional and readable.
Disclaimer: This tool is for technical analysis and educational purposes only. It projects potential geometric time pivots, not guaranteed price movements. Always manage your risk.

Symmetrical Geometric MandalaSymmetrical Geometric Mandala
Overview
The Symmetrical Geometric Mandala is an advanced geometric trading tool that applies phi (φ) harmonic relationships to price-time analysis. This indicator automatically detects swing ranges and constructs a scale-invariant geometric framework based on the square root of phi (√φ), revealing natural support/resistance zones and harmonic price-time balance points.
Core Concept
Traditional technical analysis often treats price and time as separate dimensions. This indicator harmonizes them using the mathematical constant √φ (approximately 1.272), creating a geometric "squaring" of price and time that remains proportionally consistent across different chart scales.
The Mathematics
When you select a price range (from swing low to swing high or vice versa), the indicator calculates:
PBR (Price-to-Bar Ratio) = Range / Number of Bars
Harmonic PBR = PBR × √φ (1.272019649514069)
Phi Extension = Range × φ (1.618033988749895)
The Harmonic PBR is the critical value - this is the chart scaling factor that creates perfect geometric harmony between price and time for your selected range.
Visual Components
1. Horizontal Boundary Lines
Two horizontal lines extend from the selected range at a distance of Range × φ (golden ratio extension):
Upper line: Extended above the swing high (for uplegs) or swing low (for downlegs)
Lower line: Extended below the swing low (for uplegs) or swing high (for downlegs)
These lines mark the natural harmonic boundaries of the price movement.
2. Rectangle Diagonal Lines
Two diagonal lines that create a "rectangle" effect, connecting:
Overlap points on horizontal boundaries to swing extremes
These lines go in the opposite direction of the price leg (creating the symmetrical mandala pattern)
When extended, they reveal future geometric support/resistance zones
3. Phi Harmonic Circles (Optional)
Two precisely calculated circles (drawn as smooth polylines):
Circle A: Centered at the first swing extreme (Nodal A)
Circle B: Centered at the second swing extreme (Nodal B)
Radius = Range × φ, causing them to perfectly touch the horizontal boundary lines
These circles visualize the geometric harmony and create a mandala-like pattern that reveals natural price zones.
How to Use
Step 1: Select Your Range
Set the Start Date at your swing low or swing high
Set the End Date at the opposite extreme
The indicator automatically detects whether it's an upleg or downleg
Step 2: Read the Harmonic PBR
Check the highlighted yellow row in the table: "PBR × √φ"
This is your chart scaling value
Step 3: Apply Chart Scaling (Optional)
For perfect geometric visualization:
Right-click on your chart's price axis
Select "Scale price chart only"
Enter the PBR × √φ value
The geometry will now display in perfect harmonic proportion
Step 4: Interpret the Geometry
Horizontal lines: Key support/resistance zones at phi extensions
Diagonal lines: Dynamic trend channels and future price-time balance points
Circle intersections: Natural harmonic turning points
Central diamond area: Core price-time equilibrium zone
Key Features
✅ Automatic swing detection - identifies upleg/downleg automatically
✅ Scale-invariant geometry - maintains proportions across timeframes
✅ Phi harmonic calculations - based on golden ratio mathematics
✅ Professional color scheme - clean, non-intrusive visuals
✅ Customizable display - toggle circles, lines, and table independently
✅ Smooth circle rendering - adjustable segments (16-360) for optimal smoothness
Settings
Show Horizontal Boundary Lines: Display phi extension levels
Show Rectangle Diagonal Lines: Display the geometric framework
Show Phi Harmonic Circles: Display circular geometry (optional)
Circle Smoothness: Adjust polyline segments (default: 96)
Colors: Fully customizable color scheme for all elements
Theory Background
This indicator draws inspiration from:
W.D. Gann's price-time squaring techniques
Bradley Cowan's geometric market analysis
Phi/golden ratio harmonic theory
Mathematical constants in market structure
Unlike traditional Fibonacci retracements, this tool uses √φ instead of φ as the primary scaling constant, creating a unique geometric relationship that "squares" price movement with time passage.
Best Practices
Use on significant swings - Works best on major swing highs/lows
Multiple timeframe analysis - Apply to different timeframes for confluence
Combine with other tools - Use alongside support/resistance and trend analysis
Respect the geometry - Pay attention when price interacts with geometric elements
Chart scaling optional - The geometry works at any scale, but scaling enhances visualization
Notes
The indicator draws geometry from left to right (from Nodal A to Nodal B)
All lines extend infinitely for future projections
The table shows real-time calculations for the selected range
Date range selection uses confirm dialogs to prevent accidental changes

PyraTime Intraday Cycles**Concept and Methodology**
PyraTime Intraday Cycles is a technical analysis tool designed to introduce the concept of **Temporal Cycle Projection**. While most indicators analyze price action (Y-axis), this tool focuses exclusively on the X-axis (Time).
By anchoring to a specific "Origin Pivot" (a user-defined High or Low), the script projects harmonic time intervals into the future. These vertical vectors serve as a grid, helping traders identify moments where time-based cycles may align with price structure.
**Technical Features**
This edition is optimized for **Multi-Timeframe Harmonic Flows**, utilizing a fixed algorithm for key intervals:
* **Anchor Point Logic:** The user manually selects a significant market pivot. The script calculates forward projections from this exact timestamp.
* **Standard Rhythms:** This version renders the **5-minute**, **15-minute**, **1-hour**, and **Daily** harmonic sequences. This allows for analysis across scalping, intraday, and swing trading structures.
* **Visual Confluence:** The indicator draws vertical lines to highlight potential zones of temporal exhaustion or acceleration.
**How to Use**
1. **Identify a Pivot:** Locate a significant High or Low on the chart.
2. **Set the Origin:** Open the settings and input the date/time of that pivot.
3. **Analyze Confluence:** Watch how price behaves when it approaches a vertical line. If price hits a key support/resistance level *at the same time* it hits a PyraTime vertical line, this is considered a high-probability "Time/Price" intersection.
**Version Comparison**
This script represents the foundational layer of the Great Pyramid system (PyraTime Apex).
* **PyraTime Intraday Cycles (This Script):** Focuses on Standard Timeframes (5m, 15m, 1h, Daily).
* **GPM Architecture (Advanced):** The full methodology extends these calculations to Esoteric Sequences (33, 144, 108), includes 3x Cycle Extensions, and features a Predictive Dashboard for complex multi-timeframe analysis.
**Disclaimer**
This tool is for educational and analytical purposes only. It identifies time cycles, not price direction. Past performance of a time cycle does not guarantee future results.

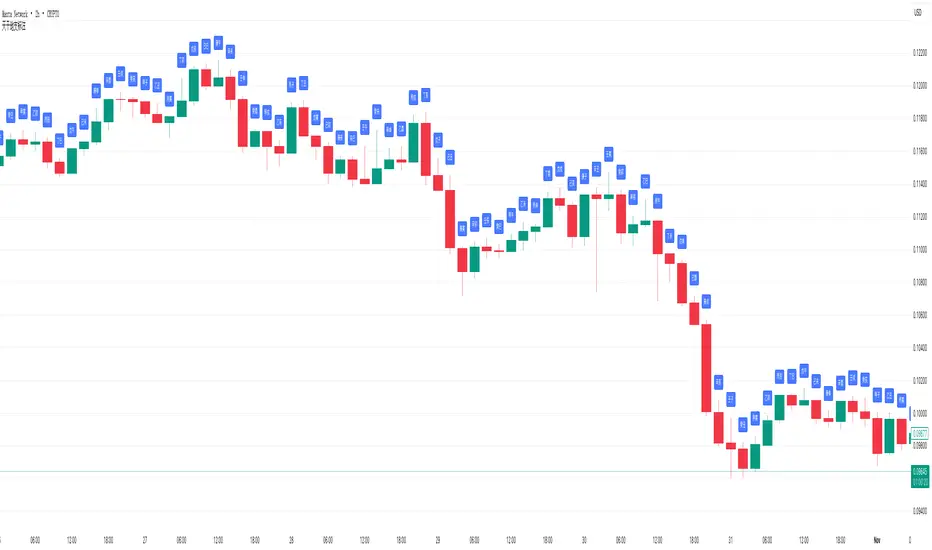
天干地支标注(当前视窗范围 + 居中标签)🇨🇳 中文说明
天干地支标注(自动匹配周期)
本指标会根据图表的时间周期(年、月、日、小时、分钟)自动计算并在每根 K 线上方显示对应的天干地支。
• 自动识别图表周期(年/月/日/时/分)
• 仅显示当前视窗内的柱子,性能高、不卡顿
• 可自定义每隔 N 根显示一次(默认每根)
• 支持居中矩形标签(label.style_label_center),清晰易读
• 无需区分暗黑/亮色主题,自动兼容所有图表样式
可作为金融时间序列与中国传统历法(干支纪时)结合的参考工具,
在时间周期研究、风水、气运周期、江恩时间分析等领域有辅助价值。
⸻
🇬🇧 English Description (for international visibility)
Heavenly Stems & Earthly Branches Marker (Auto-Adaptive Version)
This indicator automatically calculates and displays the corresponding Chinese Heavenly Stems and Earthly Branches (Ganzhi) for each candlestick, based on the chart’s timeframe (Year, Month, Day, Hour, or Minute).
• Auto-detects chart timeframe
• Draws only within the current visible window (optimized performance)
• Adjustable display interval (e.g., show every N bars)
• Uses centered label style for clarity
• Compatible with both dark and light themes
Useful for combining Chinese calendar cycles with financial time analysis, time-cycle studies, or Gann-style timing models.
ZZ RangeHappy Trading!
This is a real-time range detection indicator. Based on previous supply and demand levels, it classifies each new bar as Up, Down, or Range.
New supply and demand levels are typically detected within two bars. The indicator can be used as a filter and supports indicator-on-indicator functionality.
Intro
Concept
Usage and Settings Menu
Declaration for TradingView House Rules on Script Publishing
Disclaimer
1. Concept
Based on a variation of the Bilson-Gann Algorithm, this indicator calculates local supply and demand levels and determines whether the current price is:
Between those levels → Ranging
Above → Uptrending
Below → Downtrending
Less significant supply and demand levels are filtered out using a user-adjustable intensity setting.
2. Usage and Settings Menu
There are four settings available:
Indicator Timeframe – Display results from higher timeframes on the lower timeframe chart.
Range Detection Rule – Choose whether a bar must be fully inside supply and demand zones to be considered ranging, or if touching the zone is sufficient.
Bar Structure Basis – Select whether wicks or bodies of bars are used to calculate supply and demand levels.
Rule to set S&D – Choose among three rules defining how often new supply and demand levels are calculated. Each rule adjusts the sensitivity and responsiveness of detection.
Alert Signals Available:
Trend Signal 1 = Uptrend, 0 = Ranging, -1 = Downtrend
last supply Level
last demand Level
3. Declaration for TradingView House Rules on Script Publishing
The unique feature of ZZ Range is its real-time range detection capability.
This script is closed-source and invite-only, to support and compensate for months of development work.
4. Disclaimer
Trading involves risk, and losses can and do occur. This script is intended for informational and educational purposes only. All examples are hypothetical and not financial advice.
Decisions to buy, sell, hold, or trade securities, commodities, or other assets should be based on the advice of qualified financial professionals. Past performance does not guarantee future results.
Use this script at your own risk. It may contain bugs, and I cannot be held responsible for any financial losses resulting from its use.
Cheers!

Square Root Price Calculator By ABPinescript to Calculate Square root of Price usefull for Gann Lover

HM2 - Murrey Math Levels# Murrey Math Indicator - Comprehensive Description
## **What is Murrey Math?**
Murrey Math is a trading system developed by T.H. Murrey that divides price action into 8 equal segments (octaves) based on Gann and geometry principles. It automatically identifies key support and resistance levels where price is likely to react, making it a powerful tool for determining entry/exit points and price targets.
## **How It Works**
The indicator:
1. **Analyzes price history** over a lookback period (default 64-200 bars)
2. **Finds the highest high and lowest low** in that period
3. **Calculates a "fractal"** - a geometric scaling factor based on price magnitude
4. **Creates 8 equal divisions** between key levels, plus 4 overshoot levels (total 13 levels)
5. **Labels each level** from -2/8 to +2/8 with their trading significance
## **The 13 Murrey Math Levels**
### **Core Levels (0/8 to 8/8):**
- ** - Ultimate Support** (Blue)
- Extreme oversold condition
- Strong buying opportunity
- Price rarely breaks below this
- ** - Weak, Stall & Reverse** (Orange)
- Weak support level
- Price often stalls and reverses here
- ** - Pivot/Reverse Level** (Red)
- Major support that can become resistance
- Important reversal zone
- ** - Bottom of Trading Range - BUY Zone** (Green)
- Bottom boundary of normal trading
- **Premium BUY zone** - 40% of trading happens between 3/8 and 5/8
- ** - Major Support/Resistance** (Blue)
- **THE MOST IMPORTANT LEVEL**
- The midpoint - best entry/exit level
- Strong pivot point that price respects
- ** - Top of Trading Range - SELL Zone** (Green)
- Top boundary of normal trading
- **Premium SELL zone**
- ** - Pivot/Reverse Level** (Red)
- Major resistance that can become support
- Important reversal zone
- ** - Weak, Stall & Reverse** (Orange)
- Weak resistance level
- Price often stalls and reverses here
- ** - Ultimate Resistance** (Blue)
- Extreme overbought condition
- Strong selling opportunity
- Price rarely breaks above this
### **Overshoot Levels:**
- ** & ** (Gray) - Extreme downside overshoot zones
- ** & ** (Gray) - Extreme upside overshoot zones
- These indicate extreme moves beyond normal trading ranges
## **Trading Zones (from your diagram)**
1. **Consolidation Trading Area** (0/8 to 3/8)
- Price is in a bearish zone
- Look for BUY opportunities near support levels
2. **Normal Trading Area** (3/8 to 5/8)
- **40% of trading occurs here**
- Price oscillates between these boundaries
- Range-bound trading strategies work best
3. **Premium Trading Area** (5/8 to 8/8)
- Price is in a bullish zone
- Look for SELL opportunities near resistance levels
## **Trading Strategies**
### **Buy Signals:**
- Price bounces off 0/8 (ultimate support)
- Price pulls back to 3/8 in an uptrend
- Price breaks above 4/8 after consolidation
### **Sell Signals:**
- Price rejects at 8/8 (ultimate resistance)
- Price rallies to 5/8 in a downtrend
- Price breaks below 4/8 after consolidation
### **Range Trading:**
- Buy near 3/8, sell near 5/8 when price is ranging
- Use 4/8 as the pivot to determine trend direction
## **Key Advantages**
✅ **Objective levels** - No subjective placement
✅ **Self-adjusting** - Automatically recalculates based on recent price action
✅ **Clear trading zones** - Easy to identify support/resistance
✅ **Works on all timeframes** - From 1-minute to monthly charts
✅ **Combines with other indicators** - Works well with RSI, MACD, etc.
## **Important Notes**
- The indicator is **dynamic** - levels update as new highs/lows form
- **4/8 is the most critical level** - price above = bullish, below = bearish
- When price reaches overshoot levels (±1/8, ±2/8), expect strong reversals
- Works best in trending markets; can give false signals in choppy conditions
This geometric approach to support/resistance has been used by traders for decades and remains popular due to its objective, mathematical nature!

√ Square Root LevelsSquare Root - Based Levels Indicator
---------------------------------------------
This indicator plots key support and resistance levels based on the square root of price — a unique, mathematically-driven method rooted in price structure rather than traditional Fibonacci or percentage-based techniques.
Core Concept:
-----------------
Levels are calculated by applying the square root function to price, then multiplying or adding/subtracting scaled increments. This approach smooths volatility and reveals hidden levels of market significance that may not be visible with conventional tools.
Use Cases:
-------------
* Identify hidden support/resistance zones
* Time entries and exits based on price harmonics
* Complement other technical tools (like Fibonacci, Gann, or Pivot Points)
Customizable Settings:
----------------------------
* Base Price (Anchor)
* Increment/Multiplier
* Number of Levels
* Styling options for clean chart visuals
Whether you're a day trader or swing trader, this tool adds a mathematically unique perspective to your technical analysis.

Planetary Time Intervals [Javonnii]🪐 Planetary Time Intervals Indicator 🪐
This innovative planetary time-based market timing indicator enables traders to analyze and project planetary degree intervals directly onto any chart with exceptional accuracy. Built on a custom planetary framework, it calculates planetary positions down to the arc-second across all timeframes, accommodating up to 500 future bars. This capability allows for both clean intraday analysis and long-term market timing.
The framework operates autonomously and requires no external data or updates. It reliably computes planetary positions across centuries and supports seamless analysis across all markets—whether 24/7 assets like crypto or session-based instruments like stocks—with smooth, gap-free planetary data on any ticker or timeframe. Perfect for time-based market studies on deep historical datasets such as the Dow Jones.
🔶 FEATURES
Key planetary timing tools include:
- Standard Degree Interval Plotting (Fixed Increments)
- Price-to-Planetary Degree Conversions (360 Units Reduction & 1/10 Price Method) for Direct Price-to-Time Harmonics
- Geocentric & Heliocentric Models (Including Moon for Lunar Cycles)
- Absolute Degree Handling for Retrogrades
- Visual Projections: Background Highlights, Vertical Lines, and Degree Labels
- Math Display for Calculation Transparency
- Scaling Adjustments for Volatile Assets (e.g., Crypto, Indices)
- Multi-Timeframe Support Up to 500 Bars
- Alert Conditions for Interval Projections
- Customizable Interval Logic and Styling
- + More (Check changelog for updates)
🔶 BASIC DEMONSTRATION
On a daily stock chart, select a key low as your reference point (datetime and price). Choose a 30° interval for Mercury, and the indicator projects vertical lines forward at each degree milestone, with shaded backgrounds indicating potential cycle zones. Labels display traversed degrees, highlighting alignments in real-time.
For the 360 Conversion, input a price like $5,000—it reduces to 320° via modular arithmetic (5000 mod 360 = 320°), converting the price directly into a planetary time interval that may sync with numerological patterns or past turns.
🔶 USAGE & EXAMPLES
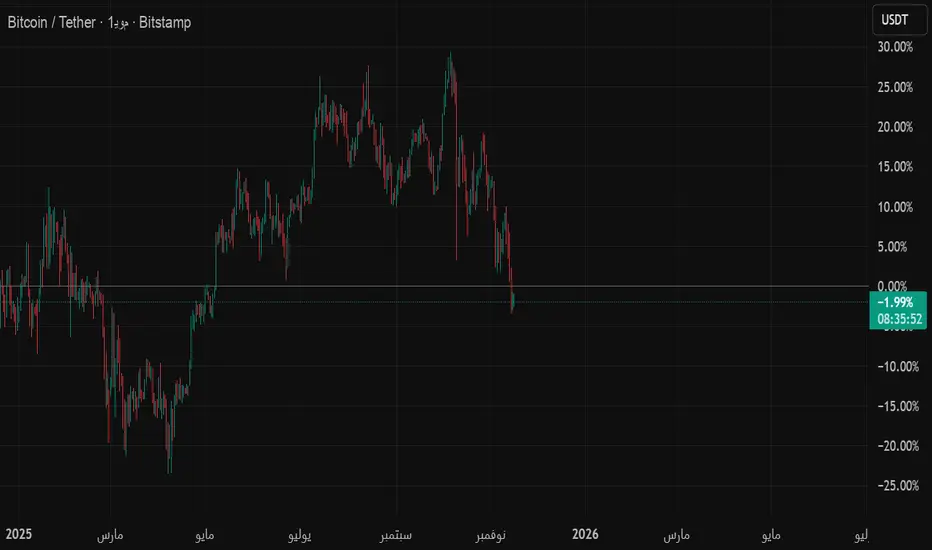
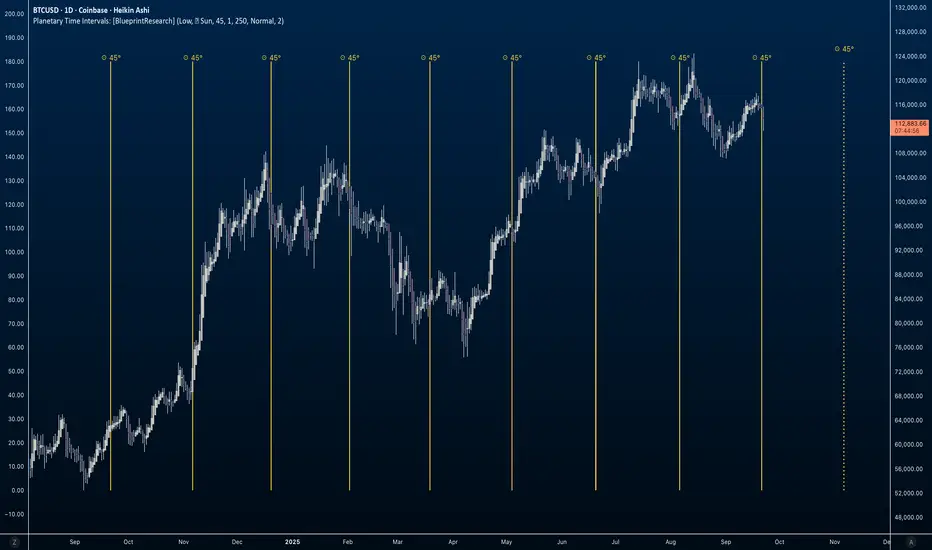
In the image below, the indicator is applied to a long-term weekly BTCUSD chart from 2015 to 2026. Selecting a historical low point (price = 198.02) as the reference, the 360 Conversion method derives the interval directly from the price. Since 198.02 is already under 360, the interval is simply 198.02° (no further reduction needed). Vertical yellow lines project these Sun-based intervals forward, aligning with a few key market turns, bull runs, and corrections. The math is displayed in the label "198.02° Low = 198.02° 360 Conversion 198.02°", illustrating the price-to-planetary time conversion process. Numerology enthusiasts might reduce 198.02° further (1+9+8+0+2=20, then 2+0=2) for symbolic insights into market balance or duality.
Supported planets: Sun, Moon, Mercury, Venus, Mars, Jupiter, Saturn, Uranus, Neptune, Pluto.
🔶 SETTINGS
- Timing Method: Select Standard Interval, 360 Conversion, or 1/10 Price.
- Planetary View: Geocentric/Heliocentric; Toggle Moon Inclusion.
- Interval Setup: Enter degrees (e.g., 45°); Enable Absolute for Retrogrades.
- Base Reference: Input datetime and price from high/low.
- Visuals: Toggle highlights, lines, math labels; Set colors/styles.
- Scaling: Adjust for asset ranges (e.g., multipliers for high or low prices).
- Limits: Bar count (up to 500)
- Styling: Label formats, projection options.
🔶 CONCLUSION
Planetary and numerological timing offers a unique lens on market rhythms, blending celestial mechanics with number-based insights for deeper analysis. This indicator is an original creation providing precise, flexible tools to explore these concepts, with a strong focus on converting price data into actionable planetary time intervals. As with all trading, past patterns aren't guarantees—pair with sound risk management and your overall approach.
🔶 HOW TO GET ACCESS
This public invite-only script is for planetary traders, market analysts, numerology enthusiasts, and anyone interested in harmonic degree-based timing. Reach out to the author for access details to this indicator and related resources.
Vibration IMP LevelsIts IMP levels to trade on the bases of Vibration date of each stock and it will plot levels on the bases of stocks.
It will work on F&O stocks only.

BK AK-SILENCER (P8N)🚨Introducing BK AK-SILENCER (P8N) — Institutional Order Flow Tracking for Silent Precision🚨
After months of meticulous tuning and refinement, I'm proud to unleash the next weapon in my trading arsenal—BK AK-SILENCER (P8N).
🔥 Why "AK-SILENCER"? The True Meaning
Institutions don’t announce their moves—they move silently, hidden beneath the noise. The SILENCER is built specifically to detect and track these stealth institutional maneuvers, giving you the power to hunt quietly, execute decisively, and strike precisely before the market catches on.
🔹 "AK" continues the legacy, honoring my mentor, A.K., whose teachings on discipline, precision, and clarity form the cornerstone of my trading.
🔹 "SILENCER" symbolizes the stealth aspect of institutional trading—quiet but deadly moves. This indicator equips you to silently track, expose, and capitalize on their hidden footprints.
🧠 What Exactly is BK AK-SILENCER (P8N)?
It's a next-generation Cumulative Volume Delta (CVD) tool crafted specifically for traders who hunt institutional order flow, combining adaptive volatility bands, enhanced momentum gradients, and precise divergence detection into a single deadly-accurate weapon.
Built for silent execution—tracking moves quietly and trading with lethal precision.
⚙️ Core Weapon Systems
✅ Institutional CVD Engine
→ Dynamically measures hidden volume shifts (buying/selling pressure) to reveal institutional footprints that price alone won't show.
✅ Adaptive AK-9 Bollinger Bands
→ Bollinger Bands placed around a custom CVD signal line, pinpointing exactly when institutional accumulation or distribution reaches critical extremes.
✅ Gradient Momentum Intelligence
→ Color-coded momentum gradients reveal the strength, speed, and silent intent behind institutional order flow:
🟢 Strong Bullish (aggressive buying)
🟡 Moderate Bullish (steady accumulation)
🔵 Neutral (balance)
🟠 Moderate Bearish (quiet distribution)
🔴 Strong Bearish (aggressive selling)
✅ Silent Divergence Detection
→ Instantly spots divergence between price and hidden volume—your earliest indication that institutions are stealthily reversing direction.
✅ Background Flash Alerts
→ Visually highlights institutional extremes through subtle background flashes, alerting you quietly yet powerfully when market-moving players make their silent moves.
✅ Structural & Institutional Clarity
→ Optional structural pivots, standard deviation bands, volume profile anchors, and session lines clearly identify the exact levels institutions defend or attack silently.
🛡️ Why BK AK-SILENCER (P8N) is Your Edge
🔹 Tracks Institutional Footprints—Silently identifies hidden volume signals of institutional intentions before they’re obvious.
🔹 Precision Execution—Cuts through noise, allowing you to execute silently, confidently, and precisely.
🔹 Perfect for Traders Using:
Elliott Wave
Gann Methods (Angles, Squares)
Fibonacci Time & Price
Harmonic Patterns
Market Profile & Order Flow Analysis
🎯 How to Use BK AK-SILENCER (P8N)
🔸 Institutional Reversal Hunting (Stealth Mode)
Bearish divergence + CVD breaking below lower BB → stealth short signal.
Bullish divergence + CVD breaking above upper BB → quiet, early long entry.
🔸 Momentum Confirmation (Silent Strength)
Strong bullish gradient + CVD above upper BB → follow institutional buying quietly.
Strong bearish gradient + CVD below lower BB → confidently short institutional selling.
🔸 Noise Filtering (Patience & Precision)
Neutral gradient (blue) → remain quiet, wait patiently to strike precisely when institutional activity resumes.
🔸 Structural Precision (Institutional Levels)
Optional StdDev, POC, Value Areas, Session Anchors clearly identify exact institutional defense/offense zones.
🙏 Final Thoughts
Institutions move in silence, leaving subtle footprints. BK AK-SILENCER (P8N) is your specialized weapon for tracking and hunting their quiet, decisive actions before the market reacts.
🔹 Dedicated in deep gratitude to my mentor, A.K.—whose silent wisdom shapes every line of code.
🔹 Engineered for the disciplined, quiet hunter who knows when to wait patiently and when to strike decisively.
Above all, honor and gratitude to Gd—the ultimate source of wisdom, clarity, and disciplined execution. Without Him, markets are chaos. With Him, we move silently, purposefully, and precisely.
⚡ Stay Quiet. Stay Precise. Hunt Silently.
🔥 BK AK-SILENCER (P8N) — Track the Silent Moves. Strike with Precision. 🔥
May Gd bless every silent step you take. 🙏
