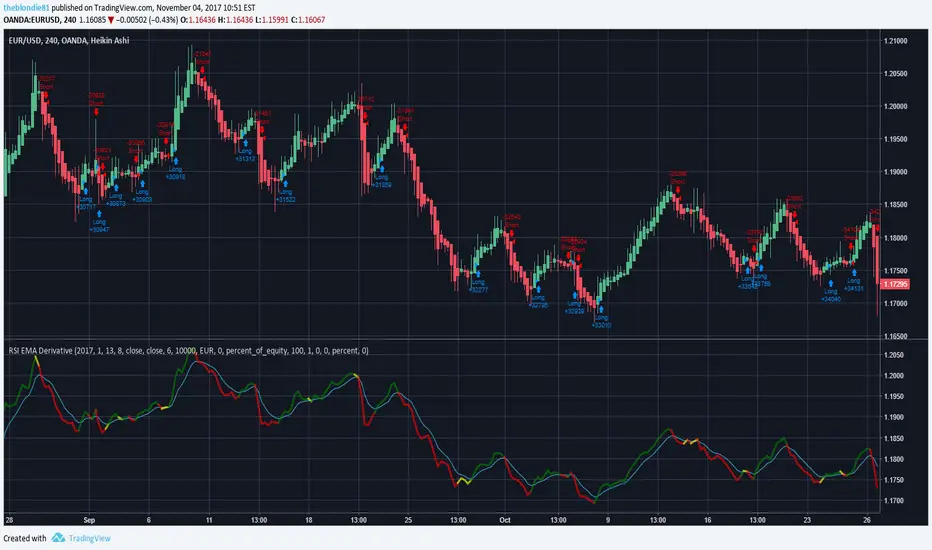
RSI EMA DerivativeUse Heiken Ashi candles to follow trends more easily.
4h or 24h time-frame is advised but any time-frame works.
Buscar en scripts para "ema"

Corpus Christi (EMA&SMA for 15 minutes) +50% in one monthIt's very simple script, useful for crypto market. Uses only SMA and EMA
cryptoanalyzer.info

SlingShot by PuffySniffs out key EMA divergences and cross overs to catch large moves and abandon bad trades.
Expect 50/50

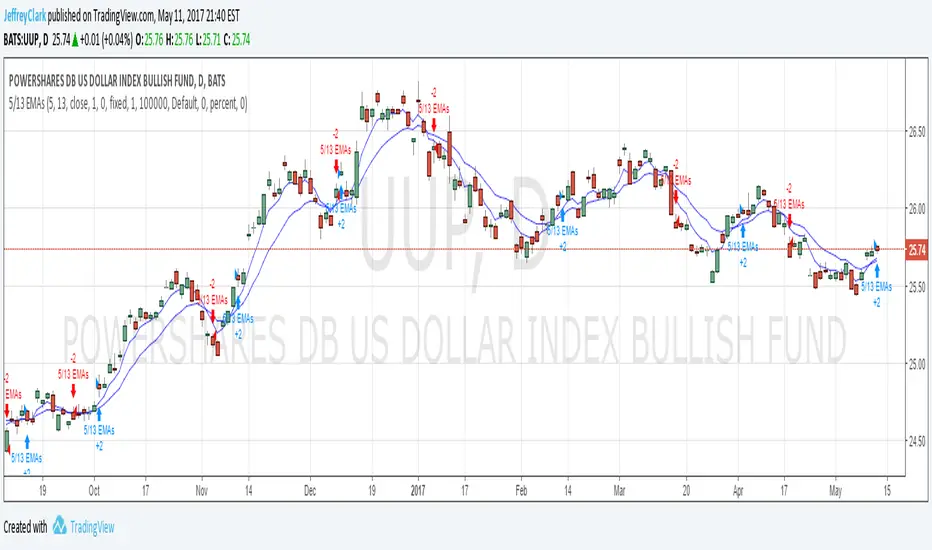
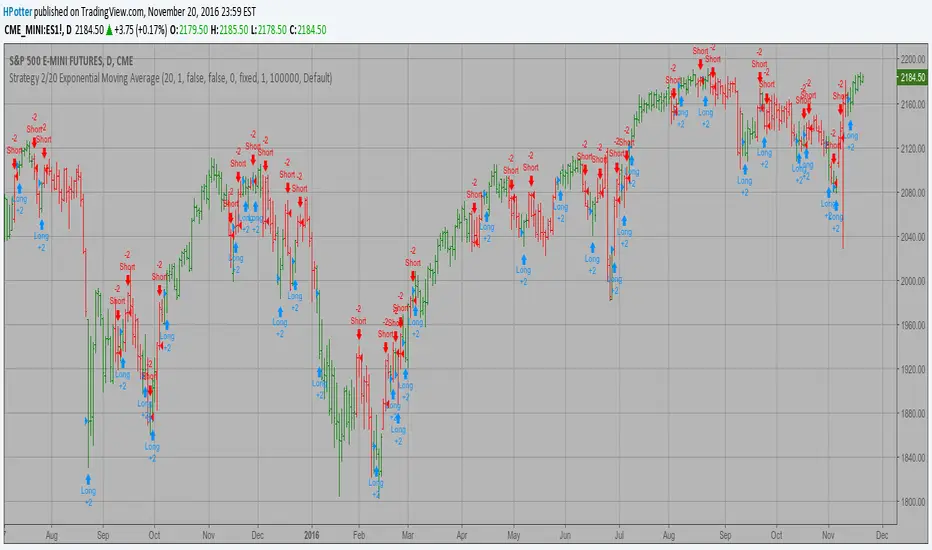
2/20 Exponential Moving Average Backtest Strategy
This indicator plots 2/20 exponential moving average. For the Mov
Avg X 2/20 Indicator, the EMA bar will be painted when the Alert criteria is met.
You can use in the xPrice any series: Open, High, Low, Close, HL2, HLC3, OHLC4 and ect...
You can change long to short in the Input Settings
Please, use it only for learning or paper trading. Do not for real trading.

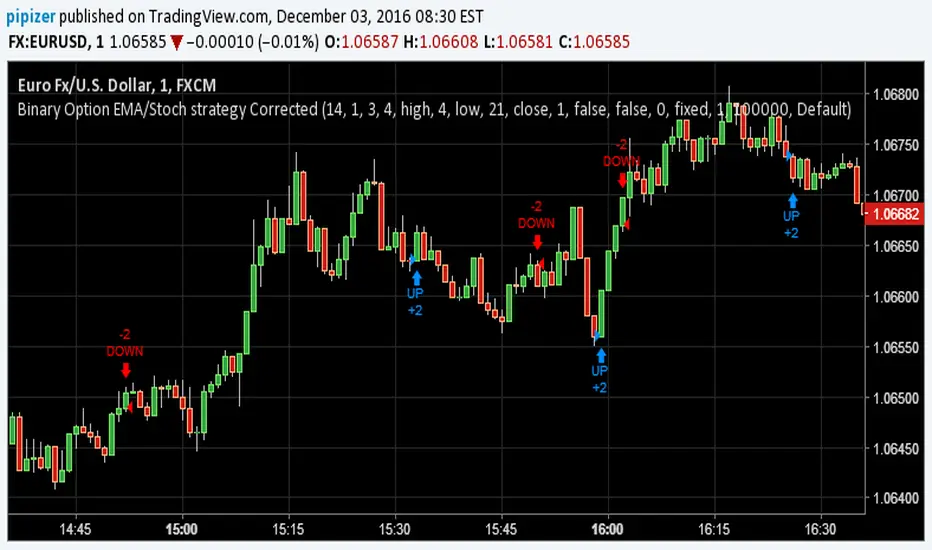
Binary Option EMA/Stoch strategy CorrectedPrevious indicator was flawed I mistakenly misplaced the script which was giving opposite signals. This on is corrected version of previous EMA/Stoch strategy.
2/20 Exponential Moving Average StrategyThis indicator plots 2/20 exponential moving average. For the Mov
Avg X 2/20 Indicator, the EMA bar will be painted when the Alert criteria is met.
Please, use it only for learning or paper trading. Do not for real trading.
Swing Hull/rsi/EMA StrategyA Swing trading strategy that use a combination of indicators, Hull average to get the trend direction, ema and rsi do the rest, use it are your own risk expecially at the end of any hull trend
Past Performance Does Not Guarantee Future Results

Forex Master (EUR/USD)ATTENTION:
This is a symmetrical algorithm designed only for trading EUR/USD on the 1h time frame. For other currency pairs and time frames, you need to re-calibrate the RSI-EMAs as well as the profit targets and stop losses.
BACKTEST CONDITIONS:
Initial equity = $100,000 (no leverage)
Order size = 100% of equity
Pyramiding = disabled
TRADING RULES:
Long entry = EMA20(RSI10) cross> 50
Profit limit = 50 pips
Stop loss = 50 pips
Short entry = EMA30(RSI30) cross< 50
Profit limit = 50 pips
Stop loss = 50 pips
Long entry = Short exit
Short entry = long exit
DISCLAIMER: None of my ideas and posts are investment advice. Past performance is not an indication of future results. This strategy was constructed with the benefit of hindsight and its future performance cannot be guaranteed.

[STRATEGY][RS]MicuRobert EMA cross V2Great thanks Ricardo , watch this man . Start at 2014 December with 1000 euro.

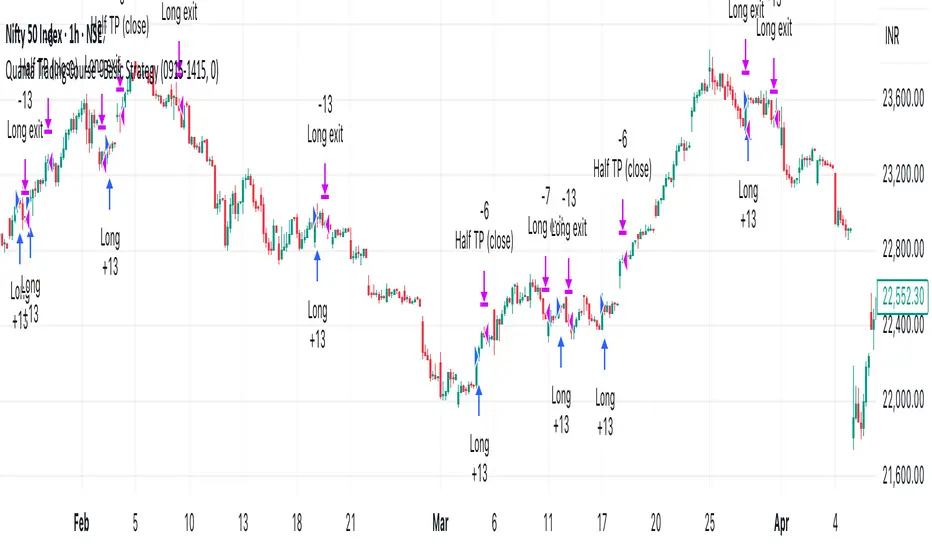
Quanta Trading Course - Basic StrategyA simple Trading strategy optimize for Nifty 1 Hour Chart. Which is Long only.
Trading TP SL### Detailed Explanation of the "Trading TP SL" Indicator:
#### 1. **Main Purpose of the Indicator**:
This Pine Script strategy is designed to automate trading decisions by using predefined Take Profit (TP) and Stop Loss (SL) levels for both buy and sell orders. It allows for visual representation of these levels on the chart through lines and labels.
---
#### 2. **Key Variables**:
- **Candle_length**: Specifies the number of candles used for calculating the Simple Moving Average (SMA).
- **Quantity_of_deals**: Defines the number of consecutive price conditions needed to trigger a trade.
- **SLbuy and SLsell**: Inputs for setting the stop loss level for buy and sell trades.
- **TPbuy1 - TPbuy4 and TPsell1 - TPsell4**: Inputs for specifying up to four take profit levels for buy and sell trades.
- **show_SL_buy and show_TP1_buy (and others)**: These options control whether the lines and labels for the specified levels are shown on the chart.
---
#### 3. **Buy Logic**:
- The script calculates the Simple Moving Average (SMA) using the number of candles specified by **Candle_length**.
- A condition is checked to see if the current price is above the SMA (**bcond = price > ma**).
- If this condition holds true for a number of candles equal to **Quantity_of_deals**, a buy trade is triggered with the command: `strategy.entry("BUY", strategy.long)`.
- The stop loss and take profit levels are calculated based on user inputs (in ticks).
##### Example:
- If the price is above the 50-period SMA, and this happens for 30 consecutive candles, a buy order will be triggered, with the corresponding SL and TP levels plotted on the chart.
---
#### 4. **Sell Logic**:
- The opposite logic applies for sell trades. If the price is below the SMA (**scond = price < ma**) for a number of candles equal to **Quantity_of_deals**, a sell trade is triggered using: `strategy.entry("SELL", strategy.short)`.
- Stop loss and take profit levels are calculated and displayed in the same way as for buy trades.
---
#### 5. **Displaying Lines and Labels**:
- Lines and labels are drawn on the chart to represent the SL and TP levels using the `line.new` and `label.new` functions.
- The visibility of these lines and labels is controlled by options like **show_SL_buy**, **show_TP1_buy**, **show_SL_sell**, etc.
##### Example:
- If **show_SL_buy** is enabled, a red line and label for the buy stop loss will appear on the chart, labeled "SL".
- The same applies for the take profit levels (TP1, TP2, etc.) and the sell orders.
---
#### 6. **Color Customization**:
- The script allows for customization of colors for different components:
- **SL_1**: The color of the buy stop loss line (red).
- **TP_1**: The color of the first take profit line for buy orders (green).
- **short1**: The color of the sell order line.
---
### Advantages:
- Full control over profit and stop loss levels.
- Flexibility to define the number of conditions required to trigger a trade.
- Options to show or hide levels on the chart, providing visual clarity.
---
### Conclusion:
This strategy is built around using the Simple Moving Average (SMA) to identify entry signals for both buy and sell trades. The stop loss and take profit levels are user-defined, with significant flexibility to customize and visualize them on the chart.
### شرح تفصيلي لمؤشر "Trading TP SL" المكتوب بلغة Pine Script:
#### 1. **الهدف الأساسي للمؤشر**:
المؤشر مصمم كاستراتيجية تداول مبنية على أوامر الشراء والبيع مع إعدادات خاصة بأهداف الربح (TP) ومستويات إيقاف الخسارة (SL). يتم تحديد هذه المستويات بشكل يدوي عن طريق المدخلات، مع إمكانية إظهار الخطوط والملصقات على الرسم البياني لتوضيح تلك المستويات.
---
#### 2. **المتغيرات الأساسية**:
- **Candle_length**: عدد الشموع المستخدمة لحساب المتوسط المتحرك البسيط (SMA).
- **Quantity_of_deals**: عدد الصفقات المطلوبة قبل تفعيل إشارة الدخول.
- **SLbuy و SLsell**: مستوى إيقاف الخسارة للشراء والبيع.
- **TPbuy1 - TPbuy4 و TPsell1 - TPsell4**: مستويات الربح المستهدفة (TP) للشراء والبيع.
- **show_SL_buy و show_TP1_buy (وما إلى ذلك)**: هذه الخيارات تظهر أو تخفي الخطوط والملصقات على الرسم البياني لكل مستوى من المستويات المحددة.
---
#### 3. **المنطق وراء الشراء**:
- يتم حساب المتوسط المتحرك البسيط (SMA) باستخدام الشموع المحددة في المتغير **Candle_length**.
- يتم التأكد مما إذا كان السعر الحالي أعلى من هذا المتوسط المتحرك البسيط (**bcond = price > ma**).
- إذا تحقق هذا الشرط لعدد من الشموع يساوي **Quantity_of_deals**، يتم تفعيل صفقة شراء باستخدام أمر: `strategy.entry("BUY", strategy.long)`.
- يتم حساب مستويات إيقاف الخسارة وأهداف الربح بناءً على القيمة المدخلة من المستخدم (القيمة بالنقاط).
##### مثال:
- إذا كان السعر الحالي أكبر من المتوسط المتحرك لمدة 50 شمعة، وحدث ذلك على التوالي لـ 30 شمعة، سيتم تفعيل صفقة شراء مع مستويات إيقاف الخسارة وأهداف الربح المعروضة على الرسم البياني.
---
#### 4. **المنطق وراء البيع**:
- يحدث العكس في حالة البيع. إذا كان السعر أقل من المتوسط المتحرك البسيط (**scond = price < ma**) وتحقق هذا الشرط لعدد من الشموع يساوي **Quantity_of_deals**، يتم تفعيل صفقة بيع باستخدام أمر: `strategy.entry("SELL", strategy.short)`.
- يتم حساب مستويات إيقاف الخسارة وأهداف الربح وفقًا للقيم المدخلة من المستخدم، وتظهر هذه المستويات على الرسم البياني.
---
#### 5. **إظهار الخطوط والملصقات**:
- يتم رسم الخطوط والملصقات على الرسم البياني لإيضاح المستويات (SL و TP) باستخدام دوال `line.new` و `label.new`.
- يمكنك التحكم في إظهار أو إخفاء هذه الخطوط والملصقات عن طريق الخيارات **show_SL_buy**, **show_TP1_buy**, **show_SL_sell**, إلخ.
##### مثال:
- إذا تم تفعيل خيار **show_SL_buy**، سيظهر خط إيقاف الخسارة للشراء على الرسم البياني بلون أحمر مع ملصق يُظهر "SL".
- يتم تكرار نفس الشيء لأهداف الربح (TP1, TP2, إلخ) وخطوط البيع.
---
#### 6. **ألوان المكونات**:
- الألوان لكل مستوى يمكن تخصيصها. على سبيل المثال:
- **SL_1**: لون إيقاف الخسارة للشراء (أحمر).
- **TP_1**: لون هدف الربح الأول للشراء (أخضر).
- **short1**: لون صفقة البيع.
---
### المزايا:
- التحكم الكامل في مستويات الربح والخسارة.
- إمكانية تخصيص عدد الصفقات المطلوبة لتفعيل إشارة الدخول.
- إظهار أو إخفاء المستويات على الرسم البياني وفقًا لرغبة المستخدم.
---
### الخلاصة:
هذه الاستراتيجية تعتمد على المتوسط المتحرك البسيط (SMA) لعدد معين من الشموع كإشارة دخول، سواء للشراء أو البيع. يتم تعيين مستويات الربح والخسارة يدويًا، مع توفير مرونة عالية في إظهار الخطوط والملصقات على الرسم البياني.

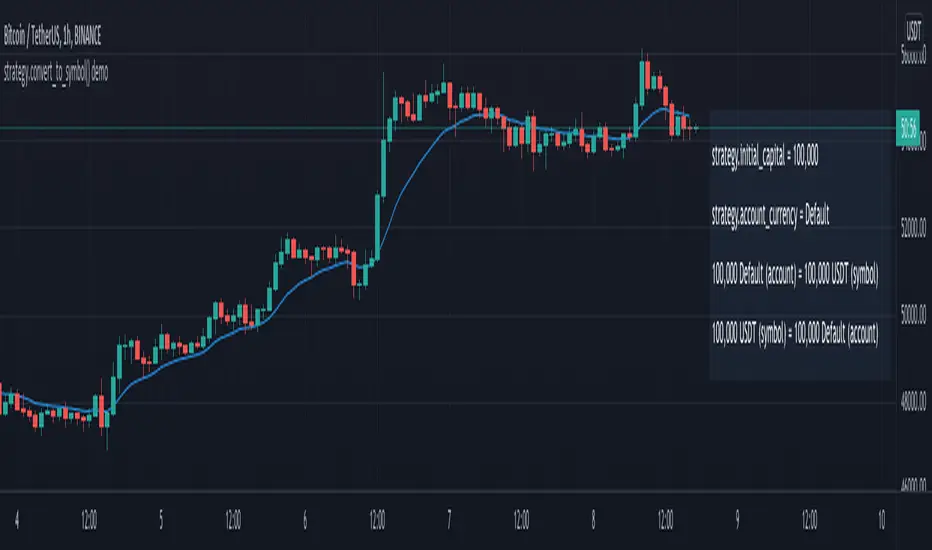
strategy.convert_to_symbol() demoA strategy demonstrating the new strategy.convert_to_symbol() and strategy.convert_to_account() functions introduced in Pine v5.
Try selecting a custom "Base Currency" under Properties to see how the conversion works.
Note: The conversion functions seem to work as expected on BTCUSD, but not on BTCUSDT. This is likely because USDT is not recognized as a currency.
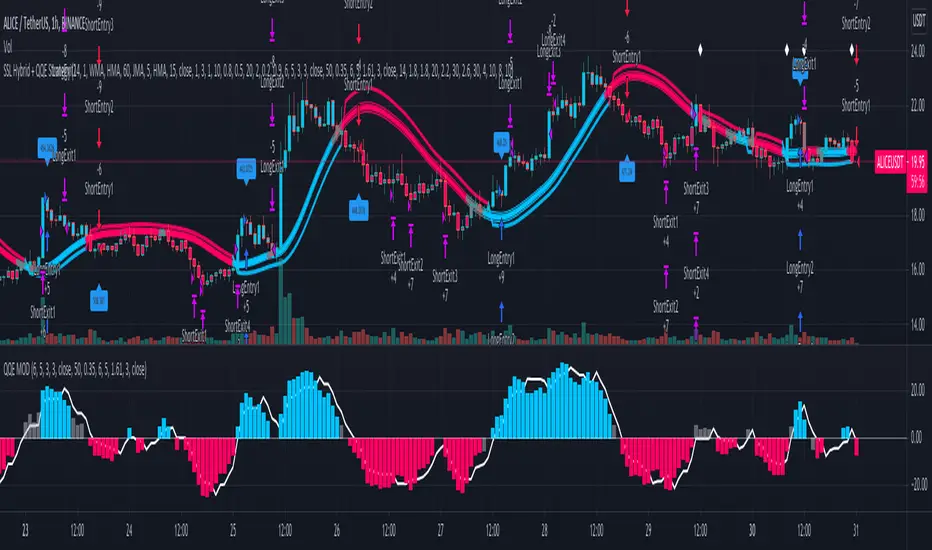
SSL Hybrid + QQE StrategySSL Hybrid strategy combining QQE MOD as trade entry filter.
Rules to enter LONG:
SSL1 is under lower baseline lower
QQE histogram bar is blue
QQE line is above 0
Rules to enter SHORT:
SSL1 is under above baseline upper
QQE histogram bar is red
QQE line is below 0
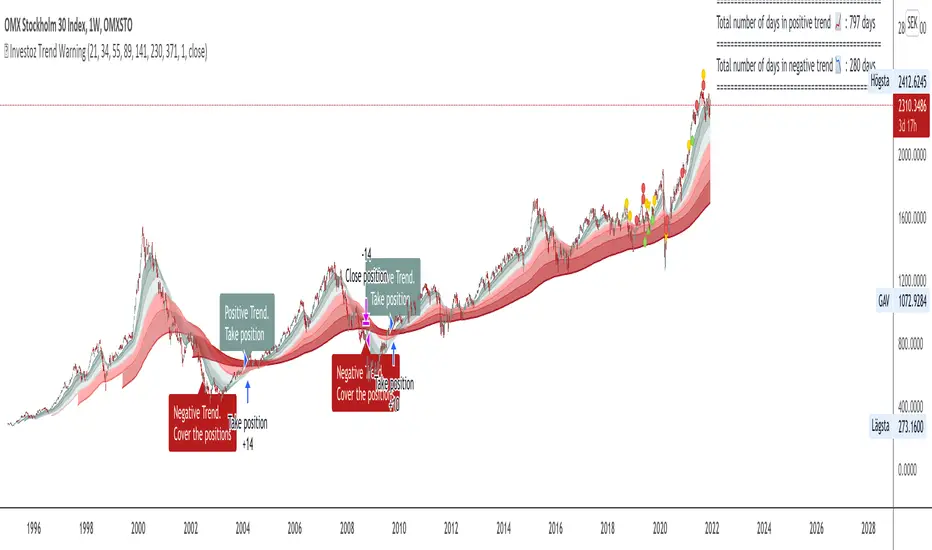
© Investoz trendwarningThe indicator is built as an educational purpose and is therefore not a recommendation for buying/selling shares.
The idea is to create a visual form in a graph that shows if there is any trend, both positive and negative. A dialog box with a warning tells you what trend prevails.
In the code, there is an opportunity to take a position or go out of position if you want to create a strategy around this trend indicator. However, I strongly recommend not to rely solely on this indicator as a buy/sell decision as the results will most likely be negative if you buy on a positive trend and sell on a negative trend. It must be combined with other ideas and therefore this script works more as a complement to your own strategy.
It is free for anyone to use this indicator and make it better.
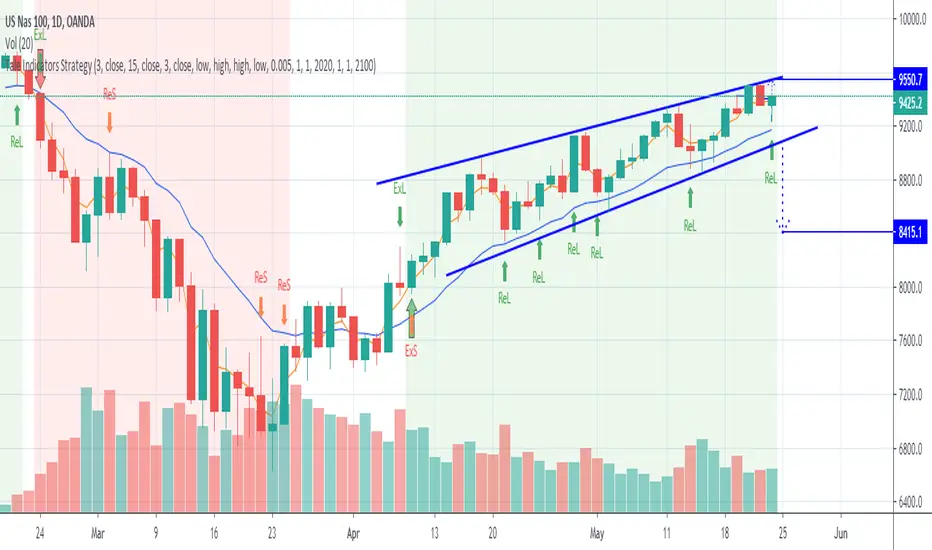
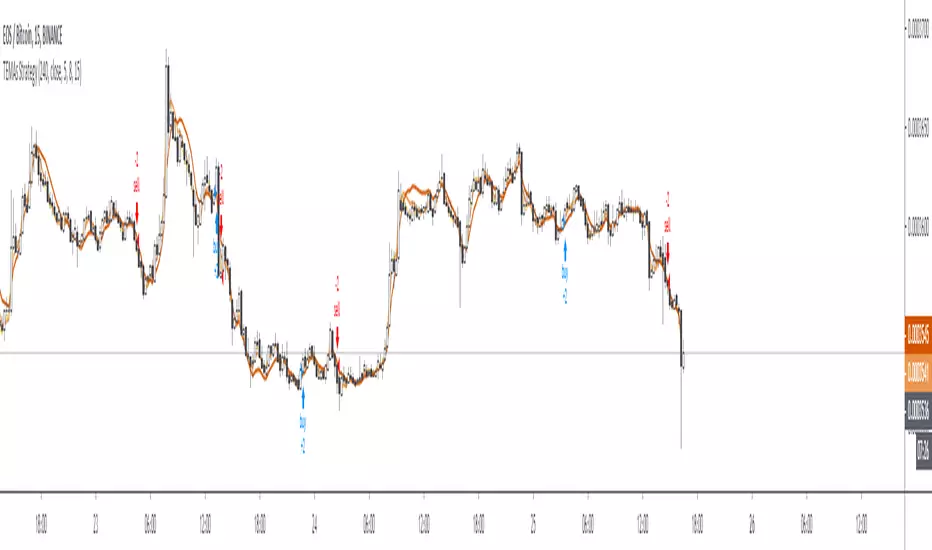
Tale Indicators StrategyThis script provides strategy from @JackBauer007 of the slowMA and fastMA crossovers to determine entry and exit conditions.
The default is set to 3EMA and 15EMA crossovers. With entry and exit for Long positions set to high and for Short positions set to low.
You can enable to run the strategy for a selected time-period to analyse the strategy on your instrument.
Credits to @ECHKAY and @JackBauer007 for their inputs and help
Camelback TechniqueCamelback Technique
As seen on Joe Ross’ trading manual. This strategy uses a moving average channel of highs and lows and an exponential moving average to define the trend.
Long
Price is above the 40-period simple moving average of highs
Slope of 15-period exponential moving average is not flat or negative
Wait for a bar with a lower low (signal bar)
Buy one tick above signal bar
Short
Price is below the 40-period simple moving average of bar lows
Slope of 15-period exponential moving average is not flat or positive
Wait for a bar with a higher high (signal bar)
Sell one tick below signal bar
References:
Joe Ross, Trading Manual, Tips, Tricks, Strategies and Tactics for Traders
forexsb.com

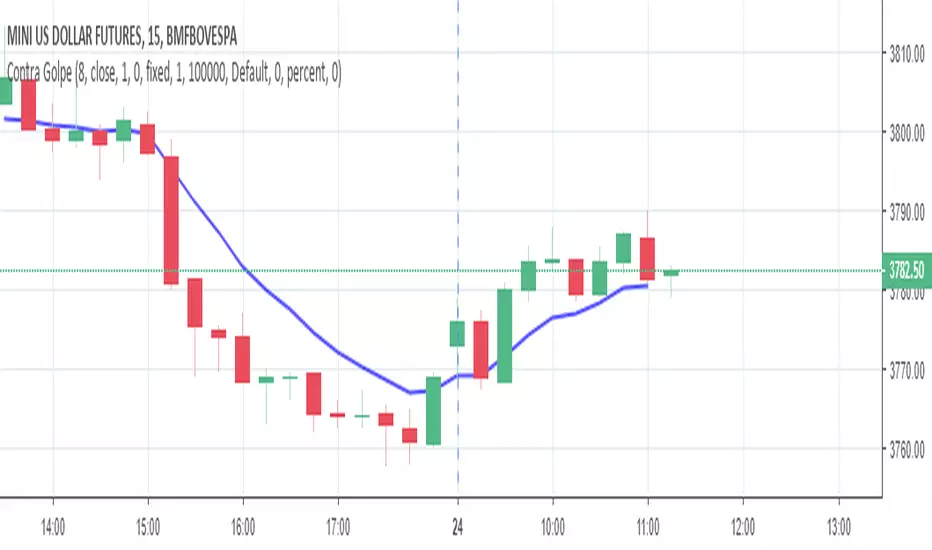
Curto e Grosso - B3 - Dolar - Mini ContratoEntrada de compra ou venda de acordo com a média e tendência do mercado.
Indicado para B3.
Dolar (Mini contrato).
Tempo gráfico de 15 minutos.
obs.:
TP de apenas 3 pontos (por isso o nome de Curto e Grosso).
Será inserido um indicador para quando entrar na operação.
Status: Em andamento.