Buscar en scripts para "ema"

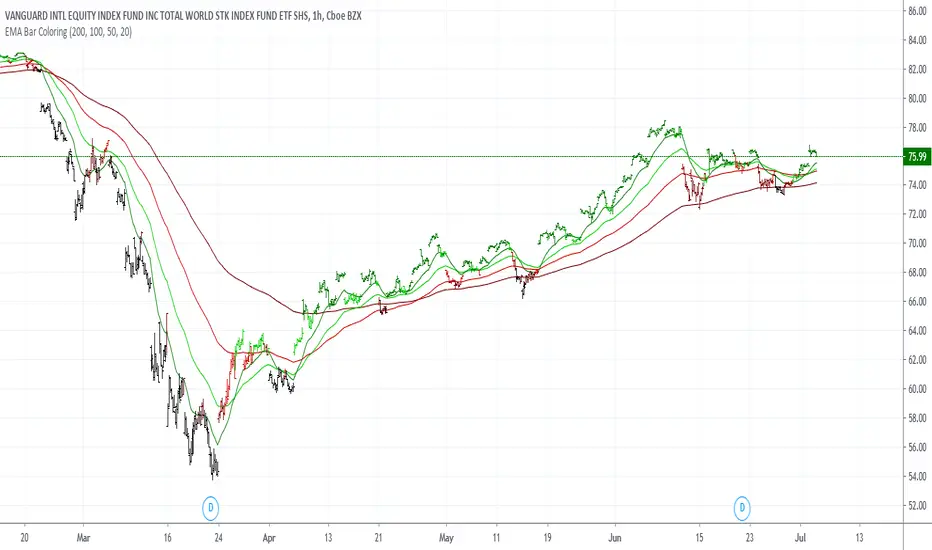
EMA Bar ColoringHi,
This is a simple visualization because I wanted to use tradingview on the cellphone with less Lines and Easy to understand.
There are 4 moving averages for each level of the closing price, the color changes.
The Moving averages can be seen in the option tab.
Also the plot of the closing prices can also be seen.
It works better with bar charts.
Best Regards,
RERS


EMAs: 10,20
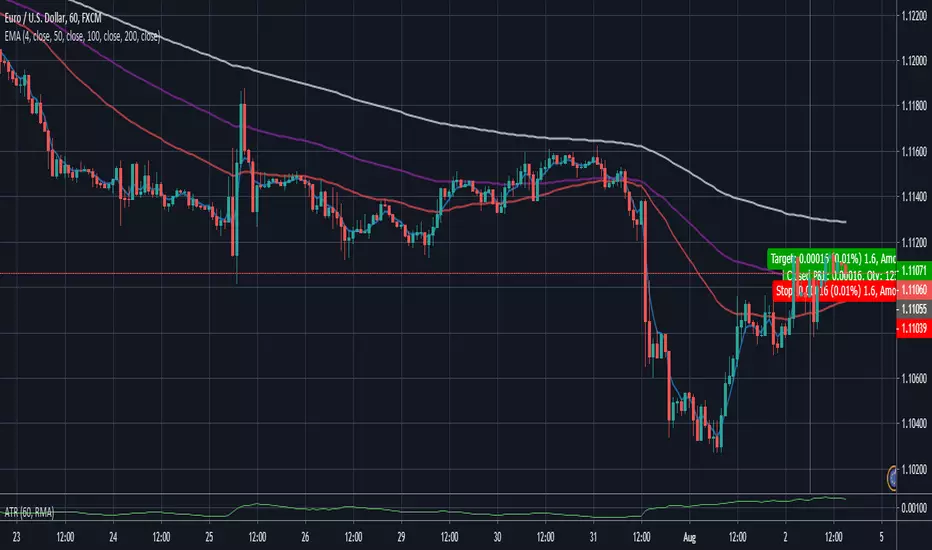
Hello this is a script that seeks to increase a bit the number of indicators used in the free version. its use is to know if a trend continues or will change, it is a very used and simple but efficient system. If the distance between the lines remains constant then it indicates or gives an indication that the trend continues but if they are cut it indicates or gives an indication of change of interest.
sorry for my bad english but I speak spanish


Infinite EMA with Alpha Control♾️ Infinite EMA with Alpha Control
What Makes This EMA "Infinite"?
Unlike traditional EMA indicators that are limited to typical periods (1-5000), this Infinite EMA breaks all boundaries. You can create EMAs with periods of 1,000, 10,000, or even 1,000,000 bars - that's why it's called "infinite"! Also Infinite EMA starts working immediately from the very first bar on your chart
Why This EMA is "Infinite":
1. Mathematically: When N → ∞, alpha → 0, meaning infinitely long "memory"
2. Practically: You can set any period - even 100,000 bars
3. Flexibility: Alpha allows precise control over the "forgetting speed"
How Does It Work?
The magic lies in the Alpha parameter. While regular EMAs use fixed formulas, this indicator gives you direct control over the EMA's "memory" through Alpha values:
• High Alpha (0.1-0.2): Fast reaction, short memory
• Medium Alpha (0.01-0.05): Balanced response
• Low Alpha (0.0001-0.001): Extremely slow reaction, very long memory
• Ultra-low Alpha (0.000001): Almost frozen in time
The Mathematical Formula:
Alpha = 2 / (Period + 1)
This means you can achieve any EMA period by adjusting Alpha, giving you infinite flexibility!
Expanded "Infinite EMA" Table:
Period EMA (N) - Alpha (Rounded) - Alpha (Exact) - Description
10 - 0.1818 - 0.181818... - Fast EMA
20 - 0.0952 - 0.095238... - Short-term
50 - 0.0392 - 0.039215... - Medium-term
100 - 0.0198 - 0.019801... - Long-term
200 - 0.0100 - 0.009950... - Standard long-term
500 - 0.0040 - 0.003996... - Very long-term
1,000 - 0.0020 - 0.001998... - Super long-term
2,000 - 0.0010 - 0.000999... - Ultra long-term
5,000 - 0.0004 - 0.000399... - Mega long-term
10,000 - 0.0002 - 0.000199... - Giga long-term
25,000 - 0.00008 - 0.000079... - Century-scale EMA
50,000 - 0.00004 - 0.000039... - Practically motionless
100,000 - 0.00002 - 0.000019... - "Glacial" EMA
500,000 - 0.000004 - 0.000003... - Geological timescale
1,000,000 - 0.000002 - 0.000001... - Approaching constant
5,000,000 - 0.0000004 - 0.0000003... - Virtually static
10,000,000 - 0.0000002 - 0.0000001... - Nearly flat line
100,000,000 - 0.00000002 - 0.00000001... - Mathematical infinity
Formula: Alpha = 2/(N+1) where N is the EMA period
Key Features:
Dual EMA System: Run fast and slow EMAs simultaneously
Crossover Signals: Automatic buy/sell signals with customizable alerts
Alpha Control: Direct mathematical control over EMA behavior
Infinite Periods: From 1 to 100,000,000+ bars
Visual Customization: Colors, fills, backgrounds, signal sizes
Instant Start: Works accurately from the very first bar
Update Intervals: Control calculation frequency for noise reduction
Why Choose Infinite EMA?
1. Unlimited Flexibility: Any period you can imagine
2. Mathematical Precision: Direct alpha control for exact behavior
3. Professional Grade: Suitable for all trading styles
4. Easy to Use: Simple settings with powerful results
5. No Warm-up Period: Accurate values from bar #1
Simple Explanation:
Think of EMA as a "memory system":
• High Alpha = Short memory (forgets quickly, reacts fast)
• Low Alpha = Long memory (remembers everything, moves slowly)
With Infinite EMA, you can set the "memory length" to anything from seconds to centuries!
⚡ Instant Start Feature - EMA from First Bar
Immediate Calculation from Bar #1
Unlike traditional EMA indicators that require a "warm-up period" of N bars before showing accurate values, Infinite EMA starts working immediately from the very first bar on your chart.
How It Works:
Traditional EMA Problem:
• Standard 200-period EMA: Needs 200+ bars to become accurate
• First 200 bars: Shows incorrect/unstable values
• Result: Large portions of historical data are unusable
Infinite EMA Solution:
Bar #1: EMA = Current Price (perfect starting point)
Bar #2: EMA = Alpha × Price + (1-Alpha) × Previous EMA
Bar #3: EMA = Alpha × Price + (1-Alpha) × Previous EMA
...and so on
Key Benefits:
No Warm-up Period: Start trading signals from day one
Full Chart Coverage: Every bar has a valid EMA value
Historical Accuracy: Backtesting works on entire dataset
New Markets: Works perfectly on newly listed assets
Short Datasets: Effective even with limited historical data
Practical Impact:
Scenario Traditional EMA Infinite EMA
New cryptocurrency Unusable for first 200 days ✅ Works from day 1
Limited data (< 200 bars) Inaccurate values ✅ Fully functional
Backtesting Must skip first 200 bars ✅ Test entire history
Real-time trading Wait for stabilization ✅ Trade immediately
Technical Implementation:
if barstate.isfirst
EMA := currentPrice // Perfect initialization
else
EMA := alpha × currentPrice + (1-alpha) × previousEMA
This smart initialization ensures mathematical accuracy from the very first calculation, eliminating the traditional EMA "ramp-up" problem.
Why This Matters:
For Backesters: Use 100% of available data
For Live Trading: Get signals immediately on any timeframe
For Researchers: Analyze complete datasets without gaps
Bottom Line: Infinite EMA is ready to work the moment you add it to your chart - no waiting, no warm-up, no exceptions!
Unlike traditional EMAs that require a "warm-up period" of 200+ bars before showing accurate values, Infinite EMA starts working immediately from bar #1.
This breakthrough eliminates the common problem where the first portion of your chart shows unreliable EMA data. Whether you're analyzing a newly listed cryptocurrency, working with limited historical data, or backtesting strategies, every single bar provides mathematically accurate EMA values.
No more waiting periods, no more unusable data sections - just instant, reliable trend analysis from the moment you apply the indicator to any chart.
🔄 Update Interval Bars Feature
The Update Interval feature allows you to control how frequently the EMA recalculates, providing flexible noise filtering without changing the core mathematics.
Set to 1 for standard behavior (updates every bar), or increase to 5-10 for smoother signals that update less frequently. Higher intervals reduce market noise and false signals but introduce slightly more lag. This is particularly useful on volatile timeframes where you want the EMA's directional bias without every minor price fluctuation affecting the calculation.
Perfect for swing traders who prefer cleaner, more stable trend lines over hyper-responsive indicators.
Conclusion
The Infinite EMA transforms the traditional EMA from a fixed-period tool into a precision instrument with unlimited flexibility. By understanding the Alpha-Period relationship, traders can create custom EMAs that perfectly match their trading style, timeframe, and market conditions.
The "infinite" nature comes from the ability to set any period imaginable - from ultra-fast 2-bar EMAs to glacially slow 10-million-bar EMAs, all controlled through a single Alpha parameter.
________________________________________
Whether you're a beginner looking for simple trend following or a professional researcher analyzing century-long patterns, Infinite EMA adapts to your needs. The power of infinite periods is now in your hands! 🚀
Go forward to the horizon. When you reach it, a new one will open up.
- J. P. Morgan

Multi-Timeframe EMAs with Cross Alerts (Up & Down)📌 Indicator Name:
Multi-Timeframe EMAs with Cross Alerts (Up & Down)
🛠️ Core Features:
✅ 1. Multi-Timeframe EMA Display
The script calculates and displays 6 different Exponential Moving Averages (EMAs).
Each EMA has:
Custom length input (e.g., 9, 21, etc.).
Custom timeframe selection (e.g., 1H, 4H, 1D).
Custom color for easy identification on the chart.
✅ 2. EMA Visualization
Each of the six EMAs is plotted on the chart using the selected color and thickness.
They respond dynamically to different timeframes (current or higher/lower).
✅ 3. Cross Detection Logic
The script can detect crossover and crossunder between EMA pairs:
EMA 1 and EMA 2
EMA 3 and EMA 4
EMA 5 and EMA 6
(Optional: can be extended to other combinations.)
✅ 4. Alert Toggles
Users can enable or disable alerts for each pair independently:
Alert: EMA 1 crosses EMA 2
Alert: EMA 3 crosses EMA 4
Alert: EMA 5 crosses EMA 6
(You added an additional option for EMA 4 vs EMA 6 later.)
✅ 5. Visual Alert Markers
The script uses alert() function to send alert messages when:
An EMA crosses above another (crossover)
An EMA crosses below another (crossunder)
Alerts include clear icons like 🔼 and 🔽 in the messages.
🔔 Use Case Scenarios
Swing traders: Identify longer-term cross signals on higher timeframes.
Scalpers: Use lower-timeframe EMAs with fast alert reactions.
Multi-timeframe analysis: Spot alignment between trend-following EMAs across different periods.
✅ Bonus
Fully customizable — great for adapting to your own strategy, whether it's trend confirmation, re-entry signals, or early reversals
📌 اسم المؤشر:
المتوسطات المتحركة الأسية (EMA) متعددة الفريمات مع تنبيهات تقاطع صاعدة وهابطة
🛠️ الميزات الأساسية:
✅ 1. دعم متعدد للفريمات الزمنية
يقوم السكربت بحساب وعرض 6 متوسطات متحركة أسية (EMA) مختلفة.
يمكن تخصيص كل EMA من حيث:
الطول (مثل: 9، 21...).
الفريم الزمني (مثل: الساعة، الأربع ساعات، اليومي...).
اللون، لتسهيل التمييز بين الخطوط على الشارت.
✅ 2. عرض المتوسطات على الرسم البياني
يتم رسم كل من المتوسطات الستة باستخدام اللون والتنسيق الذي تختاره.
المتوسطات تتفاعل تلقائيًا مع التغييرات في الفريم الزمني.
✅ 3. كشف التقاطعات
يمكن للسكربت كشف تقاطعات (صعودًا أو هبوطًا) بين أزواج المتوسطات التالية:
EMA 1 و EMA 2
EMA 3 و EMA 4
EMA 5 و EMA 6
(ويمكنك إضافة المزيد مثل EMA 4 مع EMA 6 حسب الحاجة)
✅ 4. التحكم في التنبيهات
يمكن للمستخدم تفعيل أو تعطيل التنبيهات لكل زوج من المتوسطات على حدة:
تنبيه عند تقاطع EMA 1 و EMA 2
تنبيه عند تقاطع EMA 3 و EMA 4
تنبيه عند تقاطع EMA 5 و EMA 6
(وأي أزواج إضافية يتم إضافتها لاحقًا)
✅ 5. تنبيهات مرئية برسائل واضحة
السكربت يرسل تنبيهات عبر وظيفة alert() عند حدوث:
تقاطع صاعد (EMA يتقاطع من الأسفل إلى الأعلى).
تقاطع هابط (EMA يتقاطع من الأعلى إلى الأسفل).
التنبيه يحتوي على رموز توضيحية مثل 🔼 و 🔽 ليسهل قراءته.
🎯 مناسب لـ:
المتداولين المتأرجحين (Swing Traders): لاكتشاف تقاطعات على الفريمات الكبرى.
المضاربين (Scalpers): باستخدام EMA سريعة على فريمات صغيرة مع تنبيهات فورية.
محللي الفريمات المتعددة: لتأكيد الاتجاه أو الانعكاس بناءً على تقاطع متوسطات من فريمات مختلفة.
✅ مزايا إضافية:
قابل للتخصيص بشكل كامل حسب استراتيجيتك.
مناسب لعدة أساليب: تأكيد الترند، إعادة الدخول، أو إشارات الانعكاس المبكر.

Commodity Channel Index CCI + EMA strategy
================================================================================
COMMODITY CHANNEL INDEX CCI + EMA STRATEGY - STRATEGY GUIDE 📊
================================================================================
💡 COLLABORATION & SUPPORT
---------------------------
If you want to collaborate, have an idea for a strategy, or need help writing
or customizing code, send an email to burdytrader@gmail.com or send me a
message. Suggestions, ideas, and comments are always welcome! 🤝
I also develop automated trading codes for other trading platforms including:
- CTrader (C#)
- MetaTrader 4 (MQL4)
- MetaTrader 5 (MQL5)
If you need a strategy converted or developed for any of these platforms, feel
free to contact me!
================================================================================
⚠️ IMPORTANT: INSTRUMENT SELECTION 📈
-------------------------------------
This strategy performs BEST with currency pairs (forex). The CCI indicator
works particularly well in the forex market due to the nature of currency
movements and the effectiveness of the CCI in identifying overbought and
oversold conditions in trending markets.
Why Currency Pairs? 🎯
- CCI is highly effective in identifying reversals in forex markets
- Currency pairs show clear overbought/oversold patterns
- EMA filter (50/200) aligns well with major forex trends
- High liquidity ensures reliable signal execution
Performance Highlights:
In specific currency pairs, when properly configured, this strategy can achieve:
- Profit Factor: Over 2.0
- Win Rate: Up to 70%
- Particularly effective pairs: USDCAD, EURUSD, GBPJPY
While the strategy can work with other instruments (stocks, indices, commodities),
currency pairs provide the most consistent and reliable results. For optimal
performance, focus on major forex pairs with good liquidity and clear trending
characteristics.
================================================================================
WHAT DOES THIS STRATEGY DO? 🎯
---------------------------
This strategy combines the Commodity Channel Index (CCI) with Exponential
Moving Averages (EMA) to identify high-probability trading opportunities.
The strategy uses CCI crossovers with a smoothing moving average and filters
signals using EMA trend confirmation. The strategy automatically enters trades
when CCI crosses the smoothing MA in specific zones, indicating potential trend
reversals or continuations.
HOW IT WORKS? ⚙️
---------------
1. CCI CALCULATION 📈
The strategy calculates the Commodity Channel Index using:
- CCI = (Price - SMA(Price, length)) / (0.015 × Deviation(Price, length))
- Default length: 20 periods
- Source: HLC3 (typical price)
The CCI shows:
- Values above +100 = Overbought conditions
- Values below -100 = Oversold conditions
- Values around 0 = Neutral conditions
2. SMOOTHING MOVING AVERAGE 📊
A moving average is applied to the CCI to smooth out fluctuations:
- Types available: SMA, EMA, SMMA (RMA), WMA, VWMA
- Default: SMA with length 14
- Can be disabled (set to "None")
This smoothed line acts as a reference for crossover signals.
3. EMA TREND FILTER 🎯
Two EMAs are calculated on the CCI:
- EMA 50 (fast EMA)
- EMA 200 (slow EMA)
When the EMA filter is enabled:
- LONG signals only occur when EMA50 > EMA200 (uptrend confirmation)
- SHORT signals only occur when EMA50 < EMA200 (downtrend confirmation)
This filter can be enabled/disabled via the "Use EMA Filter" option.
4. ENTRY CONDITIONS 🎲
LONG ENTRY (Buy Signal):
- CCI crosses ABOVE the Smoothing MA (crossover)
- CCI is between Lower Level (-100) and Middle Level (0)
- EMA Filter: EMA50 > EMA200 (if filter enabled)
- No existing positions (or close opposite positions first)
SHORT ENTRY (Sell Signal):
- CCI crosses BELOW the Smoothing MA (crossunder)
- CCI is between Middle Level (0) and Upper Level (+100)
- EMA Filter: EMA50 < EMA200 (if filter enabled)
- No existing positions (or close opposite positions first)
5. POSITION MANAGEMENT 💰
The strategy uses a simple position management approach:
- Only ONE position at a time (no pyramiding)
- If a signal occurs in the opposite direction, closes existing position first
- Then opens new position in the new direction
- This prevents overexposure and simplifies risk management
6. TAKE PROFIT & STOP LOSS SETTINGS 🎯
The strategy uses percentage-based TP/SL:
- Take Profit: 1.0% (default, configurable)
- Stop Loss: 0.5% (default, configurable)
- Risk/Reward Ratio: 2:1 (TP is double the SL)
TP/SL are calculated once when the position opens and remain fixed.
AVAILABLE PARAMETERS ⚙️
-----------------------
CCI SETTINGS:
1. CCI Length (Default: 20)
- Period for CCI calculation
- Lower values = More sensitive to recent price action
- Higher values = More smoothed, less sensitive
2. CCI Source (Default: HLC3)
- Price source for CCI calculation
- Options: close, open, high, low, hlc3, hlcc4, ohlc4
3. CCI Lower Level (Default: -100)
- Lower boundary for LONG entry zone
- Typically -100 for oversold conditions
4. CCI Middle Level (Default: 0)
- Neutral level separating LONG and SHORT zones
5. CCI Upper Level (Default: +100)
- Upper boundary for SHORT entry zone
- Typically +100 for overbought conditions
SMOOTHING MA:
6. Type (Default: SMA)
- Moving average type: None, SMA, EMA, SMMA (RMA), WMA, VWMA
- Set to "None" to disable smoothing
7. Length (Default: 14)
- Period for smoothing MA
- Range: 7-28, step 7
EMA FILTER:
8. EMA 1 Length (Default: 50)
- Fast EMA period applied to CCI
9. EMA 2 Length (Default: 200)
- Slow EMA period applied to CCI
10. Use EMA Filter (Default: true)
- Enable/disable EMA trend filter
- When enabled: LONG only if EMA50 > EMA200, SHORT only if EMA50 < EMA200
RISK MANAGEMENT:
11. Take Profit (%) (Default: 1.0%)
- Profit target as percentage of entry price
- For LONG: Entry × (1 + TP%)
- For SHORT: Entry × (1 - TP%)
12. Stop Loss (%) (Default: 0.5%)
- Stop loss as percentage of entry price
- For LONG: Entry × (1 - SL%)
- For SHORT: Entry × (1 + SL%)
VISUALIZATION 📊
---------------
The strategy displays in a separate panel below the price chart:
1. CCI LINE
- Blue line showing the CCI value
- Oscillates around zero
2. SMOOTHING MA LINE
- Yellow line showing the smoothed CCI
- Reference line for crossover signals
3. CCI LEVEL LINES
- Red dashed line: Upper Level (+100)
- Green dashed line: Lower Level (-100)
- Yellow dashed line: Middle Level (0)
4. ENTRY SIGNALS
- Green cross: LONG entry signal (when CCI crosses above MA)
- Red cross: SHORT entry signal (when CCI crosses below MA)
RECOMMENDED SETTINGS 🎯
-----------------------
To get started, you can use these settings:
CCI SETTINGS:
- CCI Length: 20 (default)
- CCI Source: HLC3 (default)
- CCI Lower Level: -100 (default)
- CCI Middle Level: 0 (default)
- CCI Upper Level: +100 (default)
SMOOTHING MA:
- Type: SMA (default) or EMA for faster response
- Length: 14 (default)
EMA FILTER:
- EMA 1 Length: 50 (default)
- EMA 2 Length: 200 (default)
- Use EMA Filter: true (recommended for better signal quality)
RISK MANAGEMENT:
- Take Profit (%): 1.0% (adjust based on your risk/reward preference)
- Stop Loss (%): 0.5% (adjust based on your risk tolerance)
For more aggressive trading:
- Reduce CCI Length to 14-16
- Reduce Smoothing MA Length to 7
- Disable EMA Filter
For more conservative trading:
- Increase CCI Length to 24-30
- Increase Smoothing MA Length to 21-28
- Keep EMA Filter enabled
RECOMMENDED CURRENCY PAIRS 💱
------------------------------
This strategy is optimized for currency pairs and performs exceptionally well
on the following pairs when properly configured:
TOP PERFORMING PAIRS:
- USDCAD: Can achieve Profit Factor > 2.0 and Win Rate up to 70%
- EURUSD: Excellent performance with consistent signals
- GBPJPY: Strong results with proper EMA filter configuration
These pairs have shown the best historical performance due to:
- Clear trending characteristics
- Good response to CCI overbought/oversold levels
- Strong alignment with EMA 50/200 trend filter
- High liquidity ensuring reliable execution
When trading these pairs, use the default settings or slightly adjusted
parameters based on the pair's volatility. Always backtest on historical
data before using real money to find the optimal configuration for each
specific pair.
PRACTICAL EXAMPLE 📝
--------------------
Scenario: LONG Entry on EUR/USD
1. Market conditions:
- Price: 1.1000
- CCI: -80 (in oversold zone)
- Smoothing MA: -90
- CCI crosses above Smoothing MA (crossover occurs)
- EMA50: -50, EMA200: -70 (EMA50 > EMA200, uptrend confirmed)
2. Strategy checks conditions:
✓ Smoothing MA enabled: Yes
✓ Crossover: Yes (CCI crosses above MA)
✓ CCI in range: Yes (-100 <= -80 <= 0)
✓ EMA Filter: Yes (EMA50 > EMA200)
✓ No existing position: Yes
3. Strategy opens position:
- Direction: LONG (Buy)
- Entry: 1.1000 (current close)
- Take Profit: 1.1110 (1.0% above entry)
- Stop Loss: 1.0945 (0.5% below entry)
- Risk/Reward: 2:1
4. Outcome scenarios:
- If price rises to 1.1110 → Take Profit hit (profit)
- If price falls to 1.0945 → Stop Loss hit (loss limited)
IMPORTANT NOTE ⚠️
-----------------
This strategy is a technical analysis tool based on CCI and EMA indicators.
Like all trading strategies, it does NOT guarantee profits. Trading involves
significant risks and you can lose money, including your entire investment.
Past performance does not guarantee future results.
Always:
- Use appropriate risk management
- Never risk more than you can afford to lose
- Test the strategy on historical data (backtesting) before using real money
- Start with small position sizes or paper trading
- Understand that no strategy works 100% of the time
- Consider market conditions, news events, and other factors
- Keep a trading journal to learn and improve
The author and contributors are NOT responsible for any losses incurred from
using this strategy. Trading decisions are your own responsibility. Profits
are NOT guaranteed, and losses are possible.
LICENSE 📄
----------
This code is open source and available for modification. You are free to use,
modify, and distribute this strategy. If you republish or share a modified
version, please kindly mention the original author.
================================================================================

Auto-Length Anchored Multiple EMA (Hour-Based)# Auto-Length Anchored Multiple EMA (Hour-Based)
## Overview
This advanced EMA indicator automatically calculates Exponential Moving Average lengths based on the time elapsed since user-defined anchor dates. Unlike traditional fixed-length EMAs, this indicator dynamically adjusts EMA periods based on actual trading hours, making it ideal for event-based analysis and time-sensitive trading strategies.
## Key Features
### 🎯 **Dual Mode Operation**
- **Auto Mode**: EMA length automatically calculated from anchor date to current time
- **Manual Mode**: Traditional fixed-length EMA calculation
- Switch between modes independently for each EMA
### 📊 **Multiple EMA Support**
- Up to 4 independent EMAs with individual configurations
- Each EMA can have its own anchor date and settings
- Individual enable/disable controls for each EMA
### ⏰ **Smart Time Calculation**
- Accounts for actual trading hours (customizable)
- Weekend exclusion with Saturday trading option (for markets like NSE/BSE)
- Hour multiplier for fine-tuning EMA sensitivity
- Minimum EMA length protection to prevent calculation errors
### 🎨 **Visual Enhancements**
- **Dynamic Fill Colors**: Fill between EMA1 and EMA3 changes color based on price position
- **Customizable Colors**: Individual color settings for each EMA
- **Anchor Visualization**: Optional vertical lines and labels at anchor dates
- **Real-time Table**: Shows current EMA lengths, modes, and values
## Configuration Options
### Trading Session Settings
- **Trading Hours Per Day**: Set your market's trading hours (1-24)
- **Trading Days Per Week**: Configure for different markets (5 for Mon-Fri, 6 for Mon-Sat)
- **Include Saturday**: Enable for markets that trade on Saturday
- **Hour Multiplier**: Fine-tune EMA sensitivity (0.1x to 10x)
### EMA Configuration
- **Anchor Dates**: Set specific start dates for each EMA calculation
- **Manual Lengths**: Override with traditional fixed periods when needed
- **Enable/Disable**: Individual control for each EMA
- **Color Customization**: Personalize appearance for each EMA
### Visual Options
- **Fill Settings**: Toggle and customize fill colors between EMAs
- **Anchor Lines**: Show vertical lines at anchor dates
- **Anchor Labels**: Display formatted anchor date information
- **Length Table**: Real-time display of current EMA parameters
## Use Cases
### 📈 **Event-Based Analysis**
- Anchor EMAs to earnings announcements, policy decisions, or market events
- Track price behavior relative to specific time periods
- Analyze momentum changes from key market catalysts
### 🕐 **Time-Sensitive Trading**
- Perfect for intraday strategies where timing is crucial
- Automatically adjusts to market hours and trading sessions
- Eliminates manual EMA length recalculation
### 🌍 **Multi-Market Support**
- Configurable for different global markets
- Saturday trading support for Asian markets
- Flexible trading hour settings
## Technical Details
### Calculation Method
The indicator calculates trading bars elapsed since anchor date using:
```
Total Trading Bars = (Days Since Anchor × Trading Days Per Week ÷ 7) × Trading Hours Per Day × Hour Multiplier
```
### EMA Formula
Uses standard EMA calculation with dynamically calculated alpha:
```
Alpha = 2 ÷ (Current Length + 1)
EMA = Alpha × Current Price + (1 - Alpha) × Previous EMA
```
### Weekend Handling
- Automatically excludes weekends from calculation
- Optional Saturday inclusion for specific markets
- Accurate trading day counting
## Installation & Setup
1. **Add to Chart**: Apply the indicator to your desired timeframe
2. **Set Anchor Dates**: Configure anchor dates for each EMA you want to use
3. **Adjust Trading Hours**: Set your market's trading session parameters
4. **Customize Appearance**: Choose colors and visual options
5. **Enable Features**: Turn on fills, anchor lines, and information table as needed
## Best Practices
- **Anchor Selection**: Choose significant market events or technical breakouts as anchor points
- **Multiple Timeframes**: Use different anchor dates for short, medium, and long-term analysis
- **Hour Multiplier**: Start with 1.0 and adjust based on market volatility and your trading style
- **Visual Clarity**: Use contrasting colors for different EMAs to improve readability
## Compatibility
- **Pine Script Version**: v6
- **Chart Types**: All chart types supported
- **Timeframes**: Works on all timeframes (optimal on intraday charts)
- **Markets**: Suitable for stocks, forex, crypto, and commodities
## Notes
- Indicator starts calculation from the anchor date forward
- Minimum EMA length prevents calculation errors with very recent anchor dates
- Table display updates in real-time showing current EMA parameters
- Fill colors dynamically change based on price position relative to EMA1
---
*This indicator is perfect for traders who want to combine the power of EMAs with event-driven analysis and precise time-based calculations.*

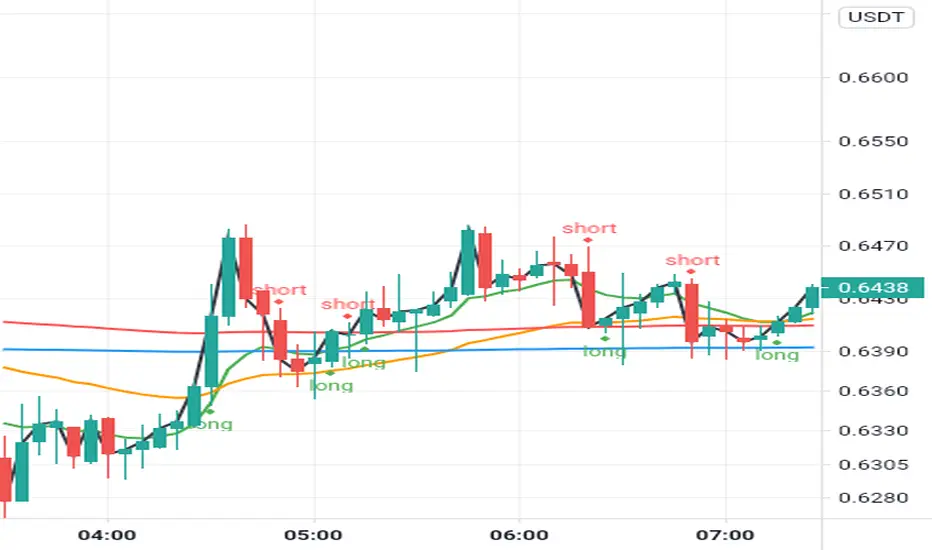
EMA Crossover with RSI and DistanceEMA Crossover with RSI and Distance Strategy
This strategy combines Exponential Moving Averages (EMA) with Relative Strength Index (RSI) and distance-based conditions to generate buy, sell, and neutral signals. It is designed to help traders identify entry and exit points based on multiple technical indicators.
Key Components:
Exponential Moving Averages (EMA):
The strategy uses four EMAs: EMA 5, EMA 13, EMA 40, and EMA 55.
A buy signal (long) is triggered when EMA 5 crosses above EMA 13 and EMA 40 crosses above EMA 55.
A sell signal (short) is generated when EMA 55 crosses above EMA 40.
The distance between EMAs (5 and 13) is also important. If the current distance between EMA 5 and EMA 13 is smaller than the average distance over the last 5 candles, a neutral condition is triggered, preventing a signal even if all other conditions are met.
Relative Strength Index (RSI):
The 14-period RSI is used to determine market strength and direction.
The strategy requires RSI to be above 50 and greater than the average RSI (over the past 14 periods) for a buy signal.
If the RSI is above 60, a green signal is given, indicating a strong bullish condition, even if the EMA conditions are not fully met.
If the RSI is below 40, a red signal is given, indicating a strong bearish condition, regardless of the EMA crossover.
Distance Conditions:
The strategy calculates the distance between EMA 5 and EMA 13 on each candle and compares it to the average distance of the last 5 candles.
If the current distance between EMA 5 and EMA 13 is lower than the average of the last 5 candles, a neutral signal is triggered. This helps avoid entering a trade when the market is losing momentum.
Additionally, if the distance between EMA 40 and EMA 13 is greater than the previous distance, the previous signal is kept intact, ensuring that the trend is still strong enough for the signal to remain valid.
Signal Persistence:
Once a buy (green) or sell (red) signal is triggered, it remains intact as long as the price is closing above EMA 5 for long trades or below EMA 55 for short trades.
If the price moves below EMA 5 for long trades or above EMA 55 for short trades, the signal is recalculated based on the most recent conditions.
Signal Display:
Green Signals: Represent a strong buy signal and are shown below the candle when the RSI is above 60.
Red Signals: Represent a strong sell signal and are shown above the candle when the RSI is below 40.
Neutral Signals: Displayed when the conditions for entry are not met, specifically when the EMA distance condition is violated.
Long and Short Signals: Additional signals are shown based on the EMA crossovers and RSI conditions. These signals are plotted below the candle for long positions and above the candle for short positions.
Trade Logic:
Long Entry: Enter a long trade when EMA 5 crosses above EMA 13, EMA 40 crosses above EMA 55, and the RSI is above 50 and greater than the average RSI. Additionally, the current distance between EMA 5 and EMA 13 should be larger than the average distance of the last 5 candles.
Short Entry: Enter a short trade when EMA 55 crosses above EMA 40 and the RSI is below 40.
Neutral Condition: If the distance between EMA 5 and EMA 13 is smaller than the average distance over the last 5 candles, the strategy will not trigger a signal, even if other conditions are met.
