[Backtest Crypto] Cross MAThis script is designed for testing the moving average crossover strategy.
Script settings:
Select testing range
Indicator settings: Select moving average type (EMA, SMA, WMA, SMMA, HMA) and period
Trade management: Select risk-to-reward ratio, stop-loss defined as min/max for a certain number of candles (you can set a desired number), option to partially lock in a position by moving the stop-loss to breakeven, trailing stop, or close a position on an opposite signal.
Option to limit the stop-loss by ATR to prevent it from becoming too large during volatile movements.
===============================================================
Скрипт предназначен для тестирования стратегии пересечение скользящих средних.
Настройки скрипта:
Выбор диапазона тестирования
Настройки индикатора: выбор типа скользящей (EMA, SMA, WMA, SMMA, HMA) и периода
Сопровождение сделки: выбор соотношения риска к прибыли, стоп-лосс определяется как мин/мах за определенное количество свечей (можно устанавливать желаемое количество), возможность частичной фиксации позиции с переносом стоп-лосса в безубыток, трейлинг-стоп, или закрытие позиции по противоположному сигналу.
Возможность ограничения стоп-лосса по ATR, чтобы при волатильных движениях он не был слишком большим.
Buscar en scripts para "ema"

Triple EMA + RSI + ATRThis comprehensive trading system combines triple EMA alignment, RSI momentum filtering, and dynamic ATR-based risk management. The strategy enters positions only when fast, medium, and slow EMAs align in proper order (bullish or bearish), confirmed by RSI remaining within defined thresholds (not overbought/oversold) and a volume spike above its moving average. Exits are managed intelligently using a multi-tier approach: a fixed stop-loss based on ATR, a first profit target at a predefined risk-reward ratio, and a trailing stop that activates after reaching a second, higher profit tier. Designed for trend-following with built-in momentum and volume confirmation, it features professional order execution with configurable commission and slippage for realistic backtesting. Visual cues including colored backgrounds and signal shapes enhance chart clarity.

PSAR with EMA FilterThis indicator combines the Parabolic SAR (PSAR) with an EMA trend filter to generate more accurate trend-following signals.
PSAR helps identify potential trend reversals and trailing stop levels, while the EMA ensures that trades are aligned with the overall market direction.

MACD with EMA FilterThis indicator combines the MACD (Moving Average Convergence Divergence) with an EMA-based trend filter to improve the quality of entry signals.
MACD identifies changes in momentum and potential trend reversals, while the EMA ensures that signals are taken only in the direction of the broader trend.

RSI with EMA FilterThis indicator combines the Relative Strength Index (RSI) with a trend-filtering Exponential Moving Average (EMA) to generate higher-quality momentum signals.
RSI identifies overbought and oversold market conditions, while the EMA confirms the overall trend direction, helping traders avoid false signals in choppy markets.

ATR Trend + RSI Pullback Strategy [Profit-Focused]This strategy is designed to catch high-probability pullbacks during strong trends using a combination of ATR-based volatility filters, RSI exhaustion levels, and a trend-following entry model.
Strategy Logic
Rather than relying on lagging crossovers, this model waits for RSI to dip into oversold zones (below 40) while price remains above a long-term EMA (default: 200). This setup captures pullbacks in strong uptrends, allowing traders to enter early in a move while controlling risk dynamically.
To avoid entries during low-volatility conditions or sideways price action, it applies a minimum ATR filter. The ATR also defines both the stop-loss and take-profit levels, allowing the model to adapt to changing market conditions.
Exit logic includes:
A take-profit at 3× the ATR distance
A stop-loss at 1.5× the ATR distance
An optional early exit if RSI crosses above 70, signaling overbought conditions
Technical Details
Trend Filter: 200 EMA – must be rising and price must be above it
Entry Signal: RSI dips below 40 during an uptrend
Volatility Filter: ATR must be above a user-defined minimum threshold
Stop-Loss: 1.5× ATR below entry price
Take-Profit: 3.0× ATR above entry price
Exit on Overbought: RSI > 70 (optional early exit)
Backtest Settings
Initial Capital: $10,000
Position Sizing: 5% of equity per trade
Slippage: 1 tick
Commission: 0.075% per trade
Trade Direction: Long only
Timeframes Tested: 15m, 1H, and 30m on trending assets like BTCUSD, NAS100, ETHUSD
This model is tuned for positive P&L across trending environments and volatile markets.
Educational Use Only
This strategy is for educational purposes only and should not be considered financial advice. Past performance does not guarantee future results. Always validate performance on multiple markets and timeframes before using it in live trading.

Extremum Range MA Crossover Strategy1. Principle of Work & Strategy Logic ⚙️📈
Main idea: The strategy tries to catch the moment of a breakout from a price consolidation range (flat) and the start of a new trend. It combines two key elements:
Moving Average (MA) 📉: Acts as a dynamic support/resistance level and trend filter.
Range Extremes (Range High/Low) 🔺🔻: Define the borders of the recent price channel or consolidation.
The strategy does not attempt to catch absolute tops and bottoms. Instead, it enters an already formed move after the breakout, expecting continuation.
Type: Trend-following, momentum-based.
Timeframes: Works on different TFs (H1, H4, D), but best suited for H4 and higher, where breakouts are more meaningful.
2. Justification of Indicators & Settings ⚙️
A. Moving Average (MA) 📊
Why used: Core of the strategy. It smooths price fluctuations and helps define the trend. The price (via extremes) must cross the MA → signals a potential trend shift or strengthening.
Parameters:
maLength = 20: Default length (≈ one trading month, 20-21 days). Good balance between sensitivity & smoothing.
Lower TF → reduce (10–14).
Higher TF → increase (50).
maSource: Defines price source (default = Close). Alternatives (HL2, HLC3) → smoother, less noisy MA.
maType: Default = EMA (Exponential MA).
Why EMA? Faster reaction to recent price changes vs SMA → useful for breakout strategies.
Other options:
SMA 🟦 – classic, slowest.
WMA 🟨 – weights recent data stronger.
HMA 🟩 – near-zero lag, but “nervous,” more false signals.
DEMA/TEMA 🟧 – even faster & more sensitive than EMA.
VWMA 🔊 – volume-weighted.
ZLEMA ⏱ – reduced lag.
👉 Choice = tradeoff between speed of reaction & false signals.
B. Range Extremes (Previous High/Low) 📏
Why used: Define borders of recent trading range.
prevHigh = local resistance.
prevLow = local support.
Break of these levels on close = trigger.
Parameters:
lookbackPeriod = 5: Searches for highest high / lowest low of last 5 candles. Very recent range.
Higher value (10–20) → wider, stronger ranges but rarer signals.
3. Entry & Exit Rules 🎯
Long signals (BUY) 🟢📈
Condition (longCondition): Previous Low crosses MA from below upwards.
→ Price bounced from the bottom & strong enough to push range border above MA.
Execution: Auto-close short (if any) → open long.
Short signals (SELL) 🔴📉
Condition (shortCondition): Previous High crosses MA from above downwards.
→ Price rejected from the top, upper border failed above MA.
Execution: Auto-close long (if any) → open short.
Exit conditions 🚪
Exit Long (exitLongCondition): Close below prevLow.
→ Uptrend likely ended, range shifts down.
Exit Short (exitShortCondition): Close above prevHigh.
→ Downtrend likely ended, range shifts up.
⚠️ Important: Exit = only on candle close beyond extremes (not just wick).
4. Trading Settings ⚒️
overlay = true → indicators shown on chart.
initial_capital = 10000 💵.
default_qty_type = strategy.cash, default_qty_value = 100 → trades fixed $100 per order (not lots). Can switch to % of equity.
commission_type = strategy.commission.percent, commission_value = 0.1 → default broker fee = 0.1%. Adjust for your broker!
slippage = 3 → slippage = 3 ticks. Adjust to asset liquidity.
currency = USD.
margin_long = 100, margin_short = 100 → no leverage (100% margin).
5. Visualization on Chart 📊
The strategy draws 3 lines:
🔵 MA line (thickness 2).
🔴 Previous High (last N candles).
🟢 Previous Low (last N candles).
Also: entry/exit arrows & equity curve shown in backtest.
Disclaimer ⚠️📌
Risk Warning: This description & code are for educational purposes only. Not financial advice. Trading (Forex, Stocks, Crypto) carries high risk and may lead to full capital loss. You trade at your own risk.
Testing: Always backtest & demo test first. Past results ≠ future profits.
Responsibility: Author of this strategy & description is not responsible for your trading decisions or losses.

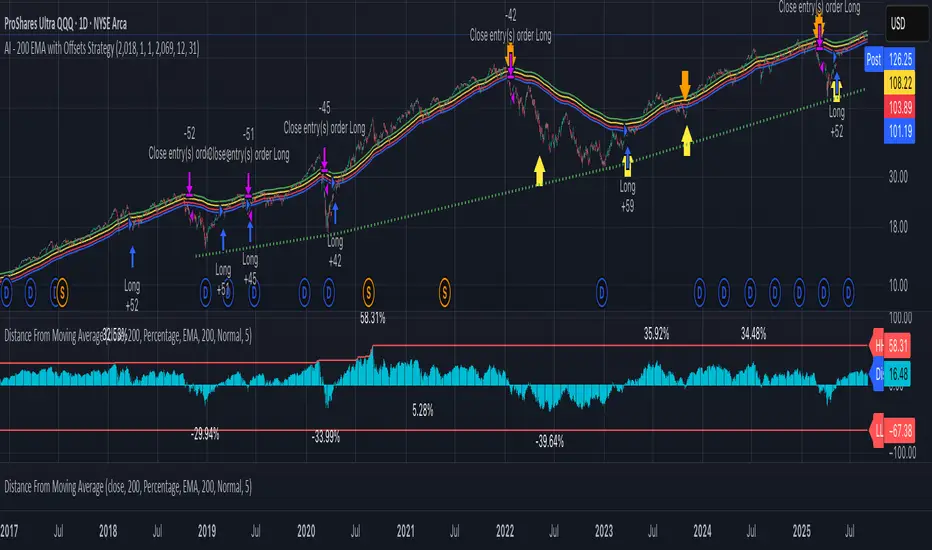
AI - 200 EMA with Offsets StrategyLong when close price crosses above +4% offset 200 day EMA
Sell when close price crosses below -6.5% offset 200 day EMA
Script_Algo - Fibo Correction Strategy🔹 Core Concept
The strategy is built on combining Fibonacci retracement levels, candlestick pattern confirmation, and trend filtering for trade selection. It performs well on the 1-hour timeframe across many cryptocurrency pairs. Particularly on LINKUSDT over the past year and a half, despite the not very optimal 1:1 risk/reward ratio.
The logic is simple: after a strong impulse move, the price often retraces to key Fibonacci levels (specifically, the 61.8% level). If a confirming candlestick (pattern) appears at this moment, the strategy looks for an entry in the direction of the main trend.
🔹 Indicators Used in the Strategy
ATR (Average True Range) — Used to calculate the stop-loss and take-profit levels.
EMA (9 and 21) — Additional moving averages for assessing the direction of movement (not directly used in entry conditions, but the logic can be expanded to include them).
SMA (Trend Filter, 20 by default) — The trend direction filter. Trades are only opened in its direction.
Fibonacci Levels — The 61.8% retracement level is calculated based on the high and low of the previous candle.
🔹 Entry Conditions
🟢 Long (Buy):
Previous Candle:
Must be green (close higher than open).
Must have a body not smaller than a specified minimum.
The upper wick must not exceed 30% of the body size.
→ This filters out "weak" or "indecisive" candles.
Current Candle:
Price touches or breaches the Fibonacci 61.8% retracement level from the previous range.
Closes above this level.
Closes above the Trend Filter (SMA) line.
A position is opened only if there are no other open trades at the moment.
🔴 Short (Sell):
Previous Candle:
Must be red (close lower than open).
Must have a body not smaller than a specified minimum.
The lower wick must not exceed 30% of the body size.
Current Candle:
Price touches or breaches the Fibonacci 61.8% retracement level from the previous range.
Closes below this level.
Closes below the Trend Filter (SMA) line.
A trade is opened only if there are no other open positions.
🔹 Risk Management
Stop-Loss = ATR × multiplier (default is 5).
Take-Profit = ATR × the same multiplier.
Thus, the default risk/reward ratio is 1:1, but it can be easily adjusted by changing the coefficient. Although, strangely enough, this ratio has shown the best results on some assets on the 1-hour timeframe.
🔹 Chart Visualization
Fibonacci level for Long — Green line with circles.
Fibonacci level for Short — Red line with circles.
Trend Filter line (SMA) — Blue.
🔹 Strengths of the Strategy
✅ Utilizes a proven market pattern — retracement to the 61.8% level.
✅ Further filters entries using trend and candlestick patterns.
✅ Simple, transparent logic that is easy to expand (e.g., adding other Fib levels, an EMA filter, etc.).
🔹 Limitations
⚠️ Performs better in trending markets; can generate false signals during ranging (sideways) conditions.
⚠️ The fixed 1:1 risk/reward ratio is not always optimal and could be refined.
⚠️ Performance depends on the selected timeframe and ATR parameters.
📌 Summary:
The strategy seeks corrective entries in the direction of the trend, confirmed by candlestick patterns. It is versatile and can be applied to forex pairs, cryptocurrencies, and stocks.
⚠️ Not financial advice. Pay close attention to risk management to avoid blowing your account. The strategy is not repainting — I have personally verified it through real testing — but it may not necessarily replicate the same results in the future, as the market is constantly changing. Test it, profit, and good luck to everyone!

PowerTrend Pro Strategy – Gold OptimizedTired of false signals on Gold?
PowerTrend Pro combines VWAP, Supertrend, RSI, and smart MA filters with trailing stops & break-even logic to deliver high-probability trades on XAUUSD.
PowerTrend Pro Strategy is a professional-grade trading system designed to capture high-probability swing and intraday opportunities on XAUUSD (Gold) and other volatile markets.
🔑 Core Features
VWAP Anchoring – institutional fair value reference to filter trades.
Supertrend (ATR-based) – adaptive trend filter tuned for Gold’s volatility.
Multi-Timeframe RSI – confirms momentum alignment across intraday and higher timeframe.
EMA + SMA Combo – ensures trades follow strong directional bias, reducing false signals.
Dynamic Risk Management
Adjustable Take Profit / Stop Loss (%)
Trailing Stop that locks in profits on extended moves
Break-Even Logic (stop loss moves to entry once price is in profit)
⚡ Gold-Tuned Presets
XAUUSD 1H → tighter TP/SL & faster entries for active intraday trading.
XAUUSD 4H → wider ATR filter & trailing stops to capture bigger swings.
Generic Mode → works on Forex, Indices, and Crypto (fully customizable).
🎯 Why It Works
Gold is notoriously volatile — quick spikes wipe out weak strategies. PowerTrend Pro solves this by combining:
✅ Institutional bias (VWAP)
✅ Adaptive trend filter (Supertrend)
✅ Momentum confirmation (RSI MTF)
✅ Robust trend structure (EMA + SMA)
✅ Smart exits (TP, SL, trailing & breakeven)
This multi-layer confirmation makes entries stronger and keeps risk under control.
🛠️ Usage
Add the strategy to your chart.
Choose a preset (XAUUSD 1H, 4H, or Generic).
Run Strategy Tester for performance metrics.
Optimize TP/SL and ATR values for your broker & market conditions.
🔥 Pro Tip: Combine this strategy with a session filter (London/NY overlap) or volume confirmation to boost accuracy in Gold.

Bollinger + EMA Strategy with StatsThis strategy is a mean-reversion trading model that combines Bollinger Band deviation entries with EMA-based exits. It enters a long position when the price drops significantly below the lower Bollinger Band by a user-defined multiple of standard deviation (x), and a short position when the price exceeds the upper band by the same logic. To manage risk, it uses a wider Bollinger Band threshold (y standard deviations) as a stop loss, while take profit occurs when the price reverts to the n-period EMA, indicating mean reversion. The strategy maintains only one active position at a time—either long or short—and allocates a fixed percentage of capital per trade. Performance metrics such as equity curve, drawdown, win rate, and total trades are tracked and displayed for backtesting evaluation.

RTB - Momentum Breakout Strategy V3
📈 RTB - Momentum Breakout Strategy V3 is a directional breakout strategy based on momentum. It combines exponential moving averages (EMAs), RSI, and recent support/resistance levels to detect breakout entries with trend confirmation. The system includes dynamic risk management using ATR-based stop-loss and trailing stop levels. Webhook alerts are supported for external automated trading integrations.
🔎 The strategy was backtested using default parameters on BTCUSDT Futures (Bybit) with 4-hour timeframe and a 0.05% commission per trade.
⚠️ This script is for educational purposes only and does not constitute financial advice. Always do your own research before trading.

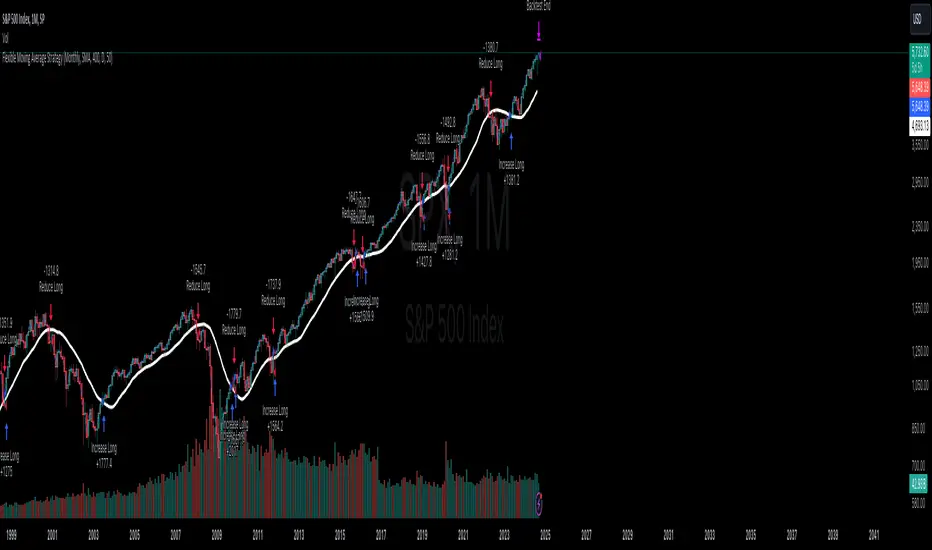
Flexible Moving Average StrategyThis strategy offers flexibility to choose between SMA and EMA, and allows users to set the review frequency to Daily, Weekly, or Monthly. It adapts to different market conditions by providing full control over the length and timeframe of the Moving Average.
### Key Features:
- **Moving Average Method**: Select between SMA and EMA.
- **Review Frequency**: Choose Daily, Weekly, or Monthly review periods.
- **Customizable**: Set the Moving Average length and timeframe.
- **Entry/Exit Rules**:
- **Enter Long**: When the close price is above the Moving Average at the end of the period.
- **Exit**: When the close price falls below the Moving Average.
### Parameters:
- **Review Frequency**: Daily, Weekly, Monthly
- **Moving Average Method**: SMA or EMA
- **Length & Timeframe**: Fully adjustable
This strategy suits traders who prefer a flexible, trend-following approach based on long-term price movements.
Trend Magic with EMA, SMA, and Auto-TradingRelease Notes
Strategy Name: Trend Magic with EMA, SMA, and Auto-Trading
Purpose: This strategy is designed to capture entry and exit points in the market using the Trend Magic indicator and three moving averages (EMA45, SMA90, and SMA180). Specifically, it uses the perfect order of the moving averages and the color changes in Trend Magic to identify trend reversals and potential trading opportunities.
Uniqueness and Usefulness
Uniqueness: The strategy utilizes the Trend Magic indicator, which is based on price and volatility, along with three moving averages to assess the strength of trends. The signals are generated only when the moving averages are in perfect order, and the Trend Magic color changes, ensuring that the entry is made during established trends. This combination provides a higher degree of reliability compared to strategies that rely solely on price action or single indicators.
Usefulness: This strategy is particularly useful for traders looking to capture trends over longer periods. It is effective at reducing noise in the market, only providing signals when the moving averages align and the Trend Magic indicator confirms a trend reversal. It works well in both trending and volatile markets.
Entry Conditions
Long Entry:
Condition: A perfect order (EMA45 > SMA90 > SMA180) is established, and Trend Magic changes color from red to blue.
Signal: A buy signal is generated, indicating the start of an uptrend.
Short Entry:
Condition: A perfect order (EMA45 < SMA90 < SMA180) is established, and Trend Magic changes color from blue to red.
Signal: A sell signal is generated, indicating the start of a downtrend.
Exit Conditions
Exit Strategy:
This strategy automatically enters and exits trades based on signals, but traders are encouraged to manage exits manually according to their own risk management preferences. The strategy includes stop loss and take profit settings based on risk-to-reward ratios for better risk management.
Risk Management
The strategy includes built-in risk management by using the SMA90 level at the time of entry as the stop-loss point and setting the take profit at a 1:1.5 risk-to-reward ratio. The stop-loss level is fixed at the entry point and does not move as the market progresses. Traders are advised to implement additional risk management, such as trailing stops, for added protection.
Account Size: ¥100,000
Commissions and Slippage: Assumes 94 pips for commissions and 1 pip for slippage per trade
Risk per Trade: 10% of account equity (adjust this based on personal risk tolerance)
Configurable Options
Configurable Options:
CCI Period: Set the period for the CCI used to calculate the Trend Magic indicator (default is 21).
ATR Multiplier: Set the multiplier for ATR used in the Trend Magic calculation (default is 1.0).
EMA/SMA Periods: The periods for the three moving averages (default is EMA45, SMA90, and SMA180).
Signal Display Control: An option to toggle the display of buy and sell signals on the chart.
Adequate Sample Size
To ensure the robustness and reliability of this strategy, it is recommended to backtest it with a sufficiently long period of historical data. Testing across different market conditions, including high and low volatility periods, is also advised.
Credits
Acknowledgments:
This strategy is based on the Trend Magic indicator combined with moving averages and draws on contributions from the technical analysis and trading community.
Clean Chart Description
Chart Appearance:
To maintain a clean and simple chart, this strategy includes options to turn off the display of Trend Magic, moving averages, and entry signals. Traders can adjust these display settings as needed to minimize visual clutter and focus on effective trend analysis.
Addressing the House Rule Violations
Omissions and Unrealistic Claims
Clarification:
This strategy does not make any unrealistic or unsupported claims about its performance. All signals are intended for educational purposes only and do not guarantee future results. It is important to note that past performance does not guarantee future outcomes, and proper risk management is crucial.

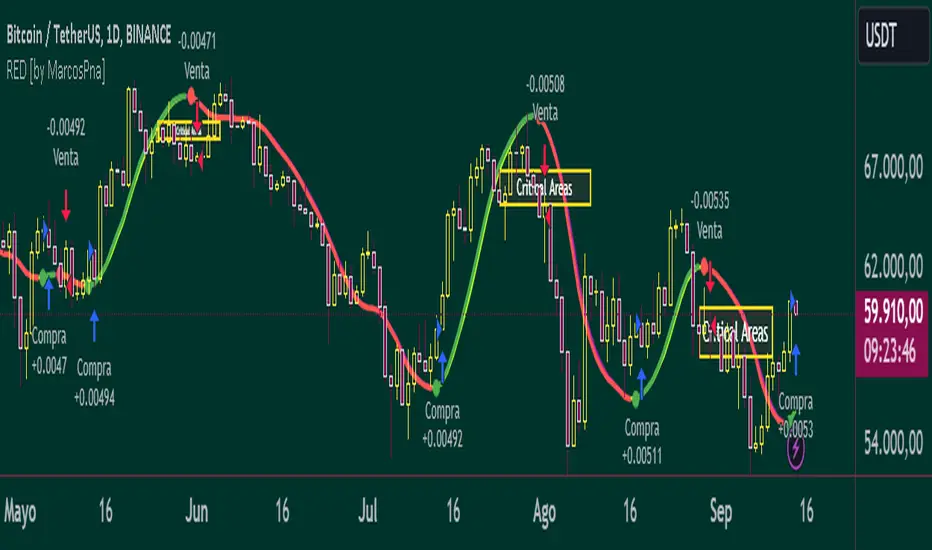
Reflected ema Difference (RED) This script, titled "Reflected EMA Difference (RED)," is based on the logic of evaluating the percentage of convergence and divergence between two moving averages, specifically the Hull Moving Averages (HMA), to make price-related decisions. The Hull Moving Average, created by Alan Hull, is used as the foundation of this strategy, offering a faster and more accurate way to analyze market trends. In this script, the concept is employed to measure and reflect price variations.
Script Functionality Overview:
Hull Moving Averages (HMA): The script utilizes two HMAs, one short-term and one long-term. The main idea is to compute the Delta Difference between these two moving averages, which represents how much they are converging or diverging from each other. This difference is key to identifying potential market trend changes.
Reflected HMA Value: Using the Delta Difference between the HMAs, the value of the short-term HMA is reflected, creating a visual reference point that helps traders see the relationship between price and HMAs on the chart.
Percentage Change Index: The second key parameter is the percentage change index. This determines when a trend is reversing, allowing buy or sell orders to be established based on significant changes in the relationship between the HMAs and the price.
Delta Multiplier: The script comes with a default Delta multiplier of 2 for calculating the difference between HMAs, allowing traders to adjust the sensitivity of the analysis based on the time frame being analyzed.
Trend Reversal Signals: When the price crosses the thresholds defined by the percentage change index, buy or sell signals are triggered, based on the detection of a potential trend reversal.
Visual Cues with Boxes: Boxes are drawn on the chart when the HullMA crosses the reflected HMA value, providing a visual aid to identify critical moments where risk should be evaluated.
Alerts for Receiving Signals:
This script allows you to set up buy and sell alerts via TradingView's alert system. These alerts are triggered when trend changes are detected based on the conditions coded in the script. Traders can receive instant notifications, allowing them to make decisions without needing to constantly monitor the chart.
Additional Considerations:
The percentage change parameter is adjustable and should be configured based on the time frame you are trading on. For longer time frames, it's advisable to use a larger percentage change to avoid false signals.
The use of Hull Moving Averages (HMA) provides a faster and more reactive approach to trend evaluation compared to other moving averages, making it a powerful tool for traders seeking quick reversal signals.
This approach combines the power of Hull Moving Averages with an alert system to improve the trader’s response to trend changes.
Spanish
Este script, titulado "Reflected EMA Difference (RED)", está fundamentado en la lógica de evaluar el porcentaje de acercamiento y distancia entre dos medias móviles, específicamente las medias móviles de Hull (HMA), para tomar decisiones sobre el valor del precio. El creador de la media móvil de Hull, Alan Hull, diseñó este indicador para ofrecer una forma más rápida y precisa de analizar tendencias de mercado, y en este script se utiliza su concepto como base para medir y reflejar las variaciones de precio.
Descripción del funcionamiento:
Medias Móviles de Hull (HMA): Se utilizan dos HMAs, una de corto plazo y otra de largo plazo. La idea principal es calcular la diferencia Delta entre estas dos medias móviles, que representa cuánto se están alejando o acercando entre sí. Esta diferencia es clave para identificar cambios potenciales en la tendencia del mercado.
Valor Reflejado de la HMA: Con la diferencia Delta calculada entre las HMAs, se refleja el valor de la HMA corta, creando un punto de referencia visual que ayuda a los traders a observar la relación entre el precio y las HMAs en el gráfico.
Índice de Cambio de Porcentaje: El segundo parámetro clave del script es el índice de cambio porcentual. Este define el momento en que una tendencia está revirtiendo, permitiendo establecer órdenes de compra o venta en función de un cambio significativo en la relación entre las HMAs y el precio.
Multiplicador Delta: El script tiene un multiplicador predeterminado de 2 para el cálculo de la diferencia Delta, lo que permite ajustar la sensibilidad del análisis según la temporalidad del gráfico.
Señales de Reversión de Tendencia: Cuando el precio cruza los límites definidos por el índice de cambio porcentual, se emiten señales para comprar o vender, basadas en la detección de una posible reversión de tendencia.
Visualización con Cajas: Se dibujan cajas en el gráfico cuando el indicador HullMA cruza el valor reflejado de la HMA, ayudando a identificar visualmente los momentos críticos en los que se debe evaluar el riesgo de las operaciones.
Alertas para Recibir Señales:
Este script permite configurar alertas de compra y venta desde el apartado de alertas de TradingView. Estas alertas se activan cuando se detectan cambios de tendencia en función de las condiciones establecidas en el código. El trader puede recibir notificaciones instantáneas, lo que facilita la toma de decisiones sin necesidad de estar constantemente observando el gráfico.
Consideraciones adicionales:
El porcentaje de cambio es un parámetro ajustable y debe configurarse según la temporalidad que se esté operando. En temporalidades más largas, es recomendable usar un porcentaje de cambio mayor para evitar señales falsas.
La utilización de las medias móviles de Hull (HMA) proporciona un enfoque más rápido y reactivo para evaluar tendencias en comparación con otras medias móviles, lo que lo convierte en una herramienta poderosa para traders que buscan señales rápidas de reversión.
Este enfoque combina la potencia de las medias móviles de Hull con un sistema de alertas que mejora la reactividad a cambios de tendencia.
Combo 2/20 EMA & CCI
This is another part of my research work, where I test a combination of two strategies, receiving a combined signal. In order to understand which indicator combinations work better, which work worse, as filters for trades. This is combo strategies for get a cumulative signal.
First strategy
This indicator plots 2/20 exponential moving average. For the Mov Avg X 2/20 Indicator, the EMA bar will be painted when the Alert criteria is met.
Second strategy
The Commodity Channel Index (CCI) is best used with markets that display cyclical or seasonal characteristics, and is formulated to detect the beginning and ending of the cycles by incorporating a moving average together with a divisor that reflects both possible and actual trading ranges. The final index measures the deviation from normal, which indicates major changes in market trend.
Strategy tester settings:
Initial capital: 1000
Order size: 0.5
Commission: 0.1%
Other as default.
Indicator settings:
EMA Length: 50
CCI Length: 10
Fast MA Length: 15
Slow MA Length: 20
Other as default.
WARNING:
- For purpose educate only
- This script to change bars colors.

BitBell - EMA PullBack RSI EXO
🔵 Introduction
Version 1.1
This is a Pine 5 trend following strategy. It has a four strategy with several alerts and signals. The design intent is to produce a commercial grade signal generator that can be adapted to any symbol in cryptocurrency and only 1H Chart. Ideally, the script is reliable enough to be the basis of an automated trading system web-hooked to a server with API access to crypto brokerages. The strategy can be run in three different modes: long, short and bidirectional.
As a trend following strategy, the behavior of the script is to buy on strength and sell on weakness. As such the trade orders maintain its directional bias according to price pressure. What you will see on the chart is long positions on the left side of the mountain and short on the right. Long and short positions are not intermingled as long as there exists a detectable trend. This is extremely beneficial feature in long running bull or bear markets. The script uses multiple setups to avoid the situation where you got in on the trend, took a small profit but couldn’t get back in because the logic is waiting for a pullback or some other intricate condition.
Deep draw-downs are a characteristic of trend following systems and this system is no different. However, this script makes use of the TradingView pyramid feature with three NPUs to find better place and even you can change drop percentage in settings for another trigger, accessible from the properties tab.
When trend market break it will stop the trade and usually it takes 2-4 percent loss but don't worry it has prefect money management and you can use it for Futures market and even Spot market.
🔵 Design
This script uses twelve indicators on two time frames. The chart (primary) interval and one higher time frame which is based on the primary. The higher time frame identifies the trend for which the primary will trade. I’ve tried to keep the higher time frame around five times greater than the primary. The original trading algorithms are a port from a much larger program on another trading platform. I’ve converted some of the statistical functions to use standard indicators available on TradingView. The setups make heavy use of the Hull Moving Average in conjunction with EMAs that form the Bill Williams Alligator as described in his book “New Trading Dimensions” Chapter 3. Lag between the Hull and the EMAs form the basis of the entry and exit points. The alligator itself is used to identify the trend main body.
The entire script is around 740 lines of Pine code which is the maximum incidental size given the TradingView limits: local scopes, run-time duration and compile time. I’ve been working on this script for over a year and have tested it on various instruments stock crypto. It performs well on higher liquidity markets that have at least a year of historical data. Though it can be configured to work on any interval between 15 minutes and 4 hour, trend trading is generally a longer term paradigm. For day trading the 10 to 15 minute interval will allow you to catch momentum breakouts. For intraweek trades 30 minutes to 1 hour should give you a trade every other a day.
Inputs to the script use cone centric measurements in effort to avoid exposing adjustments to the various internal indicators. The goal was to keep the inputs relevant to the actual trade entry and exit locations as opposed to a series of MA input values and the like. As a result the strategy exposes over 12 inputs grouped into long or short sections. Inputs are available for the usual minimum profit and stop-loss as well as trade, modes, presets, reports and lots of calibrations. The inputs are numerous, I’m aware. Unfortunately, at this time, TradingView does not offer any other method to get data in the script. The usual initialization files such as cnf, cfg, ini, json and xml files are currently unsupported.
Example configurations for various instruments along with a detailed PDF user manual is available.
it has no repaint i guaranty this, and you can have 10 days free with comment and check it by yourself
One issue that comes up when comparing the strategy with the study is that the strategy trades show on the chart one bar later than the study. This problem is due to the fact that “strategy.entry()” and “strategy_close()” do not execute on the same bar called. The study, on the other hand, has no such limitation since there are no position routines. However, alerts that are subsequently fired off when triggered in the study are dispatched from the TradingView servers one bar later from the study plot. Therefore the alert you actually receive on your cell phone matches the strategy plot but is one bar later than the study plot.
Please be aware that the data source matters. Cryptocurrency has no central tick repository so each exchange supplies TradingView its feed. Even though it is the same symbol the quality of the data and subsequently the bars that are supplied to the chart varies with the exchange. This script will absolutely produce different results on different data feeds of the same symbol. Be sure to backtest this script on the same data you intend to receive alerts for. Any example settings I share with you will always have the exchange name used to generate the test results.
🟡 Usage
It sends long and short signals with pyramid orders of up to 3, meaning that the strategy can trigger up to 3 orders in the same direction. Good risk and money management.
It's important to note that the strategy combines 2 systems working together (Long and LongX). Let’s describe the specific features of this strategy.
🔵 If Findes Supports And Ressitances And Trend Lines As Best As It Can, And You Can See:
🟢 Frist Simple Long Condition = It Look At The Trend Wait For RSI Cross 30 Number Then Ckeck Risk To Reward, check something else such as divergence:
🟢 Another Long Example:
🔴 Frist Simple Short Condition = It Look At The Trend Wait For RSI Cross 70 Number Then Ckeck Risk To Reward, check something else such as divergence:
🔴 Another Short Example:
The following steps provide a very brief set of instructions that will get you started but will most certainly not produce the best backtest. A trading system that you are willing to risk your hard earned capital will require a well crafted configuration that involves time, expertise and clearly defined goals. As previously mentioned, I have several example configs that I use for my own trading that I can share with you along with a PDF which describes each input in detail. To get hands on experience in setting up your own symbol from scratch please follow the steps below.
The input dialog box contains over 12 inputs, There are four options must to be configured: Choose Target, side, Choose Settings, Money Management,and settings that apply to both. The following steps address these four main options only.
Money Management System For Leverage 10:
Bot Finds Last Lower Low And Calculate Distance From Entry Price, Then Cross It To Initial Capitan And Cross Leverage =>
Position_Size = (((1.64) * (initial Capital)) * (leverage))
And Check Dominances Too For Getting Best Money Management Result
🔵 Settings
* Side, You Can Set Long Or Short Or Both.
* Choose Target, You Can Set One Target Or All Targets.
* Money Management, You Can ON Or OFF It, With OFF You Can USE It For SPOT Trades.
* Choose Settings, In This Field You Can Set Mathematical Optimization, Ddepends On Which Pair You USE.
* Clear With Daily PullBack?, With This Check Box You Can Clear Signals With Daily PullBack.
* Long X, You Can Set Long Leverage.
* Short X, You Can Set Short Leverage.
* Second Order X, You Can Set Pyramiding Leverage.
* Target Long, You Can Set Percent For Long Target.
* Target Short, You Can Set Percent For Short Target.
* Short Martin Percent, You Can Set Short Martingale Percent.
* Long Martin Percent, You Can Set Long Martingale Percent.
🟡 Pyraming 3
🟡 Commission Is 0.065 %
🟡 Slippage Is 10 ticks
🔴Only Use For 1 Hour Chart
🔴 CONCLUSION
We believe that success lies in the association of the user with the indicator, opposed to many traders who have the perspective that the indicator itself can make them become profitable. The reality is much more complicated than that.
The aim is to provide an indicator comprehensive, customizable, and intuitive enough that any trader can be led to understand this truth and develop an actionable perspective of technical indicators as support tools for decision making.
🔴 RISK DISCLAIMER
Trading is risky & most day traders lose money. All content, tools, scripts, articles, & education provided by BitBell are purely for informational & educational purposes only. Past performance does not guarantee future results.

Equity Curve Trading with EMAWhat Is Equity Curve Trading?
In equity curve trading, traders apply a moving average to the curve. The idea is when the equity curve drops below the moving average, the strategy is put on hold. This is done to stop losses when either the hopes of the plan working start dimming or when the trader knows he cannot afford more losses on a strategy. The trader can resume trading this particular strategy when the equity curve is above the moving average.
Equity Curve Trading puts an investor at the ease of knowing that his investment is covered even when he is not actively tracking his strategy. When the equity curve dips below a level investor is comfortable with, it can be paused until such time that the equity curve is back above the determined moving average.
Example:
Equity Curve Trading Example
Trading Strategy
I choosed the SuperTrend strategy for BTCUSDT on 4 hour time frame. That shows nice equity curve with default settings. Let's find out and check can we improve the equity curve with this modern money management trade method?
Some shift is exist in original equity curve relatively to filtered equity curve, because of array usage, but it is not affected on calculations.
Conclusion
I tested a different time frames, settings and equity curves shapes, but it not gives advantages in equity curve. You can look at the table on the top right corner of the strategy with equity curve and you will see some statistic information for the original strategy and for the modified equity curve trade strategy. In most cases we have lower Win Rate and lower Net Profit after turning on Equity curve trading method. In some cases this can be help if you have the equity curve looks like at the picture above, but this equity curve is really bad for choosing this strategy to trade. I found that EMA works better than SMA, and RMA works better then EMA applied to Equity Curve. You can test your strategy with this trade method if you want, I make the source code opened for it. Please share your results, I hope it will helps.
Conclusion 2
Equity Curve Trading definitely has its proponents in the industry, some of them quite vocal. But, the overall efficacy of the approach is certainly not crystal clear. In fact, what is clear is that it is relatively easy to take a good strategy, and significantly degrade its performance by employing equity curve trading. While the overall objective of equity curve trading is unquestionable – cease trading poor performing strategies - it is probable that there are better ways of accomplishing that goal. From this study, the conclusion is equity curve trading with simple indicators has more downside than upside.

Wunder Trend Reversal botWunder Trend Reversal bot
1. Wunder Trend Reversal Bot - this has only one goal to find a reversal of the trend.
2. The strategy determines, based on the specified value for the filter, a market reversal based on the price actions of the previous bars.
3. A short EMA is used to filter false signals after the reversal signal was received. Crossing the EMA and changing its direction confirms the trend change.
4. There are 2 ways to calculate stop loss and take profit. You can choose one of them:
- Classic stop loss and take profit in a fixed percentage
- ATR stop loss and take pro
5. ATR uses risk reward (R:R) to calculate take profit. The script calculates the risk-reward based on a certain stop loss level and uses it to calculate the take profit
6. A function for calculating risk on the portfolio (your deposit) has been added to the script. When this option is enabled, you get a calculation of the entry amount in dollars relative to your Stop Loss. In the settings, you can select the risk percentage on your portfolio. The loss will be calculated from the amount that will be displayed on the chart.
For example. Deposit - $1000, you set the risk to 1%. SL 5%. Entry volume will be $200. The loss at SL will be $10.10$ this is your 1% risk or 1% of the deposit.
Important! The risk per trade must be less than the Stop Loss value. If the risk is greater than SL, then you should use leverage.
The amount of funds entering the trade is calculated in dollars. This option was created if you want to send the dollar amount from Tradingview to the exchange. However, putting your volume in dollars you get the incorrect net profit and drawdown indication in the backtest results, as TradingView calculates the backtest volume in contracts.
To display the correct net profit and drawdown values in Tradingview Backtest results, use the ”Volume in contracts” option.

oussamacryptoWhat Is an Exponential Moving Average (EMA)?
An exponential moving average (EMA) is a type of moving average (MA) that places a greater weight and significance on the most recent data points. The exponential moving average is also referred to as the exponentially weighted moving average. An exponentially weighted moving average reacts more significantly to recent price changes than a simple moving average simple moving average (SMA), which applies an equal weight to all observations in the period.

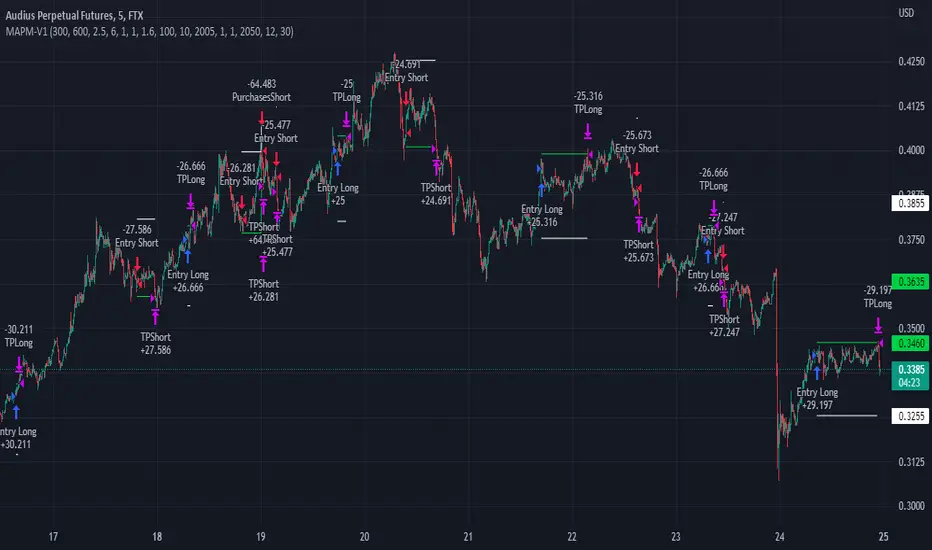
MAPM-V1Greetings dear traders!
I would like to introduce you the script for testing the strategy by crossing two signal EMAs based on the MACD indicator.
In the strategy itself:
The entry is made as a percentage of the deposit by EMA crossings.
There are additional purchases, they are set from the entry price for a given percentage in the opposite direction of the transaction.
The distance in percentage from the entry price, on which the additional purchase is exposed, is set in the StepAddPurchases parameter.
The Martingale parameter increases the initially purchased amount of the base traded cryptocurrency in each additional purchase.
The essence of the strategy is to trade a large number of pairs in order to diversify risks and obtain a stable income.
It is desirable to enter each trading pair with a small percentage of the deposit.
The optimization result shows the trading result for the period of 5000 bars (the platform does not give more history) on 10% of the deposit for the first transaction, the addition will also take place on initially bought amount of base traded cryptocurrency, multiplied by the martingale parameter, raised by the number of addition.
The strategy will still be updated, so see you soon!
5 Minute Scalping StrategyTaking entrys based on the 1 minute timeframe MACD
only taking longs when all emas are in the correct order and there is a bigger than usual MACD downtick and the RSI is above 51
only taking shorts when all emas are in the opposite order and there is a bigger than usual uptick on the MACD and the RSI is bellow 49
bigger than usual ticks are defined by bollinger bands around the Macd and the ticks have to be higher than 35 and lower than -10
you can change whatever setting you like to make the strategy more profitible. pls share when you find a more profitible setting than me
the stoploss doesnt work correct if it would be hit in the same candle you enter the trade. pls share when you have a solution for this
the stratagy is profitible when i backtested it for the last month, but i dont know how it will play out in the future, so you enter the signals at your own risk

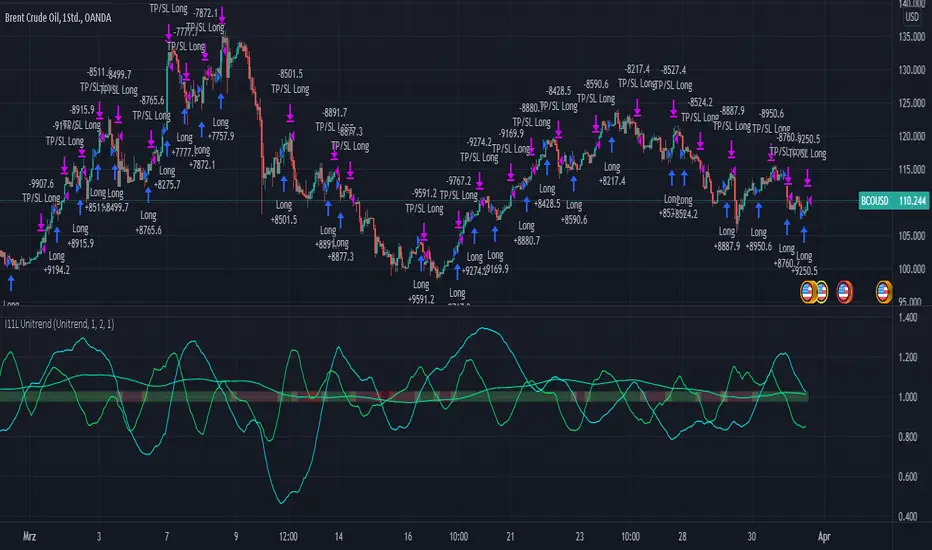
RSI, EMA, SMA Trendtrading - Oil Daytrading 1HThe Unitrend trading System produces trading recommendations on a pure Trend basis.
It is a Score based system.
--- How to use the System --
Simply adjust your capital you want to risk per trade and your TP Factor.
The TP Factor is the multiple of your risked Capital, also known as Risk/Reward ratio.
Furthermore you can toggle between a always Buy mode, to see if the System is better then market.
Compounding mode helps you to get a better understanding of your maximum drawdown with a total equity based approach.
--- How are Signals produced? ---
A score of 2 or 3 is a BUY signal.
You can count the score by looking at the lines above 1, or by reading the color.
Green is 3, yellow 2, orange 1 and red is 0.
The score is calculated by 3 conditions.
Each applying condition yields one point for the score.
The score resets each bar.
The rules are:
RSI > 45: Well known indicator, usually looks for reversal points but seems to produce above average results when above 45.
EMA(RSI) > SMA(RSI): My approach to momentum detection for the RSI movement, I consider a faster growing RSI as a good thing.
EMA(close) > SMA(close): My approach to trend detection for the market movement. Common Wisdom would be a fast SMA > slow SMA which I found to be too slow for the modern market.